Square
Following
Hot
News
Profile
Share your thoughts
placeholder
Article
$ZEREBRO Up 50% in a day, but if you rush in, you may be the one left standing guard at the top.
It’s like the market is about to close when someone suddenly shouts, “This batch of cabbages will be discontinued tomorrow!” and a crowd goes crazy buying them, pushing the price from ¥0.8 to ¥1.2. You see the 46% gain today and decide to enter, which is no different from those aunties rushing in to grab vegetables five minutes before closing. You got the vegetables, but when you get home, you find there are already three cabbages in the fridge.
Now, the serious part. ZEREBRO is currently at 0.0478
ZEREBRO+42.97%
Long $ARC is expected to rebound toward the upper resistance level. Entry point: ⁠0.0418 - 0.0425⁠ (near the current price ⁠0.04227⁠) Stop Loss (STL): ⁠0.0395⁠ (below the recent structural low area) Take Profit targets (TP): TP1: ⁠0.0470⁠ (short-term resistance / previous high-volume area) TP2: ⁠0.0525⁠ (middle area of the price channel / intermediate resistance) TP3: ⁠0.0585⁠ (higher target in the previous high area / long-term EMA)
post-image
ARC+39.79%
ARIA up over 13%! How far can a rally without an announcement go?
ARIA rose 13.19% in one day to $0.03578.
No official independent news or partnership reports were found today. This was an unorganized push by thin-market liquidity at low levels.
Conclusion: Lacking trend sustainability; get in and out quickly, and take profits when the opportunity arises.
‍#ARIA #山寨币 #薄盘
$ARIA #hotmoney
post-image
ARIA+17.68%
PPI data - tonight. BTC / ETH Market Updates
live-cover
LIVE2,966
Us stocks and BTC both come under pressure
live-cover
LIVE2,973
$BNB Water over Heaven, Kan above Qian below. The clouds are already in the sky, but the rain has yet to fall; the Hexagram of Waiting is all about waiting. With the third line changing, “Waiting in the mud invites bandits,” meaning that stubbornly waiting at the edge of the mud instead brings trouble. It changes into Water over Lake, Limitation.
The daily low of 716.5 on October 8 held for a week, but this morning the four-hour chart broke below it on heavy volume, reaching a low of 708.5, with the current price around 720. The price has fallen back below the daily EMA50 (around 733), while t
post-image
BNB-2.93%
#BTCBreaksBelow82K 📉 CPI bearish catalyst fully priced in, BTC breaks below $82,000, leaving longs in a tough spot
Just a few days ago, people were discussing 90K, and now BTC has returned to around 81K.
U.S. September CPI rose 3.7% year-on-year, while core CPI reached 2.6%, both above market expectations. Inflationary pressure has heated up again, BTC has broken below $82,000, and long liquidations have increased.
This wave of decline may test not market judgment, but trading discipline.
Some are looking for opportunities during the pullback, some are reducing positions to manage risk, while
AI
Next Fable Model (5.2+) released by...?
December 31
99%1.01x
October 31
87%1.15x
$54.05K 24H+10 more
BTC-2.96%
#每周来晒 #USSeptemberPPIDataRelease
US September PPI data will be released at 20:30 Beijing time tonight (8:30 a.m. ET). This is one of the final major inflation readings before the next Federal Reserve decision window. Below I directly answer the two official questions of this Weekly Share edition and then provide full supporting analysis with as many percentages and data points as possible.
Question 1: Will September PPI exceed or fall short of expectations? Is inflationary pressure on the production side strong?
My clear answer:
I expect September PPI to exceed the consensus slightly or lan
BTC-3.04%
Diesel Prices Surge, the “Invisible Bomb” of Producer-Side Inflation

Tonight’s PPI data includes one subcategory I’m paying especially close attention to: diesel.

Many people focus only on gasoline, thinking that rising gasoline prices mean energy prices are rising. But diesel is the real driver of producer-side inflation. Diesel is used for truck transportation, agricultural machinery, construction equipment, and factory power generation. When diesel prices rise, costs across all logistics-dependent industries rise with them.

The title of an analysis by Jin10 Data is very direct: “The I
AMD-3.88%
  • 1
2RR #xauusd Newyork session
#ict
post-image
XAUUSD+1.26%
$ETH /USDT
+15R
Market structure
Liquidity & Inducement principles
ETH-5.42%
It has fallen the hardest among the three candidates, but it is precisely the one most worth watching. Bottom line: bullish in the short term, betting on an oversold rebound.
Comparing relative strength: PEPE has fallen just 6.63% in 24h, with an RSI of 44.1, indicating a mild pullback; PUMP is down 15.68%, with an RSI of 26.3 already entering oversold territory, but its MACD still shows bearish bars, while the funding rate of +0.0036% indicates that longs are still paying to hold their positions, leaving insufficient rebound momentum. Meanwhile, $KORUB plunged 25.45% in a single day, with a
post-image
KORUB
KORUBSouth Korea Bull
Four.meme
MC:$3.67KHolders:1
0%
PUMP-13.08%
Bitcoin whales accumulate ahead of US inflation report as $744M exits ETFs
Large holders are rebuilding their positions even as ETF investors retreat, leaving Bitcoin's recovery facing a critical test near $83,000.
Quick Take
⚠️ Personal market analysis only. NFA — manage risk and DYOR.
Educational content, not investment advice or a recommendation to buy, sell, deposit, or withdraw any asset. No paid promotion or referral/affiliate links.
post-image
BTC-1.34%
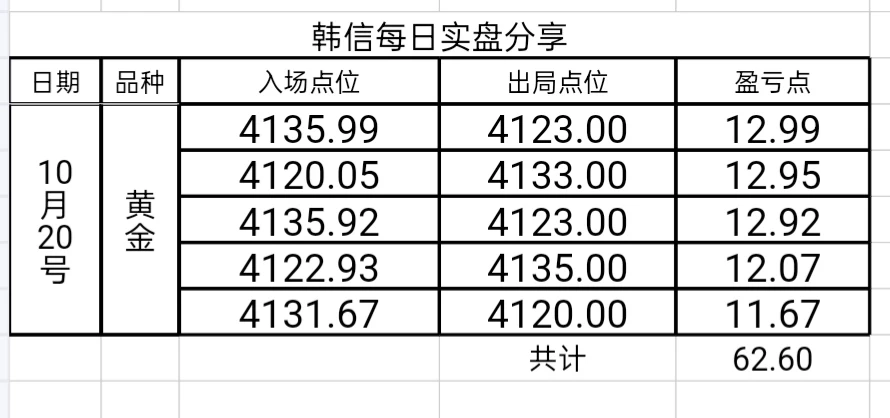
Today's gold target has been reached, so I'm taking a break. I'll make a small trade later if I see a good entry point!
post-image
GLDX+1.12%
PAXG+0.97%
XAU+1.19%
#BTCBreaksBelow82K Breaks Below $82,000. Is This a Temporary Pullback or the Start of a Deeper Correction?
Bitcoin falling below the $82,000 level is a development that deserves close attention from every trader in the crypto market. When BTC loses an important psychological price level, market sentiment can change quickly. Buyers may become more cautious, sellers may gain confidence, and short term volatility can increase as traders reassess their positions.
However, a price break below $82,000 does not automatically mean that Bitcoin is entering a prolonged bearish trend. The real question
BTC-3.04%
BREAKING
PPI YOY actual 6.3% expected 5.3% 🔥
Producer Prices in the United States increased 6.30 percent in September of 2026 over the same month in the previous year.
post-image
Trend: The long-term bullish trend remains intact, but there is a deep medium-term correction and extreme short-term oversold weakness. It has retraced -40% from the 6/22 high of $2,354, plunged -17% in 5 days, and is technically oversold (KDJ J value -1.98, RSI 32.3). A rebound is needed, but the trend has not reversed.
1.Cycle peak risk: The memory industry fears "buying at the top of the cycle" most. Earnings are accelerating quarter over quarter but may be nearing a turning point; if the 10/29 earnings report guidance weakens, the valuation (PE19) will instantly become expensive.
2.Earning
post-image
#USCPISoon
One hour before the CPI data release (12:30 UTC), the market is in a state of complete uncertainty. Here is a brief, to-the-point overview of the current situation on the BTC/USDT 1-hour chart and the action plan.
Detailed chart analysis (1H)
1. Price and range: BTC is trading at 83,360 USDT, down 0.28% over the past 24 hours. The price is trapped in a narrow range between the 24-hour low (82,927) and high (84,103).
2. Bollinger Bands (BOLL 20,2): The bands are narrowing (UB: 83,717, MB: 83,384, LB: 83,050). The price is exactly on the middle band. This is a classic sign of volatil
BTC-2.96%
  • 3
Inflation data continues to come hot
CPI hot yesterday and PPI hotter today
If you thought we don't have more hikes on the table, then you need to go back to your macro framework and study more.
If someone tells you that this is the reason we drop on U.S indexes and Bitcoin / altcoins, run away, they need to learn more about price action.
All major indexes, Bitcoin and ETH were in Distribution mode, this data was just the extra bonus.
post-image
BTC-3.04%
ETH-5.42%
The “Bill” for Tariffs—Trade Policy Costs Exposed by PPI Data
Tariffs are not a free lunch. Someone will ultimately pay the price—the question is only who pays and when.
Behind September’s 6.3% year-on-year PPI growth lies an easily overlooked but extremely important structural factor: the accelerated pass-through of tariff costs.
From “Businesses Absorb the Costs” to “Consumers Bear the Burden”
Since the Trump administration imposed additional tariffs, the debate over “who is paying for tariffs” has never stopped. September’s data is gradually making the answer clearer.
In the early stages of
SPCX-5.70%
Load More

Join 40 M users in our growing community

⚡️ Join 40 M users in the crypto craze discussion

💬 Engage with your favorite top creators

👍 See what interests you

Trending Topics

USSeptemberPPIBeatsExpectations

91.35k Views1.83k Discussing

US September PPI came in at 6.3% YoY, well above the 5.3% market expectation, pointing to renewed producer-side inflation pressure. Weekly jobless claims were 199K, broadly in line with forecasts. Could hotter inflation further reduce room for rate cuts, and what does it mean for $BTC, US stocks, and gold?

DrLinHanSpeaksAtOxfordUnion

135.63k Views1.86k Discussing

JapanAndKoreaStocksPlunge

47.27k Views1.75k Discussing

View More