Square
Following
Hot
News
Notifications
Profile
Share your thoughts
placeholder
Article
I treated the client to a whole roast lamb for a late-night meal tonight.
If I can’t close the deal, I’ll be out a lot of money, huh?
Whatever, I’ll get him drunk first and figure out the rest later.
post-image
🔹 Ethereum(ETH) Surpasses 1,700 USDT with a Narrowed 1.69 Decrease in 24 Hours
live-cover
LIVE2,024
BTC-0.67%
XAUUSD-2.40%
XAU+0.38%
ETH-1.23%
NVDA-0.35%
Trenches
PIEVERSE
P
bade
b
PIEVERSE
0x0e...25a9
Market Cap
$.
Change
.
24h Vol
$.
Holders
.
IDOL
I
bade
b
IDOL
0x3b...ab07
Market Cap
$.
Change
.
24h Vol
$.
Holders
.
JAGENT
J
bade
b
JAGENT
0x8e...ae15
Market Cap
$.
Change
.
24h Vol
$.
Holders
.
Singularity
S
bade
b
Singularity
7R4M...pump
Market Cap
$.
Change
.
24h Vol
$.
Holders
.
mihao
m
bade
b
mihao
4Cxj...pump
Market Cap
$.
Change
.
24h Vol
$.
Holders
.
#SKHynix #WCTCS9 #ShareWeekly
SK HYNIX AT 770 USDT: Is This a Buying Opportunity or a Warning Signal? Full Market, AI Memory, HBM, Fundamental and Trading Strategy Analysis

SK hynix is standing at the centre of the global AI memory story, but strong business performance does not mean its share price can only move upward. At the reference price of 770 USDT supplied for this analysis, the key question is whether the recent weakness represents a temporary correction inside a powerful semiconductor cycle or the beginning of a deeper valuation reset. My approach is to separate the company's opera
#SOL #WCTCS9 #ShareWeekly
Worked for 1m 24s

SOLANA AT 70 USDT: IS THIS A GENERATIONAL BUYING ZONE OR A WARNING THAT THE DOWNTREND IS NOT OVER?

Solana is at an important decision point. At 70 USDT, traders must decide whether the deep correction offers a long-term opportunity or whether another wave of selling is ahead. Solana has a strong ecosystem and institutional interest, but a lower price is not automatically a safe entry. The analysis must combine market structure, network activity, liquidity, ETF flows, Bitcoin direction, and risk management.

CURRENT MARKET SNAPSHOT

The latest marke
Yesterday, BTC's $55,000 level was basically calculated based on the $58,000 level and the liquidation of 20x long positions.
The 20x liquidation level for $58,000 is $55,100; in low-volatility conditions, it should basically also be calculated according to the liquidation level.
$58,000,
the 10x liquidation level is $52,200;
the 20x liquidation level is $55,100;
at the same time, the 2x liquidation level for $58,000 happens to be $87,000;
These are all just coincidences; the key levels in between need to be determined using many references.
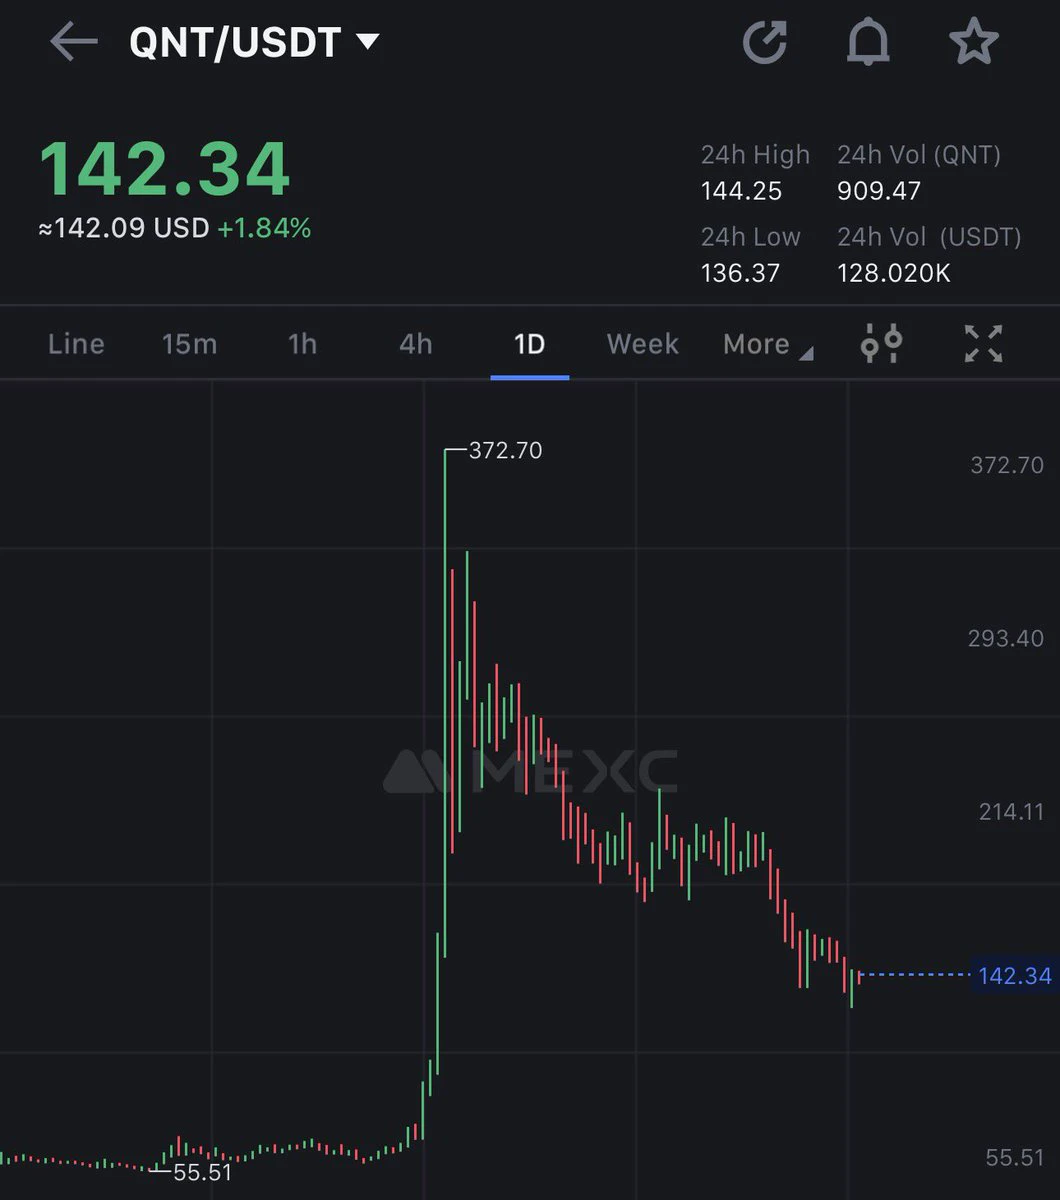
$QNT pump will shock and amaze you.
Super undervalued.
post-image
QNT+4.79%
#BTCReboundFaces60KTest: What the Orderbook and Charts Are Telling Us

BTC bounced from the 55.1K low and is currently sitting around 59.2K. It briefly poked above 60K but couldn't hold it. Now the market is back to deciding what happens next.

Looking at the charts and the orderbook data, here is the current picture.

The path of least resistance isn't clearly upward right now. There are heavy sell walls stacked above the current price. According to CoinGlass, there is about 10,000 BTC in sell orders right at the 60,000 mark. If the price pushes through that, there is a much larger block arou
post-image
BTC-0.67%
$RLUSD The current price is 1.0014, but both the 1-hour and 4-hour timeframes look weak. The 1-hour RSI is 31.58, while the 4-hour RSI is 54.55. This contrast makes it difficult to determine the next move. The current price has already touched the 1-hour support level at 1.0014, but trading volume has not increased noticeably, indicating low participation from both bulls and bears. In this situation, price movements may lack staying power, and price changes alone are not enough to confirm a trend.
I’m short. I’ll wait for a rebound that fails to break above 1.0024 before entering, and I’ll adm
post-image
RLUSD+0.00%
1,711.08 has already been breached, and a wick down to 1,538 was followed by a roughly 10% rebound: I don't take this rebound as confirmation of a bottom

Last time, I said I wouldn't treat the area around 1,711 as confirmation of a new bottom. First, I wanted to see the daily candle hold 1,711.08 and reclaim 1,835.35, then see whether U.S. spot ETH ETFs had a meaningful net inflow on any given day and whether ETHA stopped posting zero or net outflows. If ETH fell back below 1,732.83 and then broke 1,711.08, I would look for a lower level again. As it turned out, the 11/20 daily low was 1,581.
post-image
ETH-1.26%
#GoldNears3500 Spot gold (XAU/USD) is staging a sharp technical rebound toward $3,578 per ounce on November 22, 2026 bouncing cleanly off Friday’s multi-month capitulation low near $3,514 after testing the critical $3,500 psychological floor. For active traders, this high-volatility inflection between $3,500 support and $3,600 resistance highlights why Gold Contracts for Difference (CFDs) on Gate TradFi paired with the Gate Card Points System have become a premier toolkit for capturing two-way precious-metal momentum while turning everyday expenses into digital assets (BTC, ETH, USDT, and GT).
post-image
XAUUSD-2.40%
XAGUSD-3.80%
XPTUSD-4.02%
XTIUSD+0.50%
NAS100-4.60%
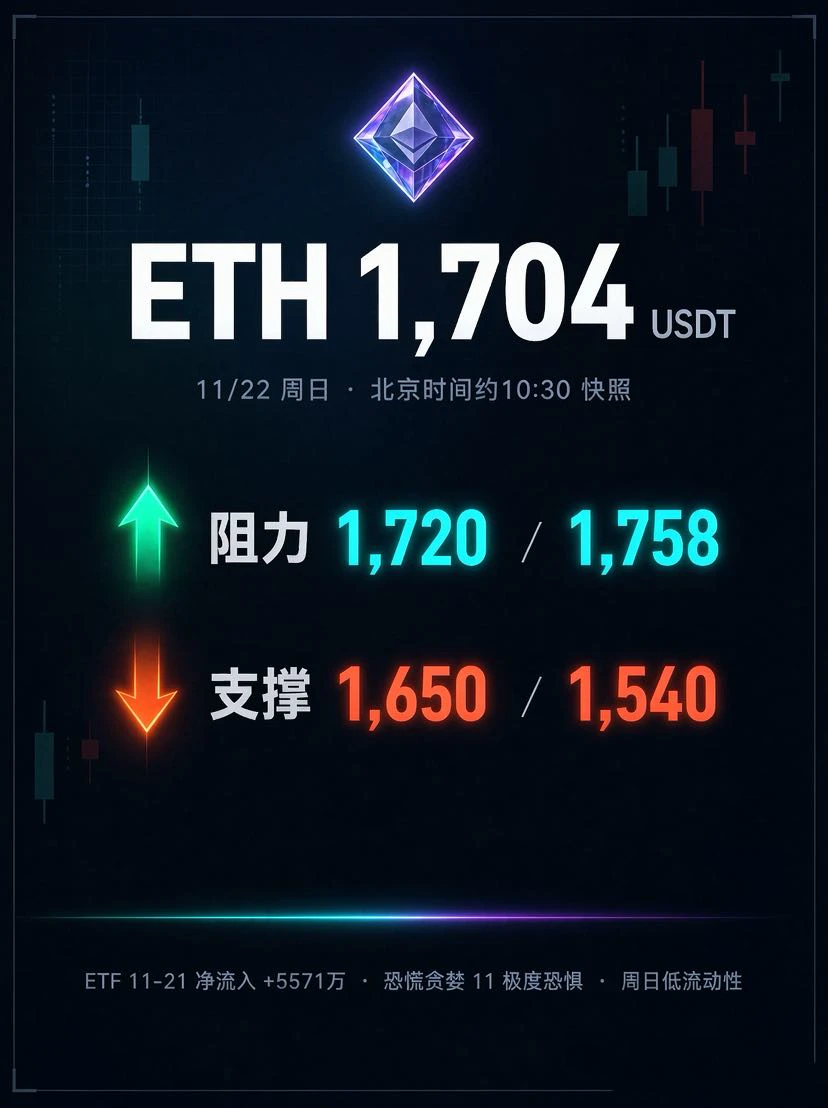
$ETH Current price: 1,704, up +2.5% over 24h. Price has rebounded about 11% from the low of 1,540 and is currently consolidating in a narrow 1,650–1,720 range.
The daily chart remains in a bearish alignment, with MA20 (around 1,710) being repeatedly tested. Failure to hold above it means this is a rebound, not a reversal; RSI has moved out of oversold territory but remains weak, and volume is lower than the previous day, indicating a low-volume recovery.
💰 Conditions on the fund flow front have shifted: on 11-21, Ethereum spot ETFs saw net inflows of about $55.71 million, ending the previous
post-image
ETH-1.23%
  • 10
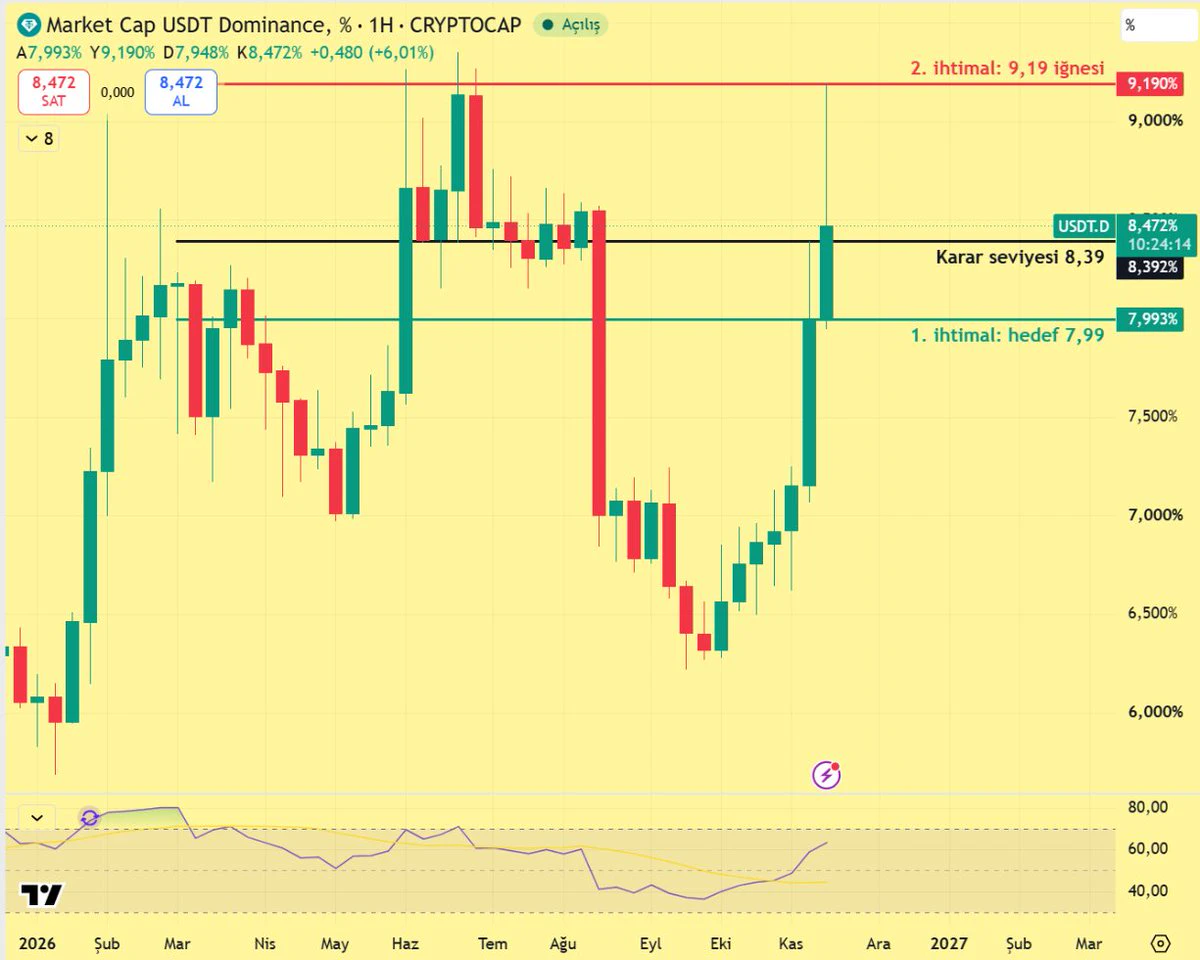
#USDTD
Two possibilities on the weekly timeframe
Friends, let's discuss the two possibilities for USDT dominance as well.
The week opened at 7.99. Dominance rose to 9.19 on Saturday and is currently at 8.47. It is still above last week's peak of 8.39.
First possibility: 9.19 remains the peak. If the weekly close comes in below 8.39, the 7.99 level I marked on the chart will be the target. This is a positive scenario for crypto. For the Libra reading, the threshold is a weekly close below 8.31.
Second possibility: dominance holds above 8.39. In that case, pressure on crypto will continue, and t
post-image
𝗚𝗔𝗧𝗘 𝗔𝗡𝗗 𝗢𝗣𝗘𝗡𝗣𝗔𝗬𝗗: 𝗙𝗥𝗢𝗠 𝗕𝗔𝗦𝗜𝗖 𝗙𝗨𝗡𝗗 𝗧𝗥𝗔𝗡𝗦𝗙𝗘𝗥𝗦 𝗧𝗢 𝗦𝗧𝗥𝗢𝗡𝗚𝗘𝗥 𝗖𝗥𝗢𝗦𝗦-𝗕𝗢𝗥𝗗𝗘𝗥 𝗣𝗔𝗬𝗠𝗘𝗡𝗧 𝗜𝗡𝗙𝗥𝗔𝗦𝗧𝗥𝗨𝗖𝗧𝗨𝗥𝗘

Before, moving money across borders could involve separate payment systems, different financial providers, and complicated transfer processes. Now, Gate is strengthening its partnership with OpenPayd to improve cross-border fund transfers and payment infrastructure.

𝗕𝘂𝘁 𝘄𝗵𝗮𝘁 𝗱𝗼𝗲𝘀 𝘁𝗵𝗶𝘀 𝗮𝗰𝘁𝘂𝗮𝗹𝗹𝘆 𝗺𝗲𝗮𝗻, 𝗮𝗻𝗱 𝘄𝗵𝘆 𝘀𝗵𝗼𝘂𝗹𝗱 𝘂𝘀𝗲𝗿𝘀 𝗽𝗮𝘆 𝗮𝘁𝘁𝗲𝗻𝘁𝗶𝗼𝗻?

🔍 𝗠𝗬𝗧𝗛: 𝗜𝘀 𝗧𝗵𝗶𝘀 𝗝𝘂�
post-image
$ZEC First, let me explain where I flipped. In the previous version, I was short, with my stop-loss set at 965, because I thought the drop from 1,683 to 860 wasn’t over yet.

Later, 860 held, and 880 never came either. Instead, all three retests found support above 892. The bottom didn’t turn into a bearish continuation; it formed a double bottom. A structural read was wrong, plain and simple. I closed the short and flipped long when it reclaimed the 100-day moving average at 696.

The only valid reason to reverse a trade is that the structure has changed, not that you’re unhappy about losing.
ZEC+1.29%
BTC-0.65%
ETH-1.23%
$ZEC After surging to $1,700, it has pulled back all the way, but don't overlook one detail in the market: the bulls haven't capitulated, and the key zone where major players are absorbing selling pressure is still being staunchly defended.

Let's mark out a few levels first: - $730–$800: core defense zone; a drop to this level would mark the true dividing line between bulls and bears- $1,050: the first overhead wall of selling pressure- $1,200: extension target after a breakout- $1,700: the top marker for this rally
As long as $ZEC can hold its current support and buyers continue to come in,
post-image
ZEC+1.16%
$EVAA BOOM🤑🤑 The new trade call played out beautifully, exactly as planned. TP1 hit—go check, the money’s in, guys 🙈💸 Lexus LX570... loading 🚘🚘$BLESS $ELSA
post-image
EVAA-0.49%
BLESS-2.00%
ELSA+5.80%
#Gate直通IPO第三期ANT配售92100股
Gate Direct IPO Round 3 has officially delivered its allocation results for Anthropic, PBC (NASDAQ: ANT) and the numbers underscore both extraordinary retail appetite for frontier AI equity and the discipline required once primary allocations transition into live secondary trading. Finalized on November 19, 2026, the round attracted 152 million USDT in total intended subscriptions against a fixed quota of 92,100 ANT shares at an official offering price of 83 USDT per share, distributing 7,644,300 USDT in equity value at an overall pro-rata allocation rate of approxima
post-image
ANT-8.68%
NDAQ-0.95%
SPCX-7.38%
NVDA-13.84%
Everyone, buy $DEXE now! It will hit $49 again. Please don't miss this opportunity. 🔥🤔
post-image
DEXE-4.14%
  • 1
  • 2
🔹 Ethereum(ETH) Surpasses 1,700 USDT with a Narrowed 1.69 Decrease in 24 Hours
live-cover
LIVE1,629
XAUUSD-2.40%
NVDA-0.35%
ETH-1.23%
BTC-0.65%
XAU+0.38%
Load More

Join 40 M users in our growing community

⚡️ Join 40 M users in the crypto craze discussion

💬 Engage with your favorite top creators

👍 See what interests you

Trending Topics

BTCReboundFaces60KTest

2.1M Views30.1K Discussing

BTC rebounded from around $55,300 on November 21, briefly reclaiming $60,000 before pulling back to around $59,300. The $60K level is back in focus as traders assess whether the recovery can last. Is this rebound a sign of stabilization or a short-lived recovery? Would reclaiming and holding $60K be enough, or do you need confirmation from trading volume and fund flows?

PCEAndGDPDataNextWeek

259.8K Views2.6K Discussing

GateDirectIPOPhase3ANTAllocates92100Shares

842.8K Views5.1K Discussing

View More