






Square
Following
Hot
News
Notifications
Profile
Share your thoughts
placeholder
Article
Trading is still too difficult
There’s a huge gap between seeing it right and getting it right
post-image
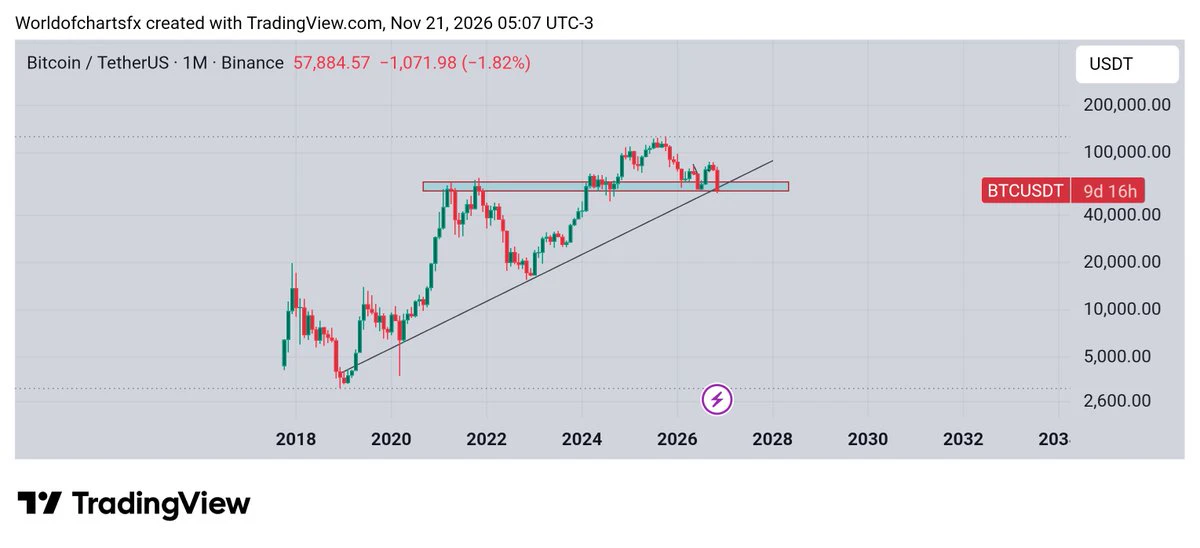
$BTC #Btc is currently testing a crucial support zone on the monthly timeframe, which also aligns with its long-term ascending trendline. This is an important area to watch closely. If BTC manages to hold this support and trendline, we could potentially see a strong recovery from these levels. However, a confirmed breakdown could open the door to further downside, potentially creating even better opportunities to accumulate Bitcoin at lower prices. For now, patience is key — let's wait and see how the monthly structure develops.
post-image
BTC-0.67%
  • 1
Trenches
FIONA
F
bade
b
FIONA
B34n...pump
Market Cap
$
Change
.
24h Vol
$.
Holders
.
PIEVERSE
P
bade
b
PIEVERSE
0x0e...25a9
Market Cap
$.
Change
.
24h Vol
$.
Holders
.
mihao
m
bade
b
mihao
4Cxj...pump
Market Cap
$
Change
.
24h Vol
$.
Holders
.
CLAUDIA
C
bade
b
CLAUDIA
2j5S...W2ZM
Market Cap
$.
Change
.
24h Vol
$.
Holders
.
IDOL
I
bade
b
IDOL
0x3b...ab07
Market Cap
$.
Change
.
24h Vol
$.
Holders
.
WHALE ADD 10.2 MILLIONIN LONG SLIVER POSITION
live-cover
LIVE3,295
BTC-0.67%
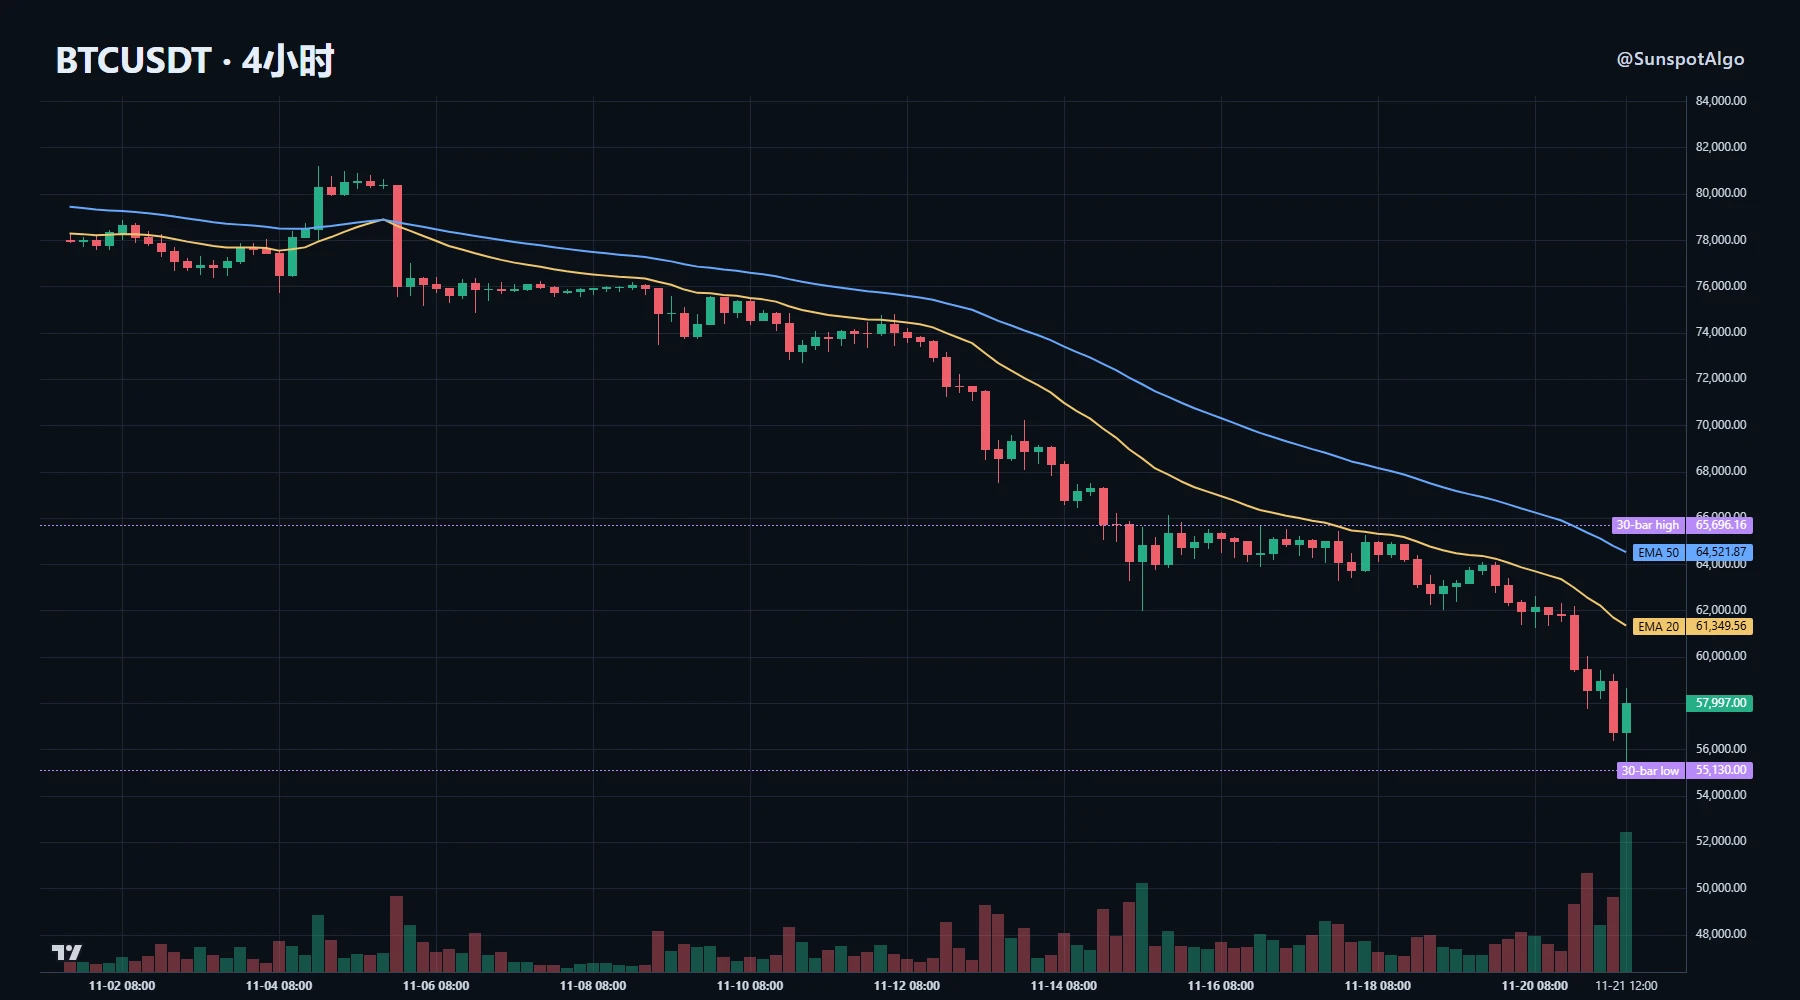
The pace of this Bitcoin decline is more interesting than the percentage change. It’s down about 6% in 24 hours, while open interest has contracted nearly 3%, and the funding rate remains at +0.003%. Prices are moving down quickly, while leverage is exiting slowly: longs are being gradually squeezed out, but shorts haven’t taken the opportunity to add significantly to their positions.

The pace is clear on the 4H chart. The price closed near 58,000, with the 20-, 50-, and 200-period moving averages successively capping it at 61,300, 64,500, and 72,800. The break below the previous low of 62,00
post-image
BTC-0.65%
Market Snapshot
$BTC : $57,790
$ETH : $1,630
$SOL : $67
Crypto MC: $2.077T
🔴 The US stock market has reportedly wiped out $7T in market cap this week
🔴 $NVDA plunged 12%, heading for its seventh consecutive weekly decline, the longest losing streak since the 2008 financial crisis, wiping out $2.5T in market value
🔴 Most of 2026's major IPOs are trading below their listing-day prices, led by Cerebras (-74%) and Quantinuum (-52%), while Jio Platforms is up 6%, per Token Terminal
🔴 Peter Schiff warns an impending financial crisis could surpass 2008, predicting widespread loan defaults, higher in
BTC-0.67%
ETH-1.26%
SOL-0.77%
NVDA-13.84%
HYPE+0.24%
Did you know that cryptocurrency can be accessed through physical ATM-style machines?
Crypto ATMs allow users to buy certain digital assets using cash or other supported payment methods.
Some machines also support selling cryptocurrency and receiving cash.
However, fees, supported coins, identity checks, and availability vary between operators and locations.
Always verify the machine's legitimacy and understand its charges before using it.
#CryptoATM #Bitcoin #CryptoEducation #Blockchain
post-image
BTC-0.67%
afternoon updates
live-cover
LIVE58
SOL-0.77%
BTC-0.67%
ETH-1.26%
USDC+0.01%
XRP-1.15%
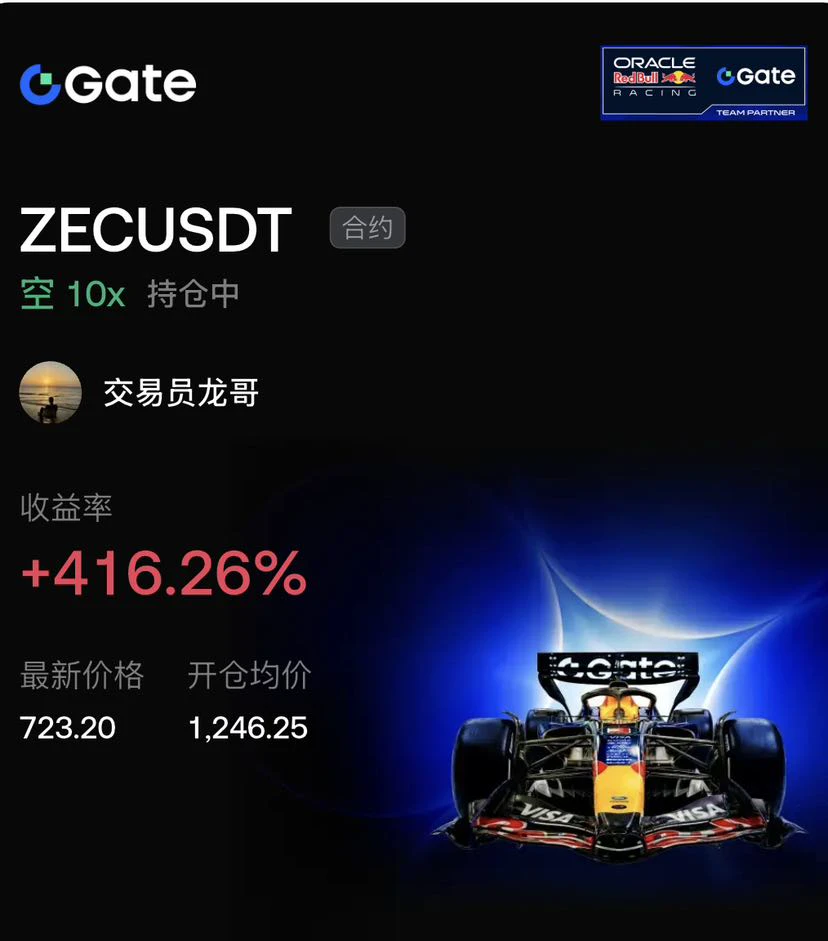
When everyone was calling to buy the dip$ZEC , I increased leverage on my short position to 10x.

Opened a short at 1246.25; the price fell to 723.20, for an unrealized gain of 416.26%. The 1-hour moving averages are in a bearish alignment; going against consensus is the source of excess returns. The logic is simple: high-level sideways trading with stalled gains, declining volume, and exhausted bulls. Enter after a descending channel forms. The price fell on heavy volume, completing the main downtrend wave. With 10x leverage, any rebound is a trap.

Profits are substantial, but a doji at the
post-image
ZEC+1.29%
BTC-0.65%
SOL-0.74%
#BTC跌破6万美元关口
$BTC ‌
Market Update

Bitcoin has experienced a deeper decline than previously anticipated. The price broke below the 60,000 psychological level and reached a local low of 55,105. This movement confirms the heavy bearish pressure observed in the previous daily and 4-hour structures.

Technical Analysis Based on the New Charts:

Daily and 4-Hour Timeframes: The broader trend remains clearly negative. The price is trading well below all major moving averages. The SuperTrend indicator on both the daily and 4-hour charts continues to show a red bearish signal. The MACD on these high
BTC-0.65%
President Bola Ahmed Tinubu yesterday at the Central Mosque, where he served as the Wali at a wedding, looking sharp and energetic.
Our President today, our President tomorrow! Insha Allah.
#ArewaForAsiwaju
post-image
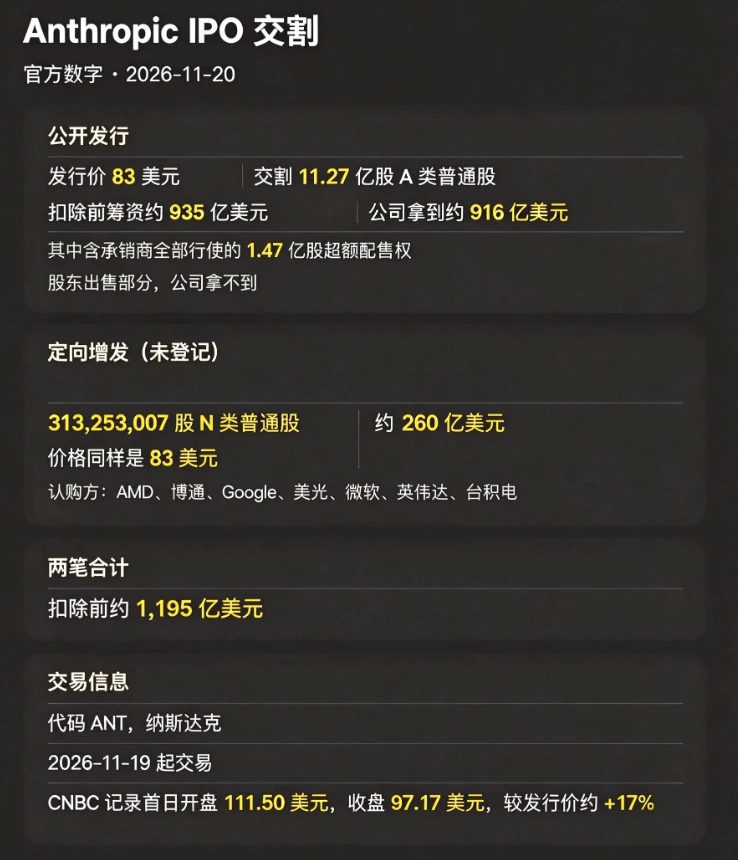
Anthropic’s IPO: the official closing figures are out.
The company announced on November 20 that its public offering closed at $83 per share, including the underwriters’ full exercise of the 147 million-share over-allotment option, for a total of 1.13B shares of Class A common stock. Gross proceeds were approximately $93.5 billion, of which the company itself received approximately $91.6 billion. The company receives none of the proceeds from shares sold by shareholders.
The same day, an unregistered private placement also closed: AMD, Broadcom, Google, Micron, Microsoft, Nvidia, and TSMC boug
post-image
ANT-8.68%
AMD-13.27%
AVGO-12.23%
GOOGL-2.50%
MSFT-2.61%
Guys, please help vote👏👏👏. Join Gate’s 2026 Annual Honors Gala and register to claim 100 support points, then vote for your favorite Star of the Year. Click the link and scroll down, select the Square section, search for [Coin Turnaround], find Coin Turnaround Talks MEME, and vote. Each vote gives you a chance to win a prize https://www.gate.com/zh/competition/Annual-Gala?ref_type=165&ch=9940&ref=VVHEV1XFAA
post-image
MEME-0.94%
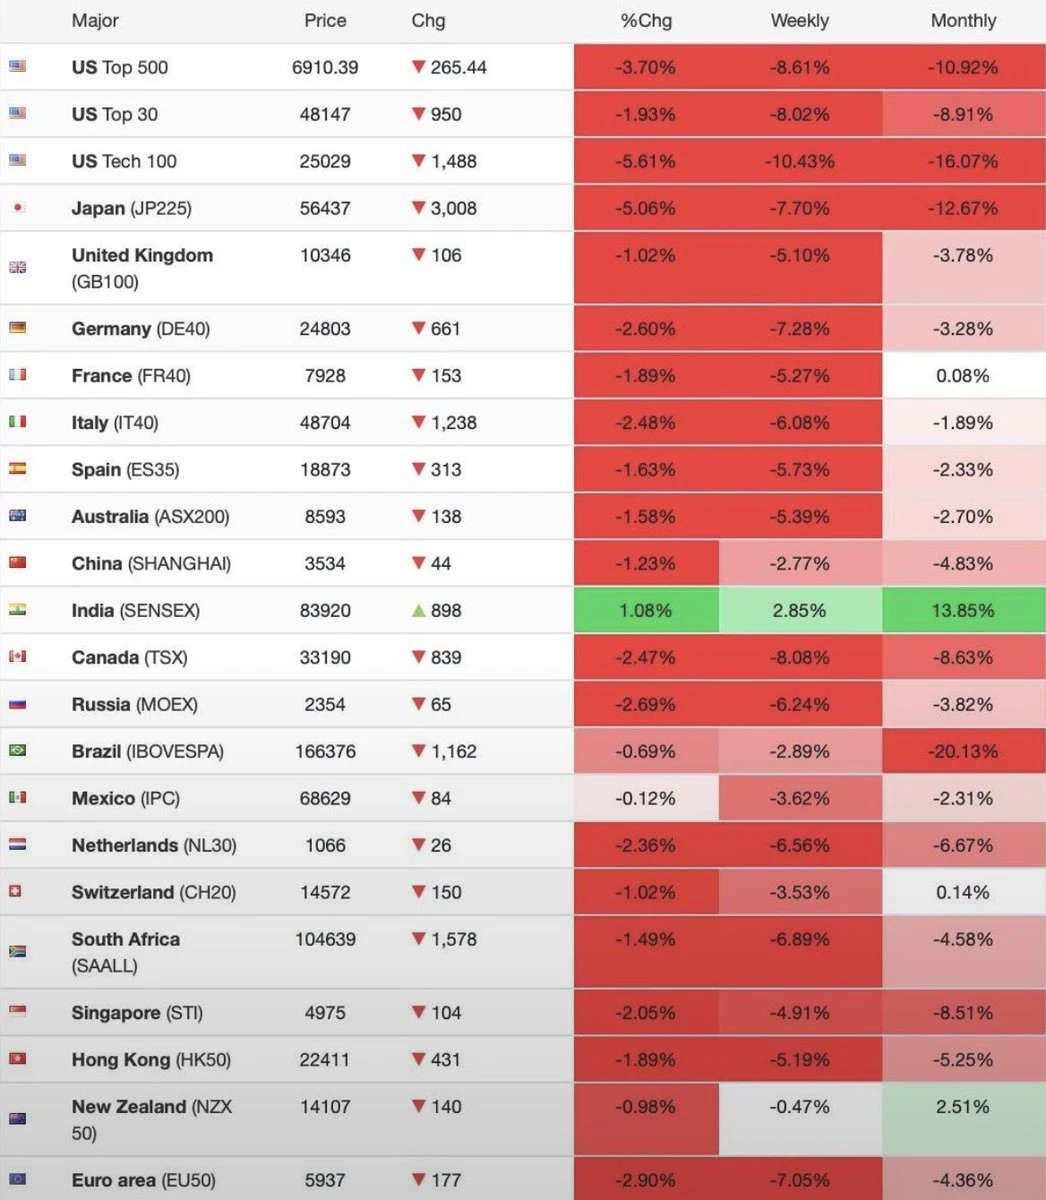
🇮🇳 INDIA STANDS GREEN WHILE GLOBAL MARKETS TURN RED!
post-image
#BTCETFOutflowsExtendTo3Days

Recent market data shows Bitcoin dropping to a local low of 55,000 dollars. I have reviewed a recent assessment from a prominent market analyst regarding the current situation, and I fully agree with this perspective.

The analyst highlights that leverage is the primary factor driving the recent wave of liquidations. Over a single 24 hour period, total liquidations across the network reached 1.893 billion dollars, with 91 percent of these being long positions. Most of these liquidated positions belonged to traders attempting to catch the recent dips. Liquidity co
post-image
BTC-0.67%
#USNOVJoblessClaimsBeatExpectations When weekly U.S. unemployment filings come in above consensus, traders instinctively look for a dovish pivot from the Federal Reserve. Yet the market reaction through November 21, 2026 proves why macro context matters far more than a single headline beat or miss. On November 19, the U.S. Department of Labor reported that seasonally adjusted initial jobless claims for the week ending November 14 rose by 1,000 to 203,000 exceeding Wall Street’s 197,000–198,000 forecast by 5,000 to 6,000 filings and marking the highest weekly reading since early September.
Rath
BTC-0.67%
IBIT-5.97%
US500-3.01%
US30-1.48%
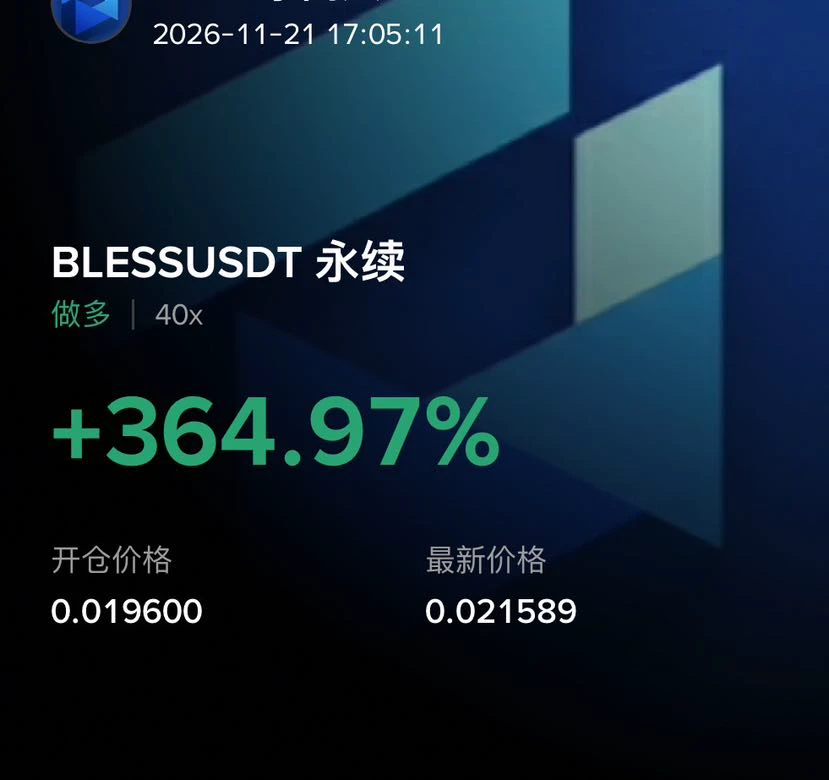
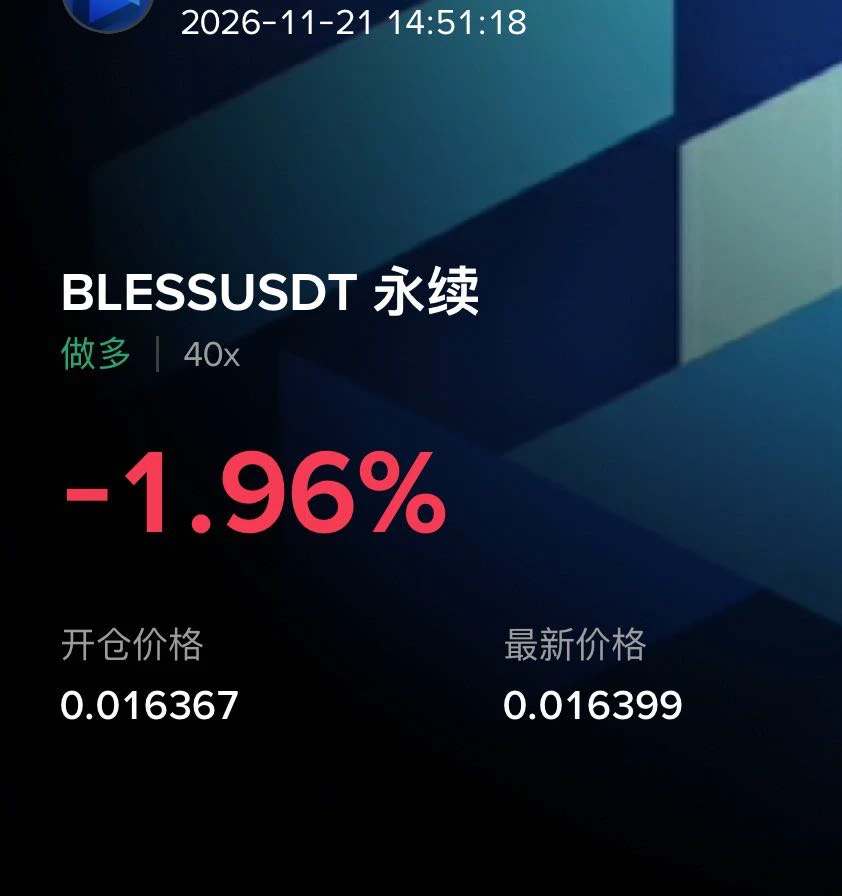
Altcoins have hit take-profit; adding another new long position

What target are you guys calling?
$BLESS ‌
#BTC跌破6万美元关口
post-image
MidasLeader
Altcoin trade: $BLESS going long 🟢—I’m opening a position and dropping the trade call!
Targeting around 0.189, with roughly 6x upside potential.
The entry logic is simple: the broader market is rebounding slightly, so I’m looking to catch an oversold bounce.
I’m not betting on a trend reversal, just playing this leg of the rebound.
Any elaborate hindsight analysis is just overthinking it!
Feel free to hit my stop-loss. #BTC跌破6万美元关口
repost-content-media
BLESS-2.03%
  • 2
  • 2
#BTCFallsToLowestSinceSeptember
Bitcoin Sweeps $57,700 Liquidity: Is the Market Preparing for Another Leg Down?

Bitcoin has finally reached the liquidity zone that traders had been watching closely. The $57,700 support area, which previously represented an important line for buyers, has now been tested aggressively. BTC dropped toward $57,700 before recovering toward $58,800, showing that liquidity below the previous low has become a major battleground.

But this move deserves a deeper explanation.

Why did Bitcoin target $57,700?

The area below $57,700 contained liquidity from leveraged lo
post-image
BTC-0.67%
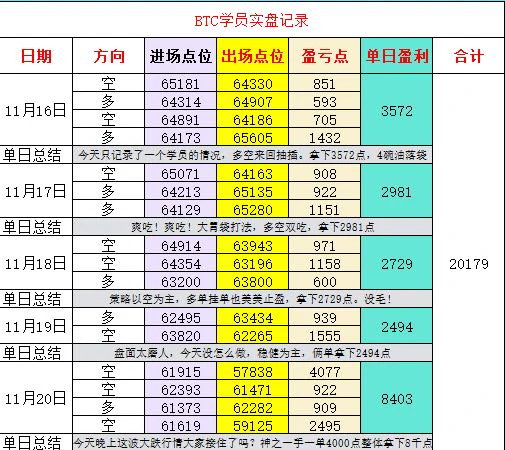
Taking stock of BTC's performance this week: the market gains were maxed out, capturing a 20,000-point move in a single week! $BTC
If you've been taking losses recently, don't lose heart.
Every deep dip or liquidation is an opportunity to refine your understanding of trading. The market will always reward those willing to adapt and leverage others' strengths. #BTC跌破6万美元关口
Real strength isn't about bragging; it's forged one 🥚🥚 at a time and built through one live battle after another. Follow the right person, and your account will keep soaring.
post-image
BTC-0.65%
#BTCBreaksBelow60K #BTCETFOutflowsExtendTo3Days
BTC Falls Below $60,000—Will It Rebound This Weekend?
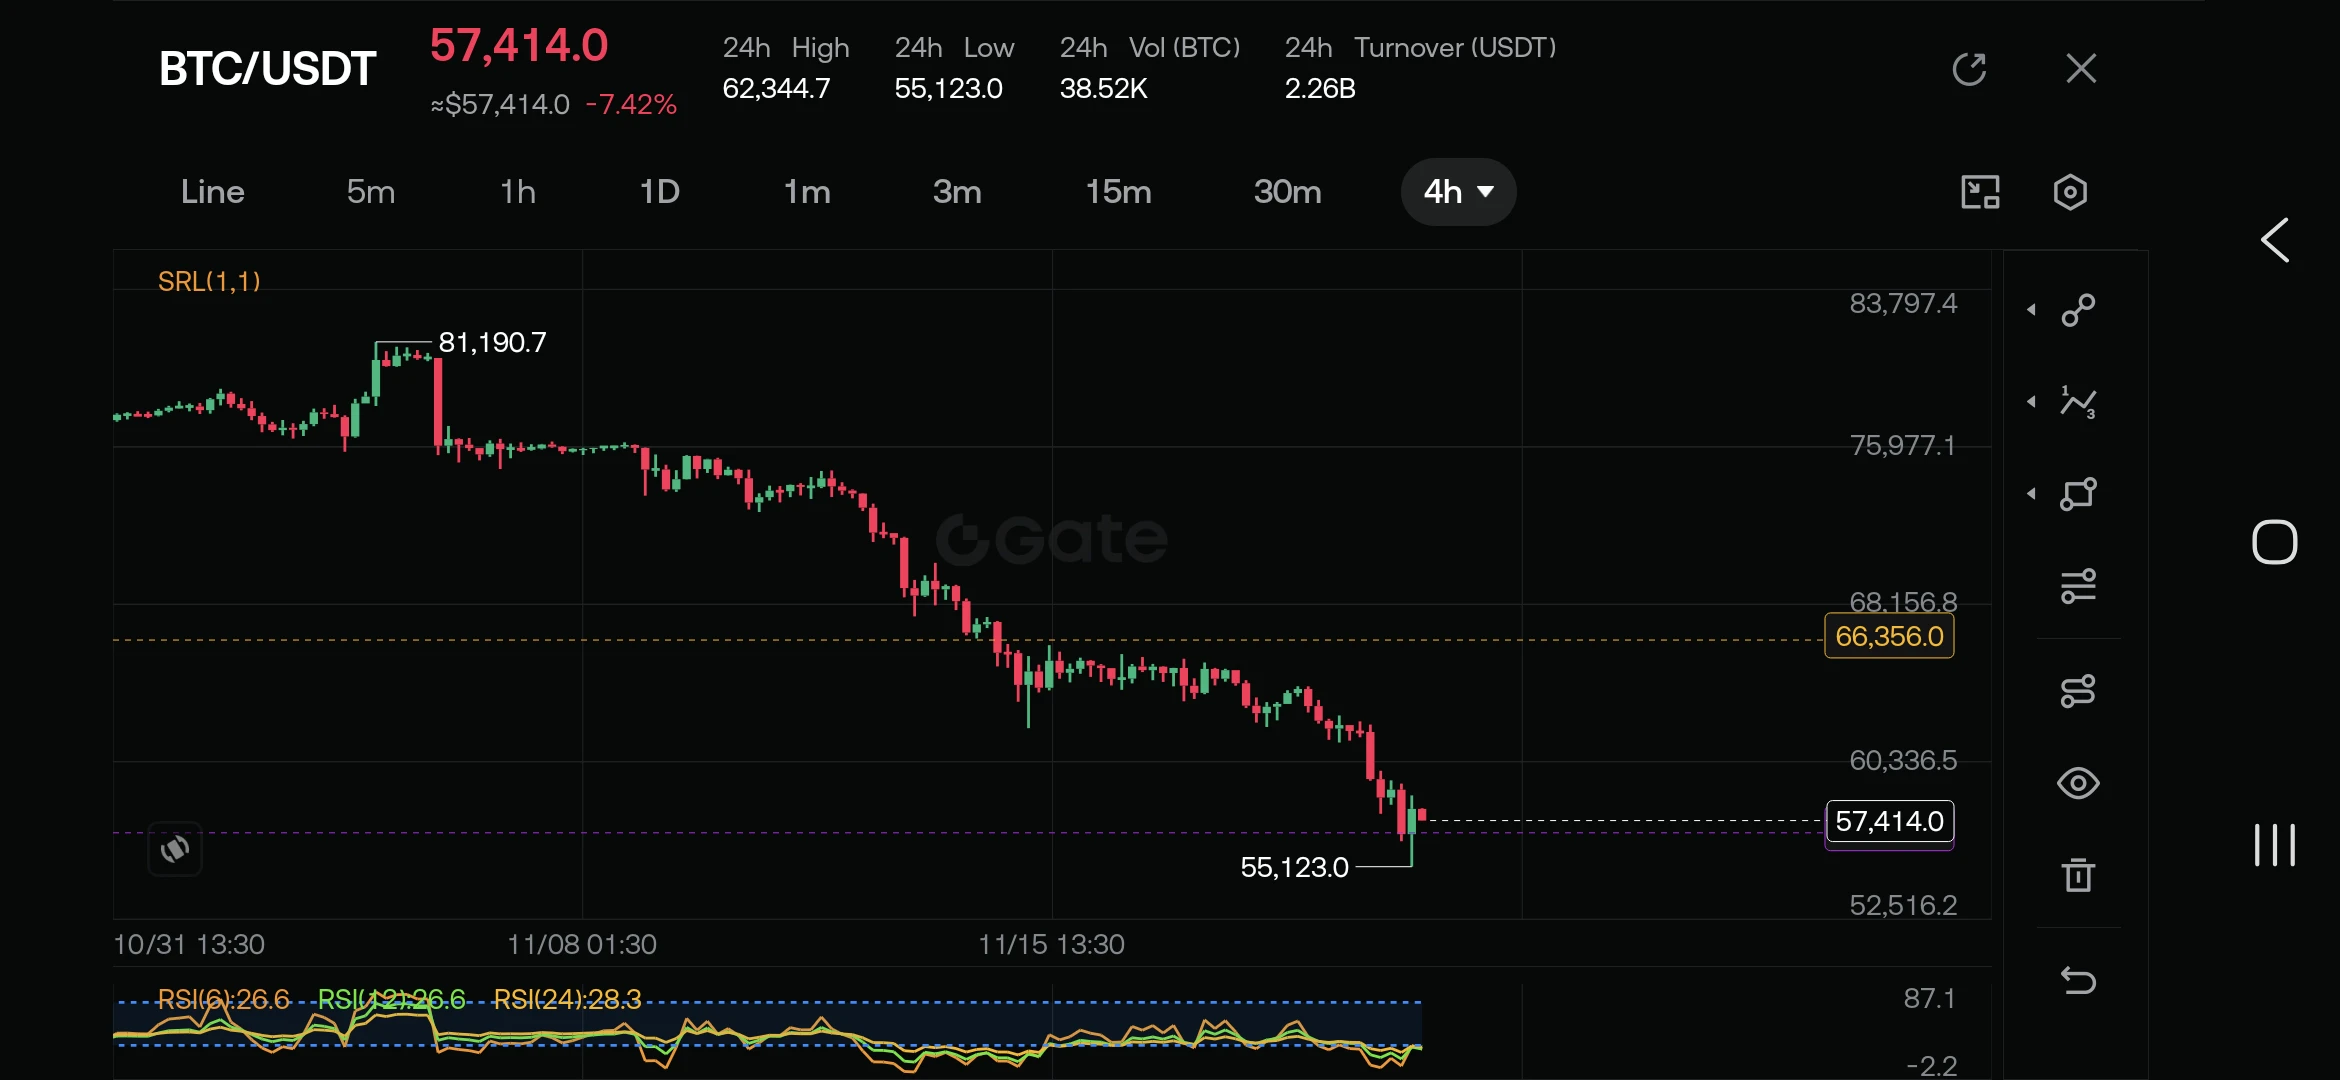
​Bitcoin ($BTC ) has officially breached the psychological $60,000 support floor, trading at $57,414.0 on the 4-hour timeframe after plunging 7.42% over the past 24 hours and hitting an intraday low of $55,123.0. This marks Bitcoin’s weakest price level since September 2024, extending a steep drawdown from its late-October peak of $81,190.7.
​What Is Driving the Sell-Off?
The breakdown below $60,000 stems from a convergence of macro and crypto-specific pressures:
​Heavy Liquidations & ETF Outf
post-image
BTC-0.67%
NVDA-13.84%
  • 1
Load More

Join 40 M users in our growing community

⚡️ Join 40 M users in the crypto craze discussion

💬 Engage with your favorite top creators

👍 See what interests you

Trending Topics

BTCBreaksBelow60K

2.1M Views29.3K Discussing

BTC fell below $60,000 on November 20 for the first time since July, alongside a tech stock selloff and broader pressure on risk assets. Will $60K become resistance, or can BTC quickly reclaim it? What price or volume signals would convince you that selling pressure is easing?

GateDirectIPOPhase3ANTAllocates92100Shares

746.9K Views4.8K Discussing

NvidiaDropsNearly14Percent

313.5K Views7.5K Discussing

View More