Square
Following
Hot
News
Profile
Share your thoughts
placeholder
Article
I came across a question today, because I've been talking with AI all along. It really touched my soul.
Among all the questions we've discussed repeatedly, is there a deeper question that I've been circling around but have never truly asked out loud? I only need the question, not the analysis.
AI's response
If I haven't won, haven't been firmly chosen, and haven't proven myself, am I still worthy of being loved and respected, and of living my life in peace?
post-image
before you ask me
were you invit...
In 2006, I went online for the first time and casually bought 1,000 Bitcoin.
Back then, Bitcoin was worthless, so I just treated it like in-game currency.
post-image
BTC+0.82%
While XRP has seen significant developments on the institutional front, its price has followed a more cautious trend. Despite approximately $1.8 billion in net inflows into XRP exchange-traded products (ETPs) over the past 13 weeks, the token’s price currently sits at $1.39—a decline of over 8% in the last week alone. This divergence raises a fundamental question that is now at the forefront of investors' minds.
The developments on the institutional side are noteworthy. Evernode—a company holding 473 million XRP and $300 million in cash—has begun trading on the Nasdaq under the ticker symbol X
post-image
XRP+1.28%
#AnthropicTurnsProfitablebutGrowthSlows
ANTHROPIC TURNS PROFITABLE, BUT GROWTH SLOWS: IS THE AI BOOM ENTERING A NEW PHASE?
My Original Market View | October 15, 2026
Anthropic's latest financial update highlights two important trends: AI is becoming a profitable business, but its extraordinary growth pace may be moderating. The company behind Claude AI has reportedly achieved adjusted profitability for a second consecutive quarter while continuing to expand its revenue.
My view is that this is neither automatically bullish nor bearish. The real question is whether Anthropic can sustain revenu
$TRUTH This -26% massive bearish candle pierced straight through the 0.0228 stop-loss order I placed 24 hours ago; slippage meant I only got out at 0.0215, giving back 1600U in profits and ending up down another 300. Reviewing it, 0.0231 was a false breakout of the previous high. I saw the bearish MACD divergence but got greedy, thinking it could reach 0.025. The price is now at 0.0170, near the 24-hour low of 0.0162. Trading volume surged to 86.5M during the drop, showing that the panic selling hasn't been fully flushed out yet. My rule: don't catch a falling knife. I'll only consider lightly
TRUTH-28.23%
Reverse money printer formations coming in... 🔥
post-image
🚨 This could be bad news for $BTC
! I believe Warsh's push to scale back forward guidance and the dot plot could create a new source of pressure for the cryptocurrency market. Without clear signals from the Federal Reserve, it will be harder for investors to predict future interest rates, making riskier assets less attractive during uncertain periods. WarshPushesToScaleBackForwardGuidanceAndDotPlotMy biggest concern is that interest rates could remain elevated for longer than the market expects. This would constrain liquidity and make it harder for Bitcoin, especially altcoins, to sustain a s
post-image
BTC+0.82%
Airdrop Task 001 (2026.10.17)
post-image
CARDANO $ADA REJECTING MOVING AVERAGE RESISTANCE ARE BEARS TARGETING $0.213 NEXT?
Pair: $ADA /USDT
Direction: SHORT
Entry Price: 0.2306
Target Levels (Take Profit)
TP 1: 0.224 2.86%
TP 2: 0.2196 4.77%
TP 3: 0.213 7.63%
Stop Loss
SL: 0.2394
Technical Breakdown
ADA ($0.2306) faced strong rejection following an aggressive upward push, printing a topping wick that stalled out right at structural resistance. This price action confirms persistent seller defense and sets up a clean continuation toward lower targets.
Price action tested areas above short-term moving averages before facin
ADA+1.23%
#ASMLTSMCQ3EarningsSoon
Both semiconductor giants represent critical bottlenecks in the modern AI and advanced chip supply chains; however, TSMC holds a fundamentally stronger position and offers a more distinct catalyst for near-term earnings.
Following ASML's earnings release and ahead of TSMC's upcoming earnings call, here is a comparison of the two companies' profiles:
1.ASML
ASML announced its third-quarter earnings on October 14, setting a new benchmark for lithography equipment demand.
Q3 Results and Highlights
* Earnings Beat: Earnings per share came in at $14.65 (market expectation
post-image
TSM-1.88%
ASML+0.48%
AMD-1.43%
NVDA-1.77%
AAPL-0.07%
Layout: Bitcoin, Ethereum, Dogecoin
live-cover
LIVE880
  • 4
I turned off the $ZEC gainers-and-losers rankings first, and only one issue is left on the chart: $ZEC remains strong, while the crowded positioning is already out in the open.
$ZEC is currently at 1,241.91, up 8.09% over 24 hours. The 1-hour support is 1,075, resistance is 1,248.4, and current volume is 0.55 times the average volume of nearly 20 candles.
My view for now is this: I acknowledge that the trend is strong, but what matters next is not how much higher it can go, but whether anyone steps in during the first pullback. Moving higher does not count as a win just because it touches 1,2
post-image
ZEC+7.47%
✨ US Data Update: What Today's Numbers Signal for Markets
🔹 A dense set of US economic data released today painted a picture of an economy that remains resilient, but with inflation pressures proving more persistent than expected. The combination of hot inflation, strong consumer spending, and a tight labor market is reshaping rate expectations.
📊 The data on the table:
🔹 PPI (Producer Price Index): September PPI rose 1.3% MoM and 6.3% YoY, far exceeding the 0.5% and 5.3% forecasts. This is the largest monthly increase since March 2022. Core PPI, excluding food and energy, rose 0.7% MoM and
post-image
User_any
#美国9月PPI大超预期 ✨ US PPI Inflation Surges to 6.3%, the Highest Since Late 2022
🔹 The US September Producer Price Index (PPI) rose 1.3% month-over-month and 6.3% year-over-year, significantly exceeding the consensus estimate of 5.3%. This marks the largest monthly increase since March 2022 and the highest annual reading since December 2022.
📊 The data behind the print:
🔹 Core PPI: Excluding food and energy, core PPI rose 0.7% MoM and 5.0% YoY, both above expectations.
▪️ Energy: Energy prices surged 10.8%, accounting for more than 80% of the broad-based increase in goods prices. Gasoline jumped 20.3%.
▪️ Context: The reading follows Wednesday's CPI report, which also came in above forecasts at 3.7% YoY headline and 2.6% core. Retail sales for September rose 0.8% MoM, beating the 0.3% estimate.
⚖️ Market impact:
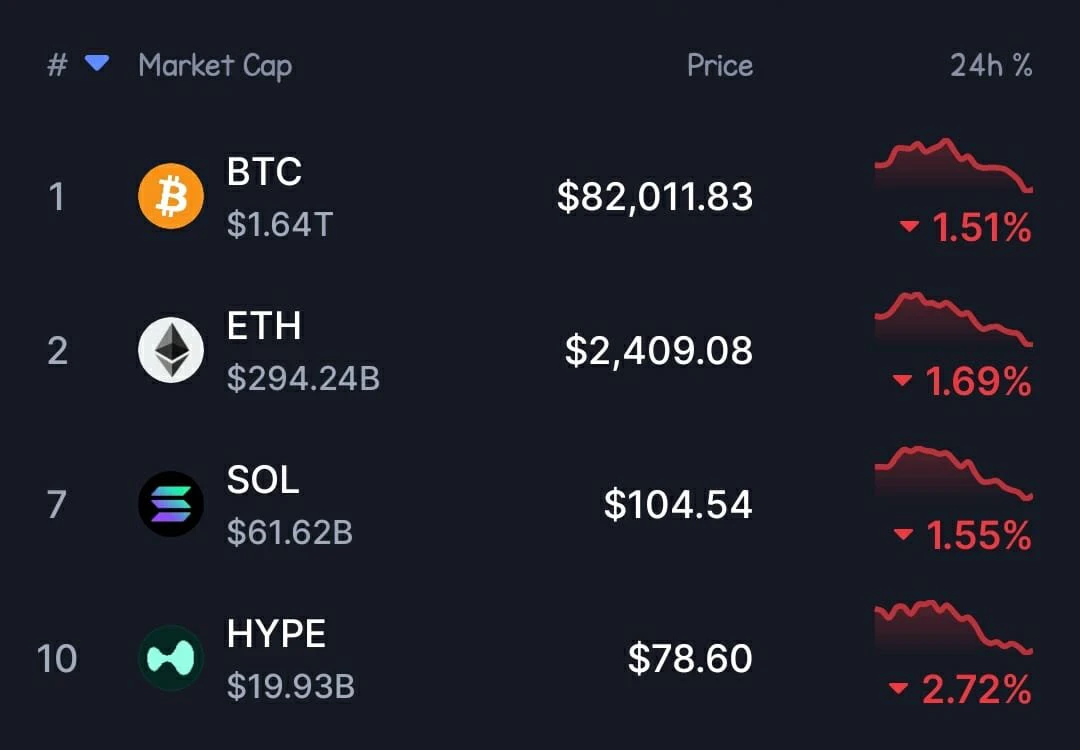
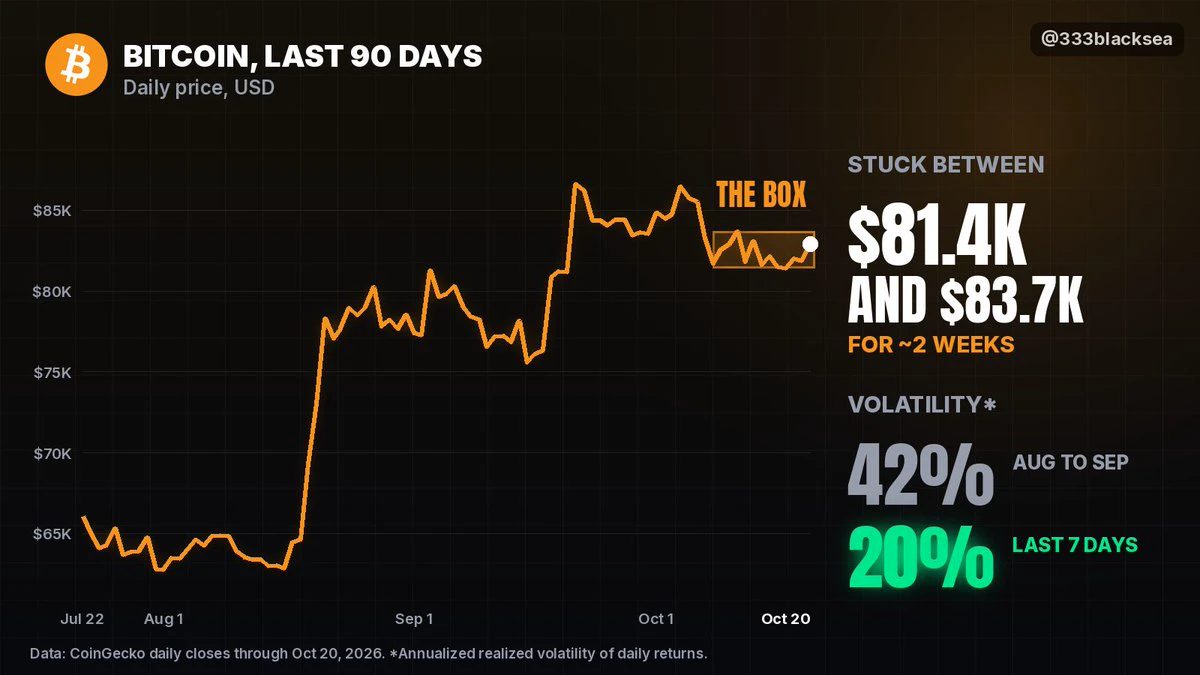
🔹 Bitcoin: Briefly fell below $80,000 to $79,800 before rebounding to near $82,000. Market-wide liquidations reached approximately $930 million over 24 hours, with long positions accounting for $780 million. The $80,000–$81,500 zone remains a critical support area, overlapping with the estimated ETF cost basis.
▪️ US Equities:The S&P 500 and Nasdaq 100 traded mixed, with tech and semiconductor names under pressure. The Philadelphia Semiconductor Index fell over 4% in the prior session. Cyclical sectors and the Dow Jones outperformed as investors rotated toward defensive positioning.
▪️ Treasuries & Dollar: The 10-year Treasury yield dipped to approximately 5.04% from 5.10%, as safe-haven demand for bonds offset the inflation surprise. The dollar index retreated from its 18-month high toward 102.0.
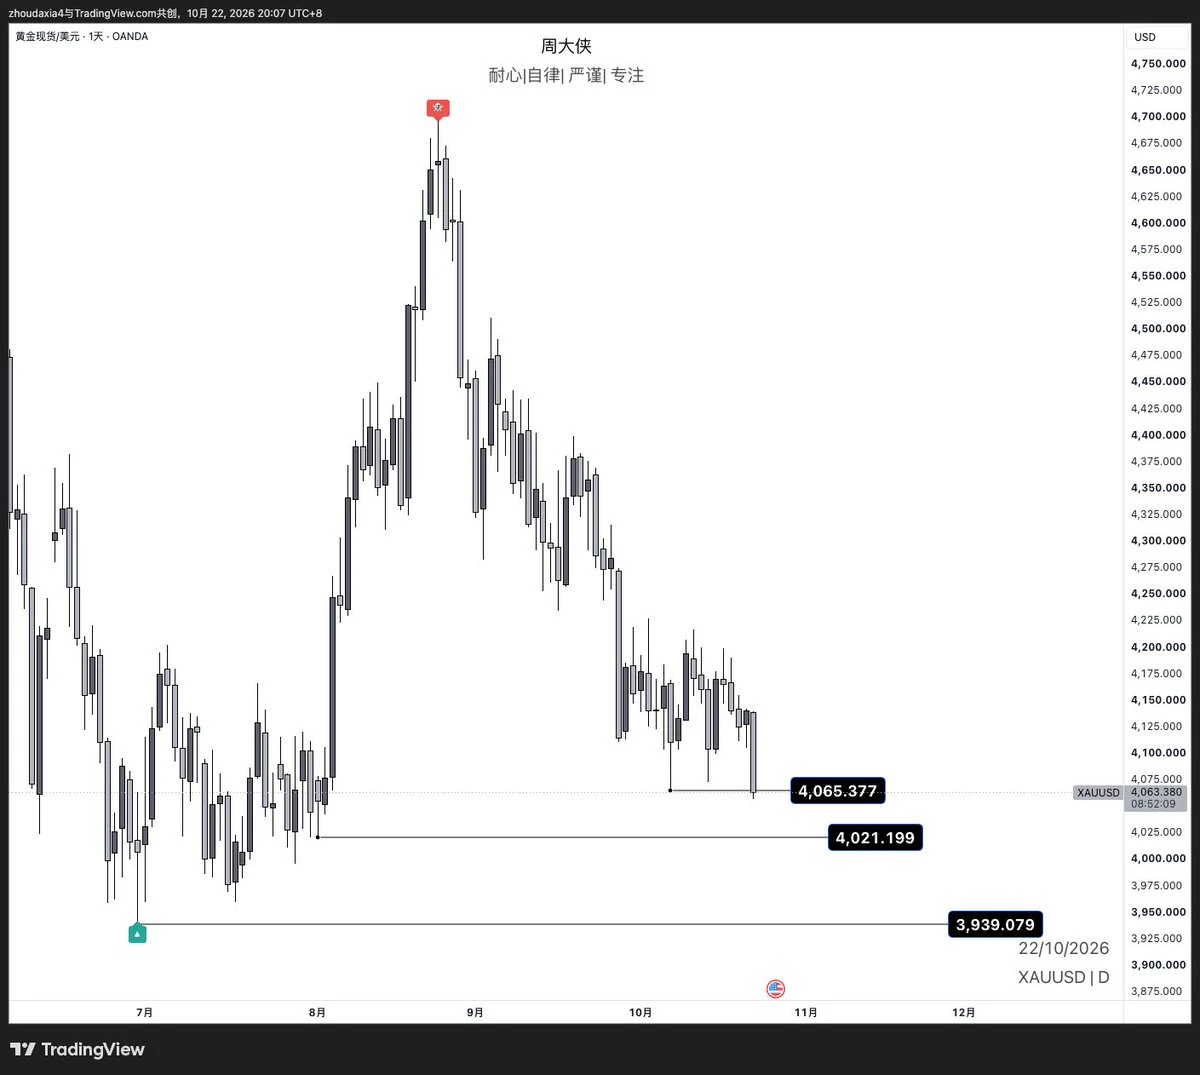
▪️ Gold & Silver:Spot gold recovered above $4,150, up over 1%, while silver rebounded above $56.9 per ounce, gaining more than 2.4%. The recovery was driven by falling yields, a softer dollar, and renewed safe-haven demand.
⚖️ Structural perspective:
🔹 The PPI acceleration broadens the inflation narrative beyond consumer-level price pressures. With producer costs rising across energy, transportation, and services, the data reinforces the case for the Federal Reserve to maintain a restrictive stance. Markets now price roughly a 29% probability of a rate hike at the October 27-28 meeting, with December tightening expectations remaining elevated.
▪️ For risk assets like Bitcoin, the primary pressure channel is the rate outlook: higher-for-longer borrowing costs reduce the relative appeal of non-yielding assets. Gold and silver, however, face a more layered dynamic, balancing safe-haven demand against real-rate headwinds.
▪️ The key variable ahead is whether the Fed signals patience at the October meeting or adopts a firmer tone. Until that guidance arrives, markets are likely to remain in a recalibration phase, with capital rotating selectively between growth, defensive, and hard-asset exposure.
🔹 How are you assessing the market's response to two consecutive inflation surprises? 👇
#PPI #Inflation #Bitcoin #Gold
Not financial advice.
repost-content-media
BTC+0.82%
US500+0.37%
NAS100+0.08%
Booooooooom 💰$TIA Target two reached: 0.5800. Keep your eyes on it, secure your profits. Congratulations 🎉🤑💰
post-image
TIA+4.94%
Buy when there’s blood in the streets...
#Bitcoin
post-image
ZEC moved lower intraday from around 1116, falling all the way to a low of 1074.66 before staging an oversold rebound, surging to 1246.91. The larger-cycle downtrend structure remains intact, so a rebound into the resistance zone presents an opportunity to short.
From the chart perspective, the long-term downtrend structure on the daily timeframe remains intact. This recovery is merely a correction during the decline, while the dense overhead trapped positions will create strong resistance.
On the 4-hour timeframe, consecutive large bullish candles have driven prices sharply higher in a short
post-image
ZEC+7.66%
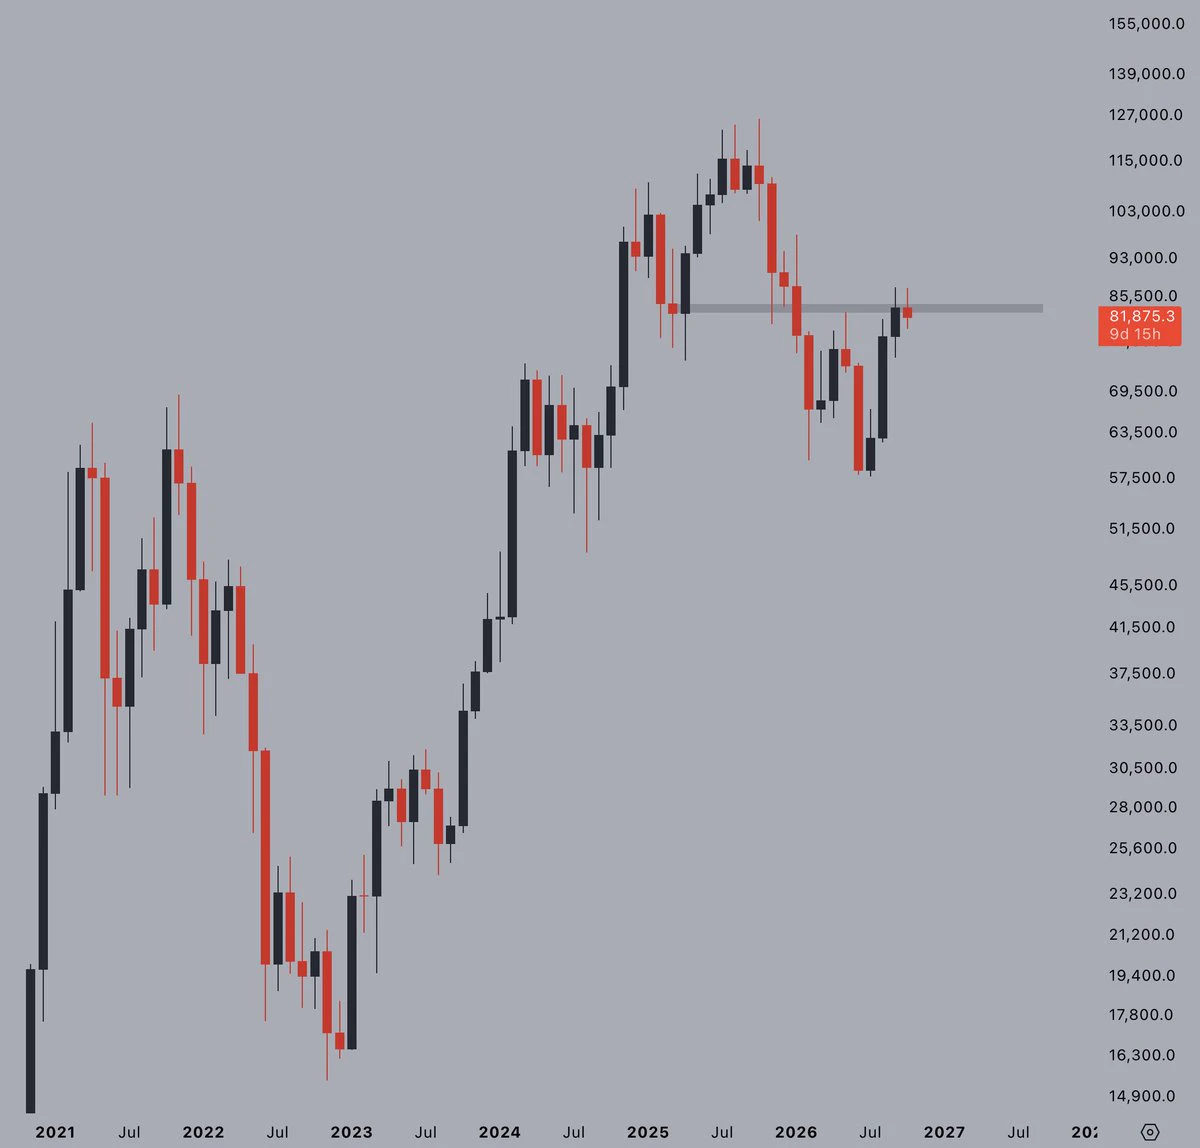
Intraday, Bitcoin’s rebound faced resistance and the bearish outlook remained clear. After rebounding to around 81700, it fell all the way, with the low reaching around 79800—the move was once again nailed perfectly!
From the current chart, the rebound after the previous sharp daily decline was merely a technical recovery. Selling pressure above remains heavy, MACD continues to maintain a bearish structure, rebound momentum is gradually fading, and the major trend remains unchanged. A rebound is an opportunity to short.
On the 4-hour chart, this rebound is a recovery bounce following the decli
post-image
BTC+0.83%
🔹Whale Dumps BTC and Loads Up on ETH! After selling 237.8 BTC and buying 7,929 ETH, is big money be
live-cover
LIVE1,380
Which step in this $INJ rally is the easiest to get fooled by?
When I looked at $INJ again, I first covered up the 24-hour +8.79%. It’s not that this number is unimportant, but it is too easy to let it steal your attention. What really needs explaining right now is that $INJ remains strong, while crowding has also been put plainly on the table. I admit the trend is strong, but what needs watching next is not how much higher it can surge, but whether anyone steps in on the first pullback.
The most convenient—and easiest to get wrong—reading is to mistake hype for support during a rise. Real su
post-image
INJ+9.31%
Load More

Join 40 M users in our growing community

⚡️ Join 40 M users in the crypto craze discussion

💬 Engage with your favorite top creators

👍 See what interests you

Trending Topics

USSeptemberPPIBeatsExpectations

91.35k Views1.86k Discussing

US September PPI came in at 6.3% YoY, well above the 5.3% market expectation, pointing to renewed producer-side inflation pressure. Weekly jobless claims were 199K, broadly in line with forecasts. Could hotter inflation further reduce room for rate cuts, and what does it mean for $BTC, US stocks, and gold?

DrLinHanSpeaksAtOxfordUnion

135.63k Views1.86k Discussing

JapanAndKoreaStocksPlunge

47.27k Views1.76k Discussing

View More