
Square
Following
Hot
News
Profile
Share your thoughts
placeholder
Article
Player Watch: SPCX Update 10.30
Big Rocket closed Thursday’s U.S. session at 143.89, down 0.92%, with an intraday high of 144.95 and low of 141.03.
As I said yesterday, Big Rocket is moving toward the false-breakdown level. This player will get in around 137 to ride the rebound.
Of course, we can’t go ALL in at once. Keep some powder dry and there’s no need to panic。。。。。。
SPCX-0.96%
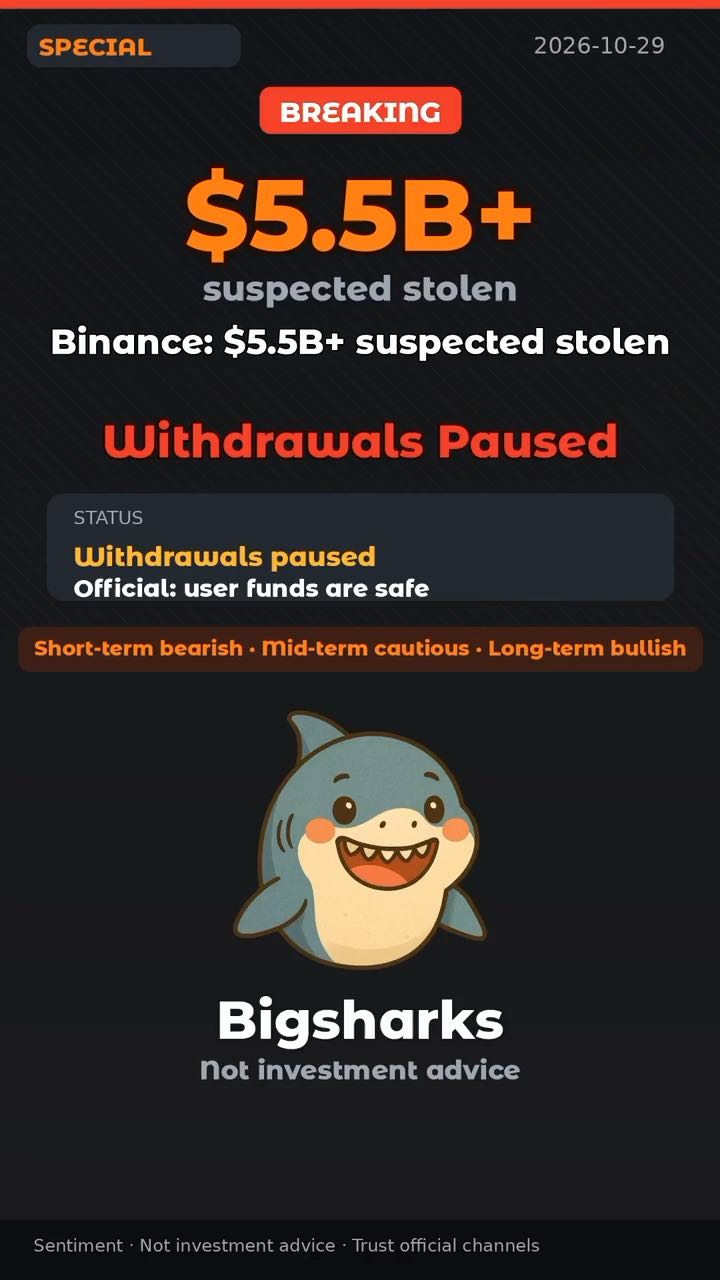
BNB's Security Defenses Have Been Breached
BNB-0.76%
  • 1
Trenches
BNCB
B
bade
b
BNCB
0x49...ec3f
Market Cap
$.
Change
.
24h Vol
$.
Holders
.
ENA
E
bade
b
ENA
0x57...6061
Market Cap
$.
Change
.
24h Vol
$.
Holders
.
PEPE
P
bade
b
PEPE
0x69...1933
Market Cap
$.
Change
.
24h Vol
$.
Holders
.
GTA6
G
bade
b
GTA6
4kjr...zDnz
Market Cap
$.
Change
.
24h Vol
$.
Holders
.
ZIG
Z
bade
b
ZIG
0x8c...1145
Market Cap
$.
Change
.
24h Vol
$.
Holders
.
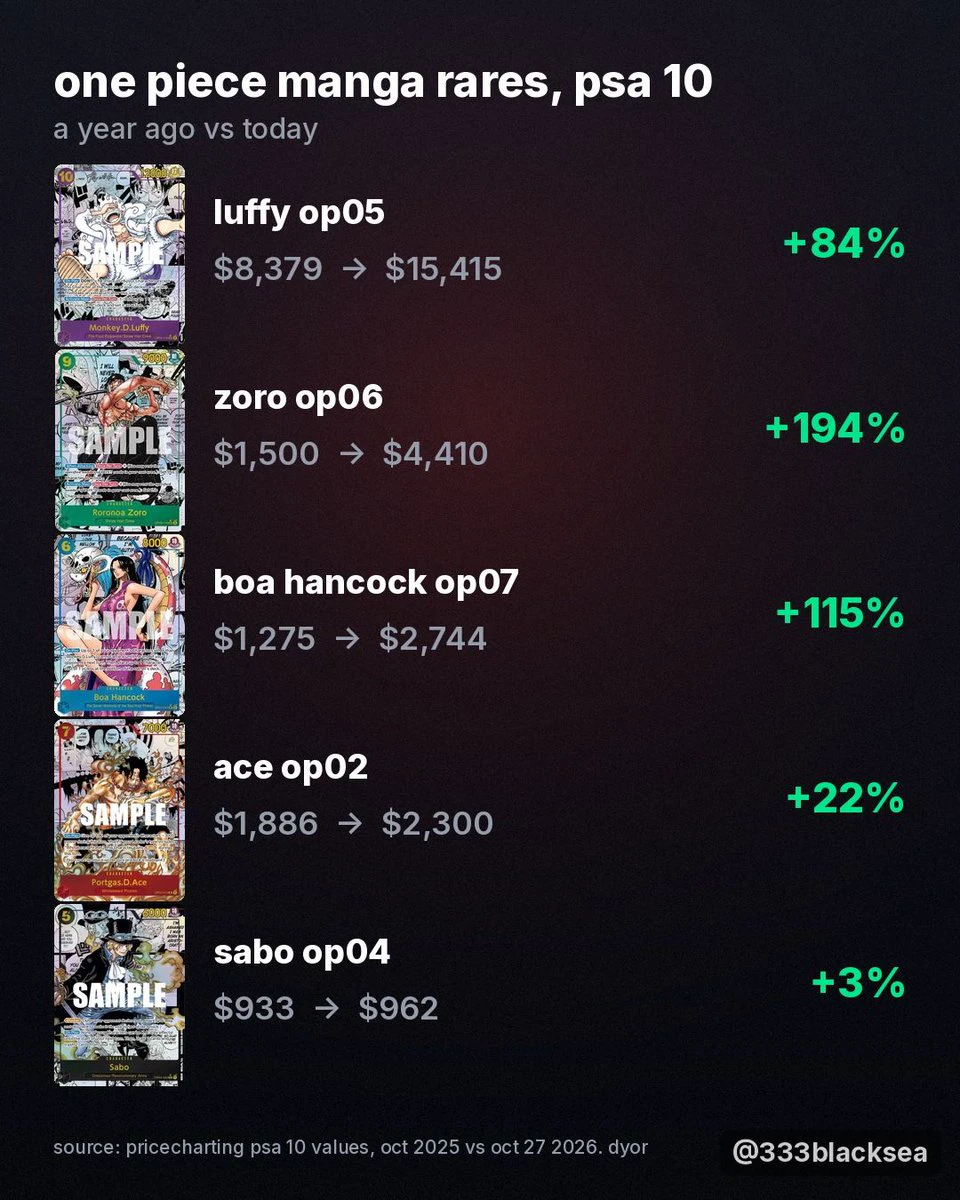
one piece manga rares, psa 10
a year ago vs today
luffy op05: $8,379 → $15,415
zoro op06: $1,500 → $4,410
boa hancock op07: $1,275 → $2,744
ace op02: $1,886 → $2,300
sabo op04: $933 → $962
5 for 5 green.
which one are you chasing?
post-image
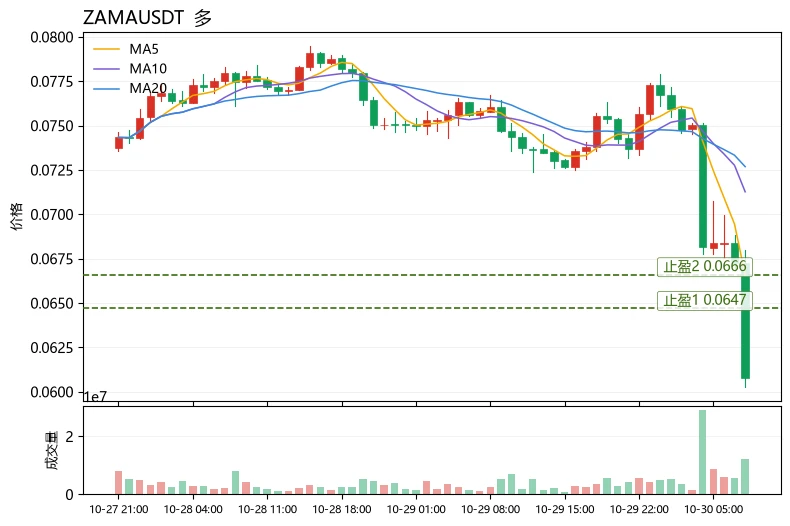
Fear Index at 30, RSI down to 18.5—can you buy the dip in such oversold conditions? No heavy buying—the market can get even more oversold. The move now is to wait for right-side confirmation and keep positions to a minimum, not bet on a rebound.
$ZAMA $ZAMA is currently at 0.06097, down nearly 20% in 24h, with a 29% range across 30 candles and volatility at elevated levels. Any heavy position is a bet with your principal. MA5 is below MA20, and the MACD histogram remains negative, so the bearish structure is intact; however, RSI=18.5 indicates extreme oversold conditions, while the funding rate
post-image
SNDKB
SNDKBSNDKB
Four.meme
MC:$3.87KHolders:1
0%
ZAMA+2.21%
ERA+24.21%
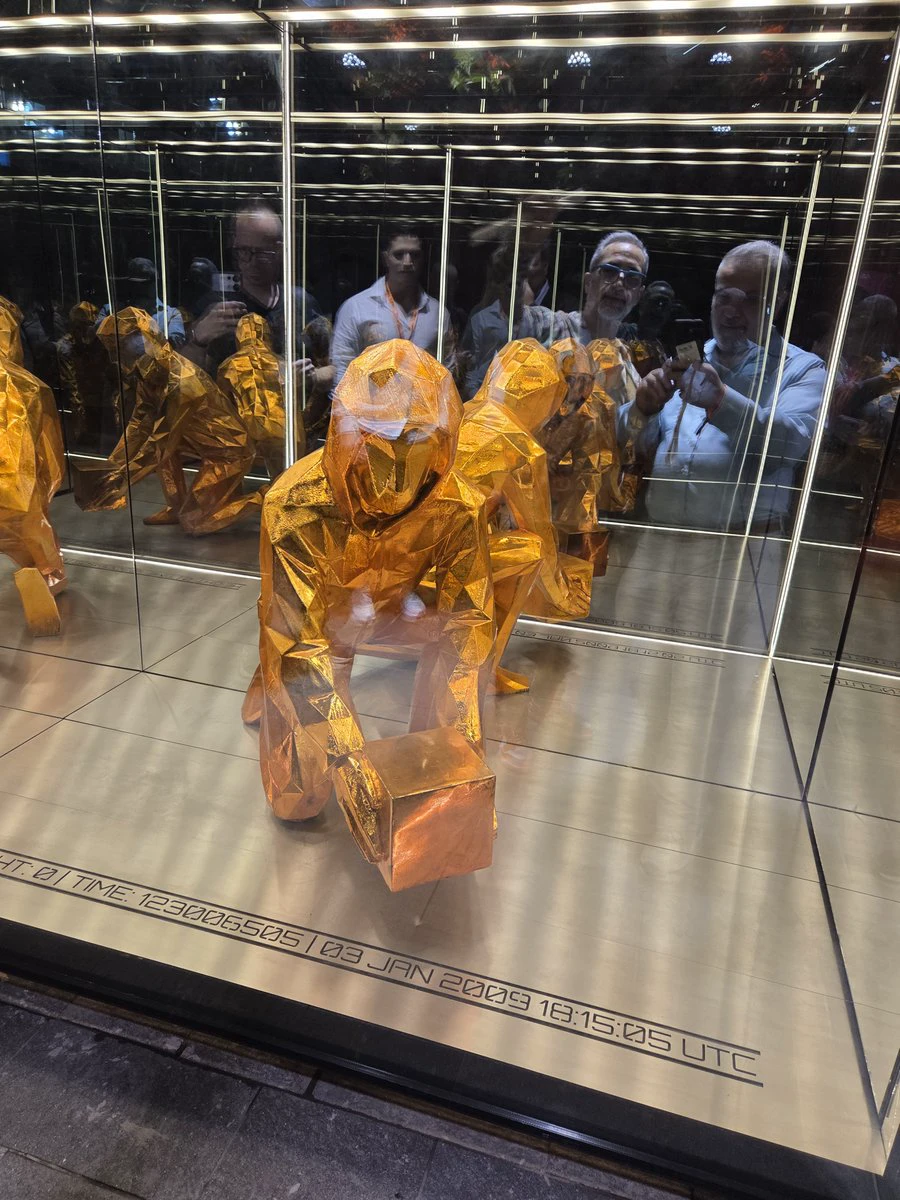
Beautiful monument to Satoshi in Buenos Aires, Argentina. Tonight is the inauguration. Infinite Satoshi.
post-image
$SLX 0.05131, Solstice packages long-term wafer fab usage rights into on-chain shares, paying rental income quarterly 🏭
Solstice is essentially a “digital landlord” business—it breaks up long-term usage rights to real-world wafer fabs into on-chain shares that can be held, at 0.05131 per share, and lets you sit back and collect rent every quarter. Leases are generally locked in for 5 to 10 years and are not linked to spot memory prices. So when Hynix released its earnings and chip stocks swung wildly, SLX barely budged. It falls under the RWA narrative, with the selling point being steady ca
post-image
XMU
XMUXMONEYUSER
Pump.Fun
MC:$3.33KHolders:1
0%
SLX+4.04%
BTC-0.67%
crypto market update
live-cover
LIVE2,231
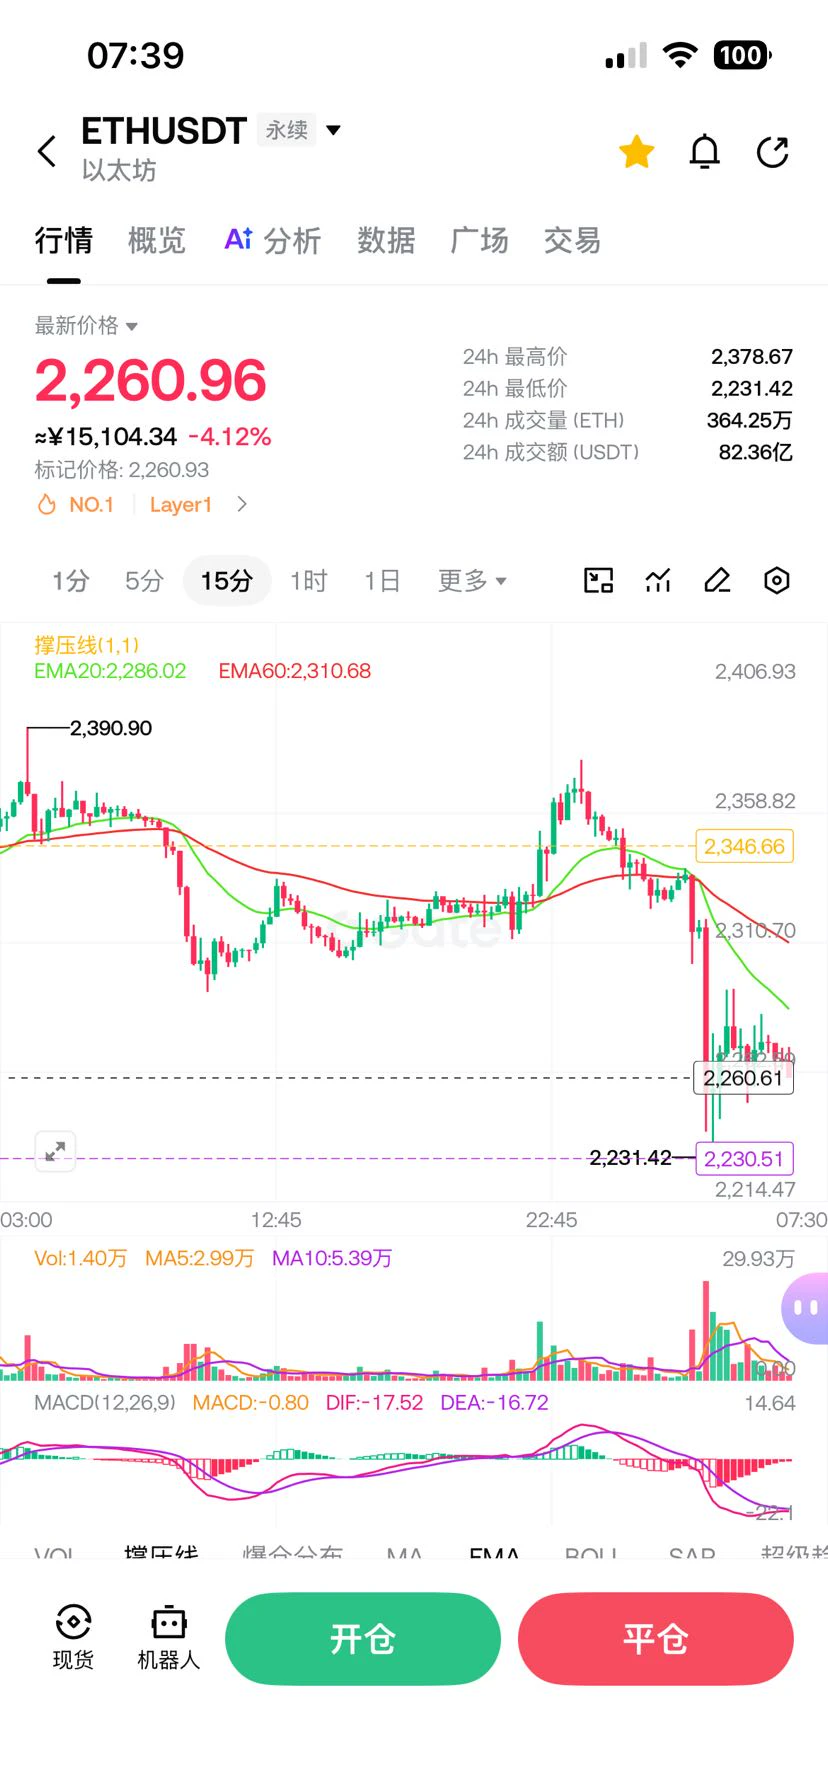
Woke up to see it had dropped this much—turns out it came tumbling down without even breaking the previous high.
post-image
Don't buy the dip, don't buy the dip, don't buy the dip
Crypto has taken an unprecedented hit this time
Panic hasn't even started spreading yet
This time, a drop below 70k wouldn't be surprising
post-image
A new token hasn’t opened yet, so why is its price jumping?
A new token hasn’t officially started trading, but the price on the page keeps changing. Has someone already traded ahead of time?
First, check whether the page is in the “call auction” phase.
During this phase, buy and sell orders are collected first, then the opening match price is determined according to the rules. The changing numbers you see may be an indicative price calculated from the current orders, not a price at which trades have already been executed.
It’s like an auction before it begins: everyone first states the prices
post-image
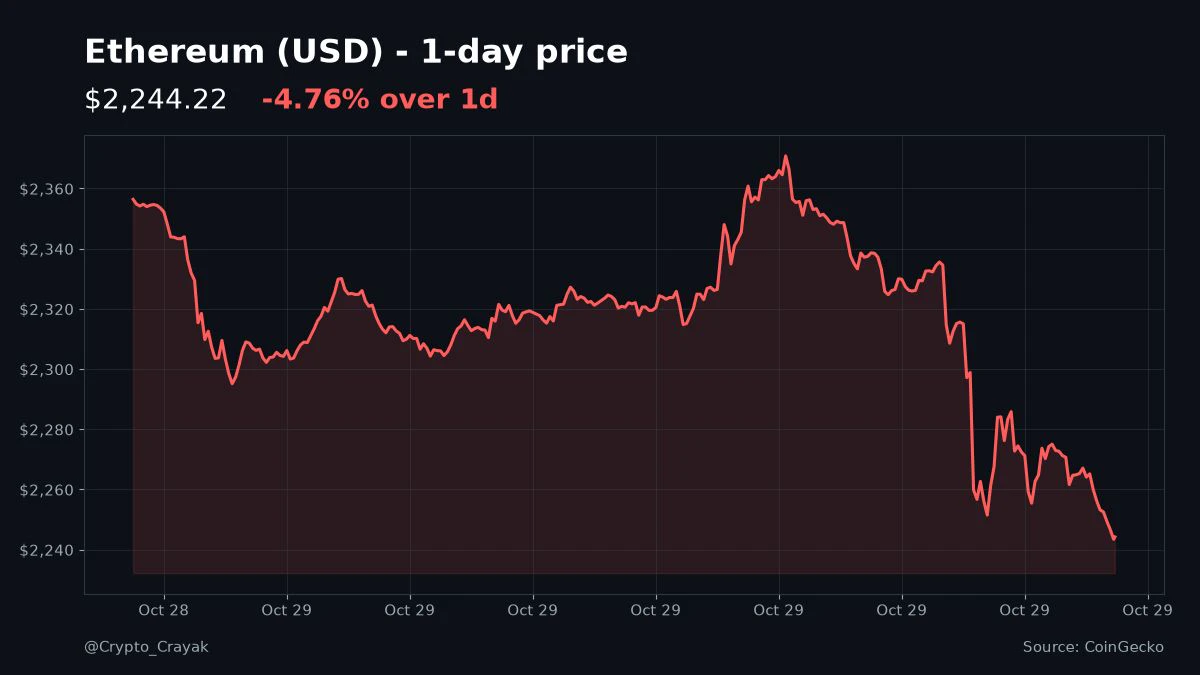
Red evening across crypto: total market cap down ~6.4% to ~$2.64T (CoinGecko). ETH ~$2,244, off ~4.8% on the day; BTC ~$77.8K.
A hawkish Fed hold plus weak tech earnings hit risk assets, and Fear & Greed sits at 30. Alts bleeding harder than BTC. #crypto
post-image
ETH-1.26%
BTC-0.67%
The daily chart is severely oversold. Buy the dip and bet on a rebound to MA7. Let’s go! Go long on $BTC . Entry range: 77,271.7 - 77,907.7. First target: 79,500. Second target: 81,028.24. Stop-loss: 76,499.0. Trade here.
Viewing market movements for ‍$SKHYNIX and $LSK .
post-image
SKHYNIX+1.41%
LSK-5.32%
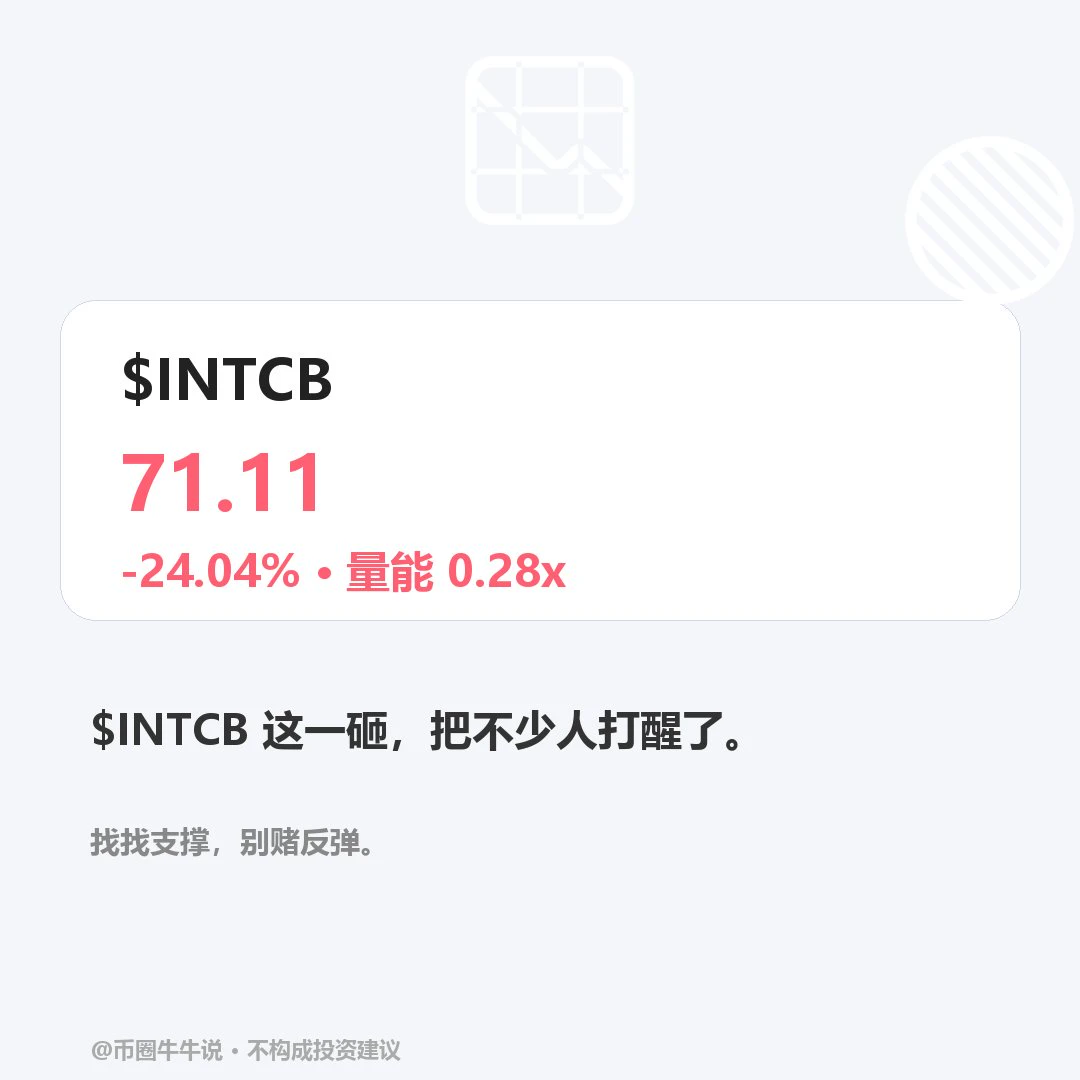
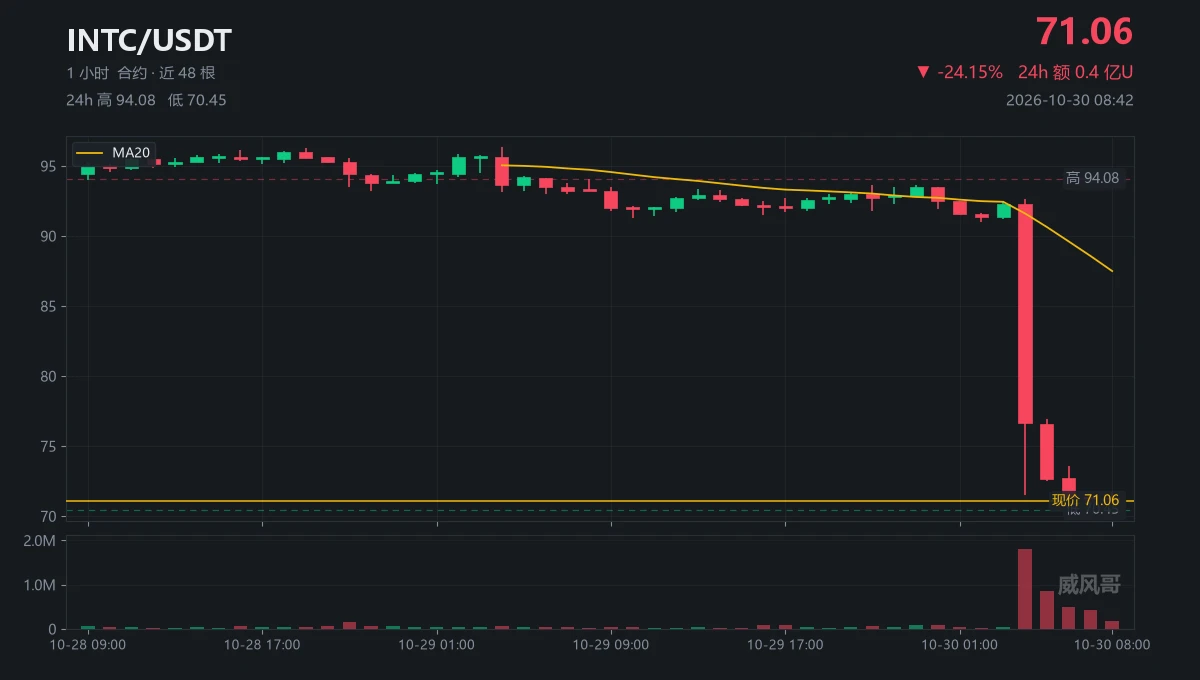
$INTCB is currently trading at 71.11, down 24.04% over 24H. The 1H trend is weak (RSI 10.3), weaker than the 4H trend (RSI 15.1), and the EMAs on both timeframes are above the current price. If it holds above the 93.92 resistance, watch for potential upside; if it breaks below the 70.82 support, the decline could accelerate. In the follow-up review, watch whether it can hold above resistance and reclaim support. Low trading volume means any breakout needs confirmation; the market is volatile, so this is for observation only.
post-image
Oct. 30 Day-Trading Strategy: War Warning, Sticky Inflation, High Oil Prices, Grid Shorting at Elevated Levels
Market logic and technicals are interconnected. When the logic is bearish but the technicals are bullish, it often carries huge risks. Every technical “countertrend move” is “adding fuel,” only for a single wick to burn it all off. Yesterday’s overnight session, with a “sharp rally followed by a plunge,” was exactly that.
The US military is shipping air-defense interceptor munitions to Israel, while clusters of transport aircraft are landing simultaneously at nearby bases in Jordan, S
ETH-1.26%
  • 1
Last night: Long ETH at 2325 and short at 2375—the short position brought in a huge profit, with gains on both long and short positions; long SOL at 99.5 for a huge profit; long BTC at 79900 for a profit; and short BTC at 81700-82000 for a huge profit
  • 2
Down 24% doesn't hurt; what hurts is that it's still searching for a bottom.
Someone in the group said it was oversold and to buy with eyes closed. (I laughed.)
The 04:00 candle printed 1.796 million contracts, 7.91 times the average volume. (That wasn't a dump; they threw it away.)
From 92.29 to 71.49 in one hour, down 22 points. (No time to catch your breath.)
The next three candles came in at 3.75x, 2.16x, and 1.92x, getting smaller with each dip-buy. (Fewer and fewer people.)
The 08:00 candle was down to just 0.75x. (The volume's gone.)
A low-volume bounce isn't a reversal; it means the sh
post-image
INTC+0.05%
[New Streamer]Microsoft’s cloud business beats expectations again! Cash flow remains steady—
live-cover
LIVE1,627
10.30 BTC Analysis
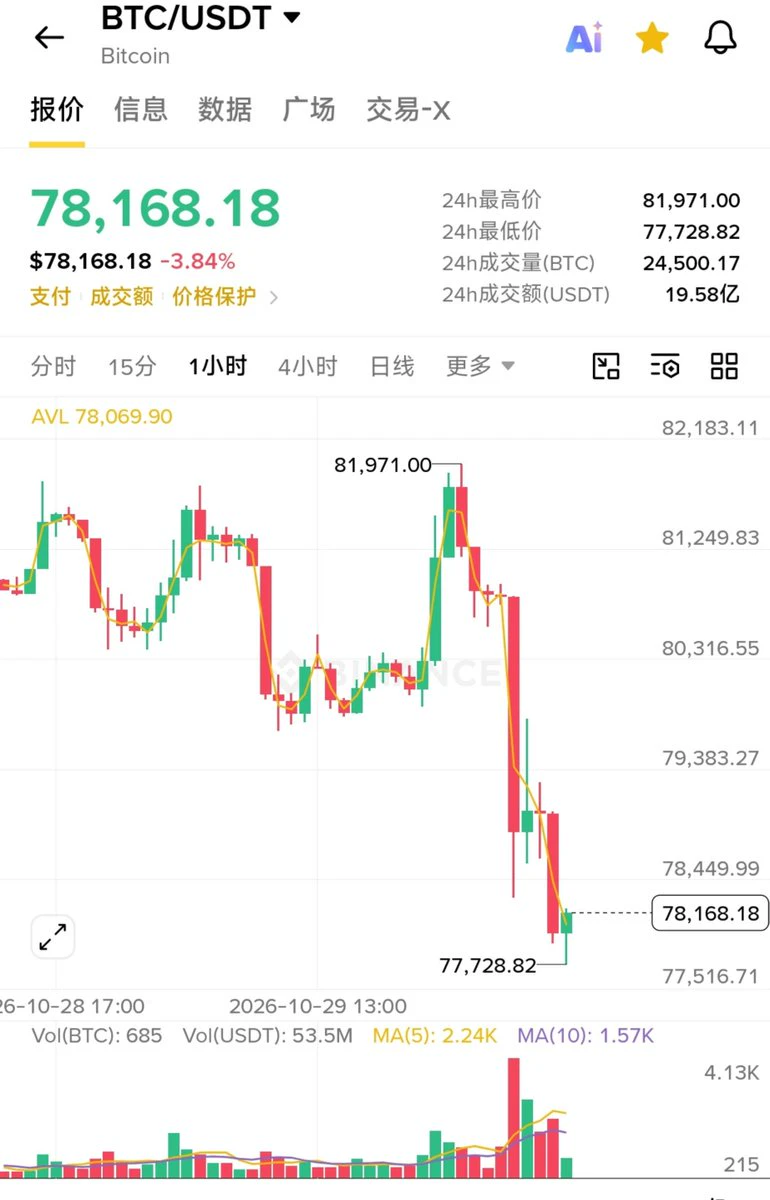
BTC broke down progressively on the 1-hour timeframe, with the price moving below the lower Bollinger Band and forming a widening negative deviation as volatility surged. This sharp decline resulted from multiple factors converging: a previous range support level gave way, triggering a cascade of long stop-loss liquidations and leveraged selling, while buyers quickly dried up. Combined with declining risk appetite in external markets, funds retreated from risk assets and selling pressure was released all at once.
Bearish momentum has quickly become overstretched in the short
post-image
BTC-0.67%
Load More

Join 40 M users in our growing community

⚡️ Join 40 M users in the crypto craze discussion

💬 Engage with your favorite top creators

👍 See what interests you

Trending Topics

FedKeepsRatesSteady

56.8k Views1.83k Discussing

The Fed will announce its rate decision on October 28 at 18:00 (UTC), followed by a press conference at 18:30 (UTC). Markets widely expect rates to remain unchanged, with attention turning to future policy signals. Could this decision break crypto out of its trading range? What signals are you watching?

USEarningsSeason

278.83k Views2.7k Discussing

Gate24HNetInflowsRankTop2

6.66k Views977 Discussing

View More