Square
Following
Hot
News
Profile
Share your thoughts
placeholder
Article
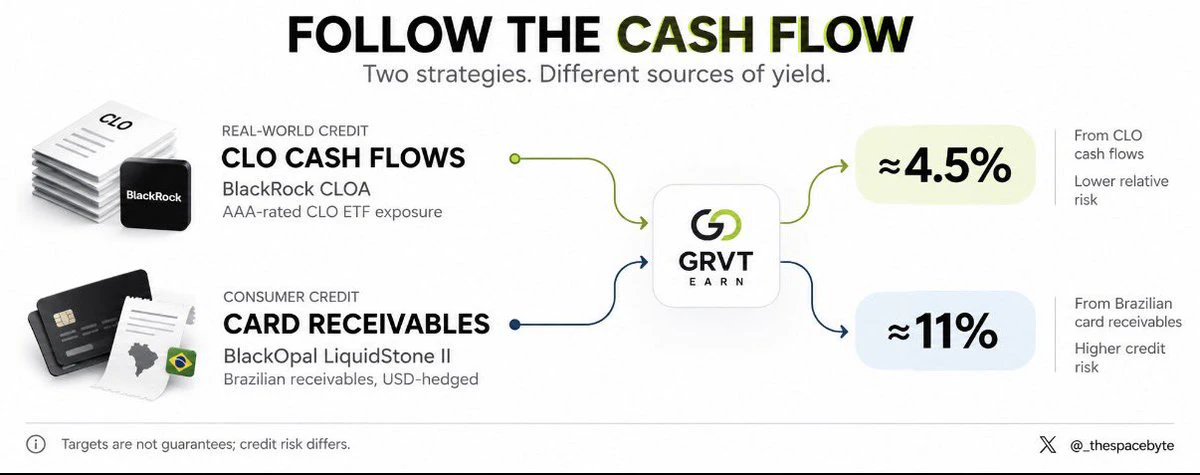
4.5% vs ~11% target APY across two RWA strategies on @grvt_io:
Balanced Bundle
• Target APY: ~4.5%
• Primary exposure: BlackRock CLOA
Opportunistic Bundle
• Target APY: ~11%
• Primary exposure: BlackOpal LiquidStone II
The difference goes beyond yield. The Balanced Bundle focuses primarily on AAA rated CLOs, while the Opportunistic Bundle targets income from Brazilian credit card receivables with FX hedging.
Both provide access to real-world credit, but with different risk profiles.
What makes this move interesting is where GRVT is taking Earn.
The upcoming upgrade aims to bring fixed-income s
post-image
RWA-0.47%
GRVT-6.40%
Yesterday, $PONS recorded its lowest day of revenue, earning just $30,000.
A few months ago, it was pulling in almost $6M in a single day, and in September alone the protocol made $137M in fees.
So, the question on everyone's mind is: where exactly did all that liquidity go?
EXTRACTORS.
Last month, @WazzCrypto exposed an operation linked to 53 launches on Robinhood Chain over two months, with around $18.43M extracted.
$18M meant to circulate in the ecosystem.
$18M meant to go into the hands of true believers and committed devs.
$18M removed from Robinhood Chain forever.
They allegedly sniped
post-image
PONS+2.34%
Trenches
ZIG
Z
bade
b
ZIG
0x8c...1145
Market Cap
$.
Change
.
24h Vol
$.
Holders
.
CNPY
C
bade
b
CNPY
0xc6...ddd2
Market Cap
$.
Change
.
24h Vol
$.
Holders
.
STONK
S
bade
b
STONK
6GmA...UNgx
Market Cap
$.
Change
.
24h Vol
$.
Holders
.
BTC
B
bade
b
BTC
C5xp...pump
Market Cap
$.
Change
.
24h Vol
$.
Holders
.
LIGHT
L
bade
b
LIGHT
0x47...3c0e
Market Cap
$.
Change
.
24h Vol
$.
Holders
.
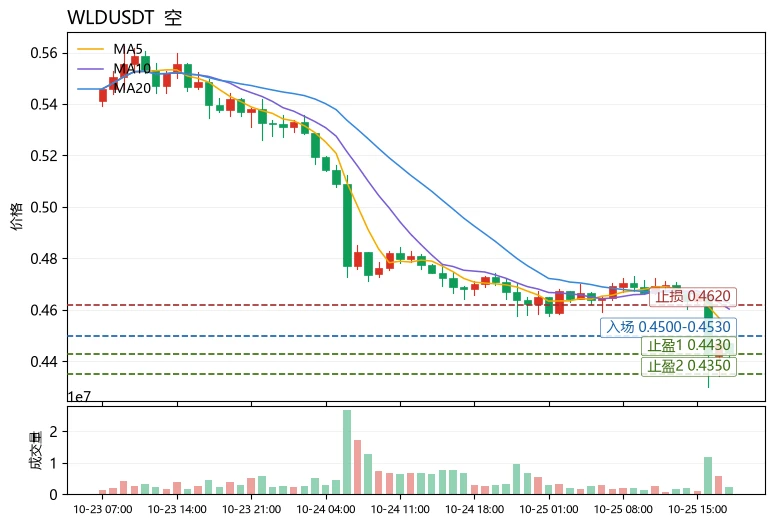
$WLD The most unusual thing today is not the 5.62% decline, but that the price has already fallen below the lower Bollinger Band at 0.4462, while RSI is only at 29.6. It is oversold, but there are no signs of the kind of panic-driven exhaustion in bearish momentum; the MACD histogram remains in negative territory at -0.000936, and MA5=0.45248 is below MA20=0.46277, a textbook bearish moving-average alignment.
Structurally, the current price of 0.4433 is at the outer edge of the Bollinger Bands, creating short-term demand for a rebound toward the middle band, but the upside is capped near 0.452
post-image
WLD-4.40%
GT-0.50%
Disconnected, starting over...
live-cover
LIVE1,394
XRP market update
live-cover
LIVE1,651
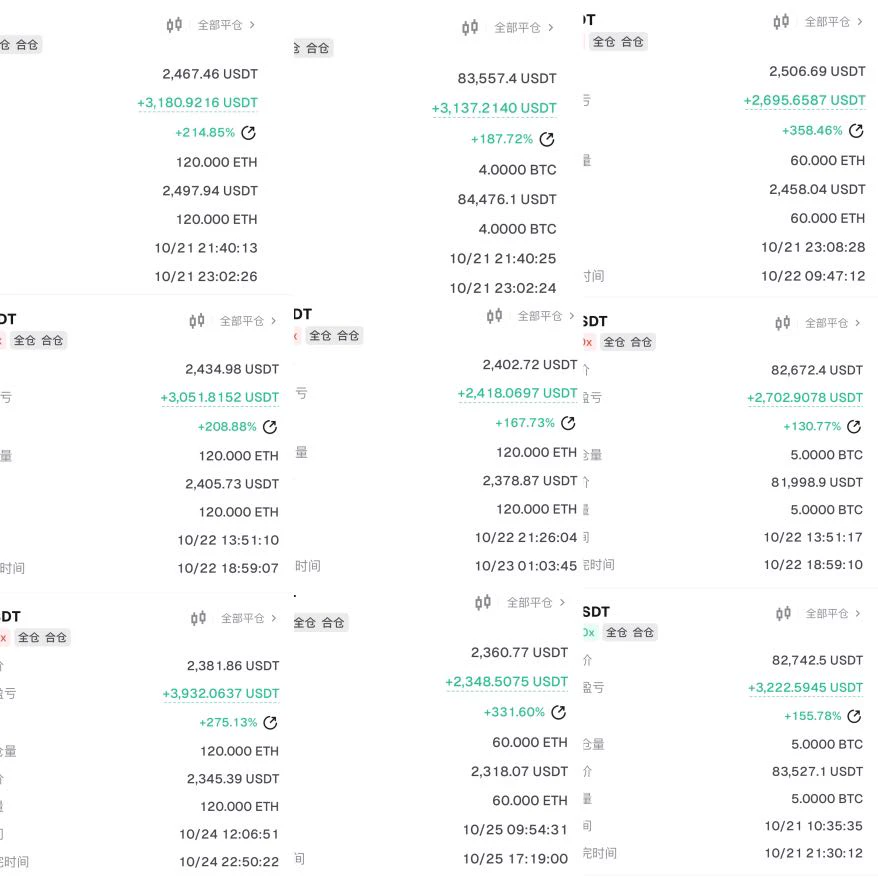
Getting the market timing right and putting your ideas into action is what brings returns.
Don’t blindly chase rallies or sell into dips. Find the right range, hold patiently, and profits will follow naturally.
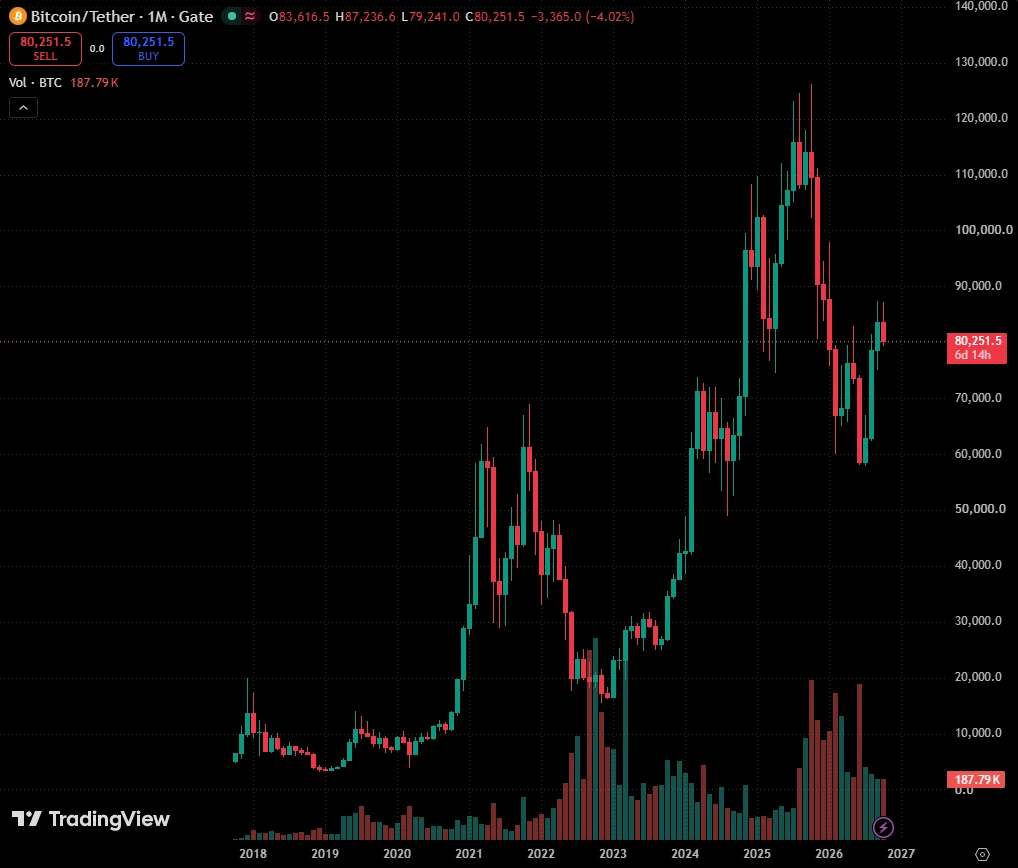
The gains from every trade are the best confirmation that your direction and timing are right.#GateWCTCS9全球交易赛 $BTC ‌
post-image
BTC-0.12%
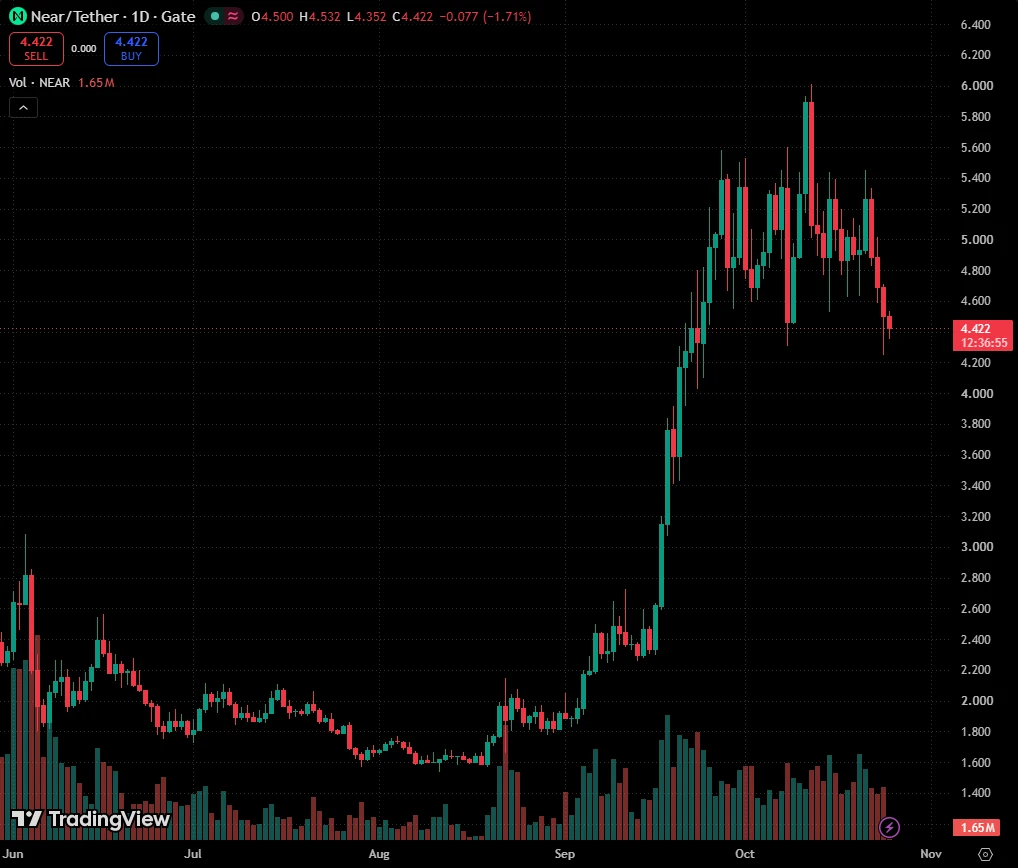
$NEAR NEAR Protocol: Key Demand Zone Ahead ($3.4 - $2.5) Possible Buy
Description:
Although NEAR has established several minor support levels on its way down, we believe the strongest structural demand lies within the $3.40 – $2.50 range (Fair Value Zone & High-Confluence Demand Zone).
Key Takeaways & Game Plan:
Primary Buy Zone ($3.40 – $2.50):
This area aligns closely with the 200-week EMA and key horizontal structural levels. We consider this confluence zone the primary target to start building long positions for the next macro leg up.
The Black Swan / Crash Scenario:
In a broader crypto c
post-image
NEAR-0.88%
Why Does More Frequent Trading Make It Easier to Underestimate the Impact of Costs on Long-Term Returns?
When reviewing their trades, many traders focus only on the buy price, sell price, and profit or loss, while overlooking a factor that continuously affects account performance: trading costs.
The cost of a single trade may seem small, but as the number of trades increases, these costs can gradually erode an already limited profit margin.
I. A Small Per-Trade Cost Does Not Mean a Small Long-Term Impact
Suppose a trader pays an average of 0.1% of the trade amount in combined fees and slippage
post-image
  • 2
I need a life-changing trade
Opportunity is everything. Damn trenches.
post-image
$BTC BITCOIN: This Breakout Zone Will Define the Upcoming Cycle!
In my recent analysis, I found that BITCOIN is forming the next historical bullish triangle and likely a bullish breakout cycle development. In this case, I have detected all the pivotal factors necessary to consider next.
When looking at my chart, we can see how BITCOIN has several times completed this exceptional historical descending triangle formation. These triangles always found substantial support within the major historical bullish lower support accumulation boundary, where they bounced once they found support.
The triang
post-image
BTC-0.12%
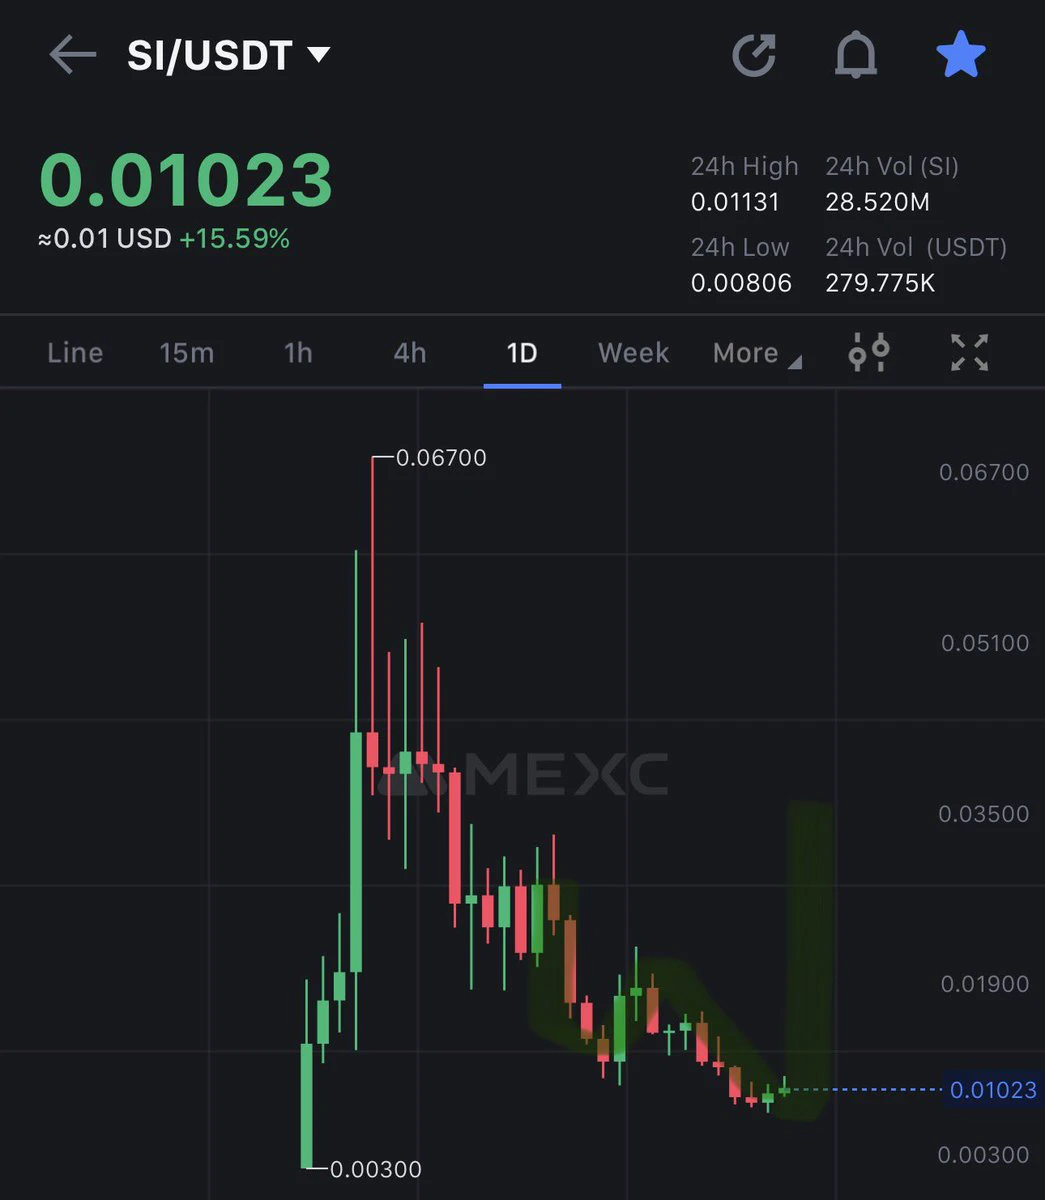
$SI is free money right now.
Easy 3x-4x in the next few days.
Could do a new ATH as well.
post-image
SI+11.09%
#SpotGoldFallsBelow$4000 #ShareWeekly
Spot Gold Falls Below $4,000: Full Analysis of the Breakdown, Drivers, Current Levels, Outlook, and Trading Considerations
Spot gold has slipped below the psychologically important $4,000 per ounce level, marking a notable technical and sentiment shift in the precious metals market. Recent trading saw prices trade as low as approximately $3,975–$3,986 before hovering near $3,990–$3,997 in late sessions. Futures also reflected the pressure, with weekly declines of roughly 4% in some reports, representing the steepest weekly drop since June. This move comes
XAU-0.08%
USIDX+0.13%
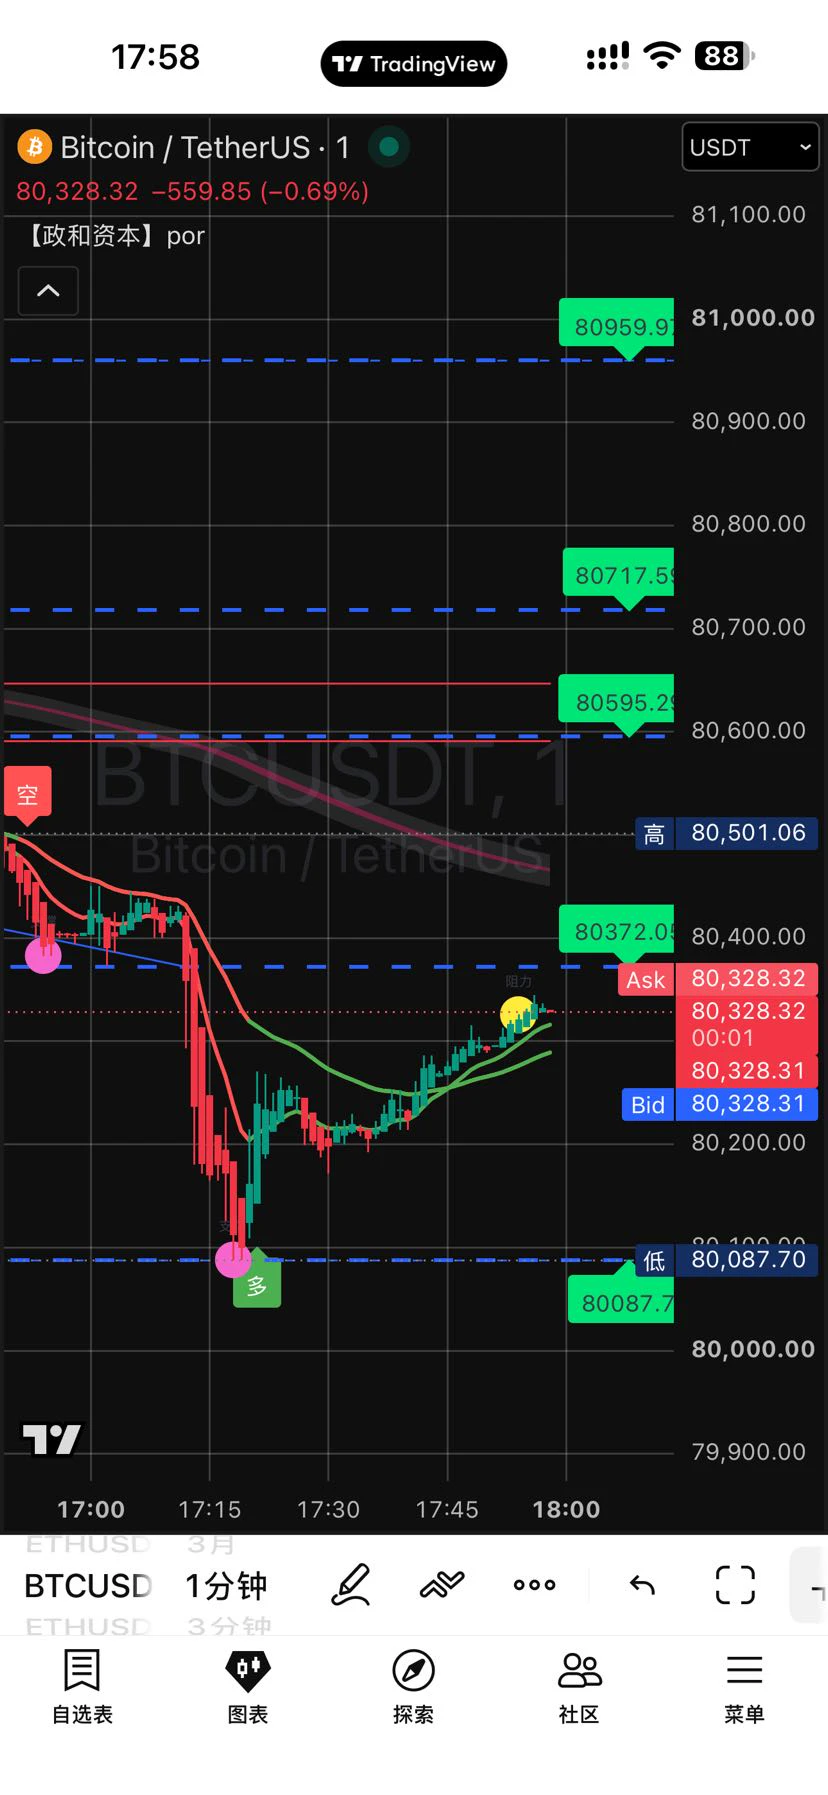
October 25, 2026 (Sunday) BTC Contract Analysis and Strategy (as of around 18:00 HKT)
Current Market Overview
BTC is currently trading around $80,000–$80,600, down slightly by approximately 0.3–0.9% over 24 hours. On Saturday evening, it briefly dipped to around $79,200–$79,600 (a one-month low) before rebounding slightly. It is Sunday, traditional markets are closed, and liquidity in crypto markets is relatively thin, which may amplify volatility.
The price has fallen below the $81,000–$82,000 range seen over the previous few days and slipped below the 50-day moving average. Weekend funding r
post-image
BTC-0.12%
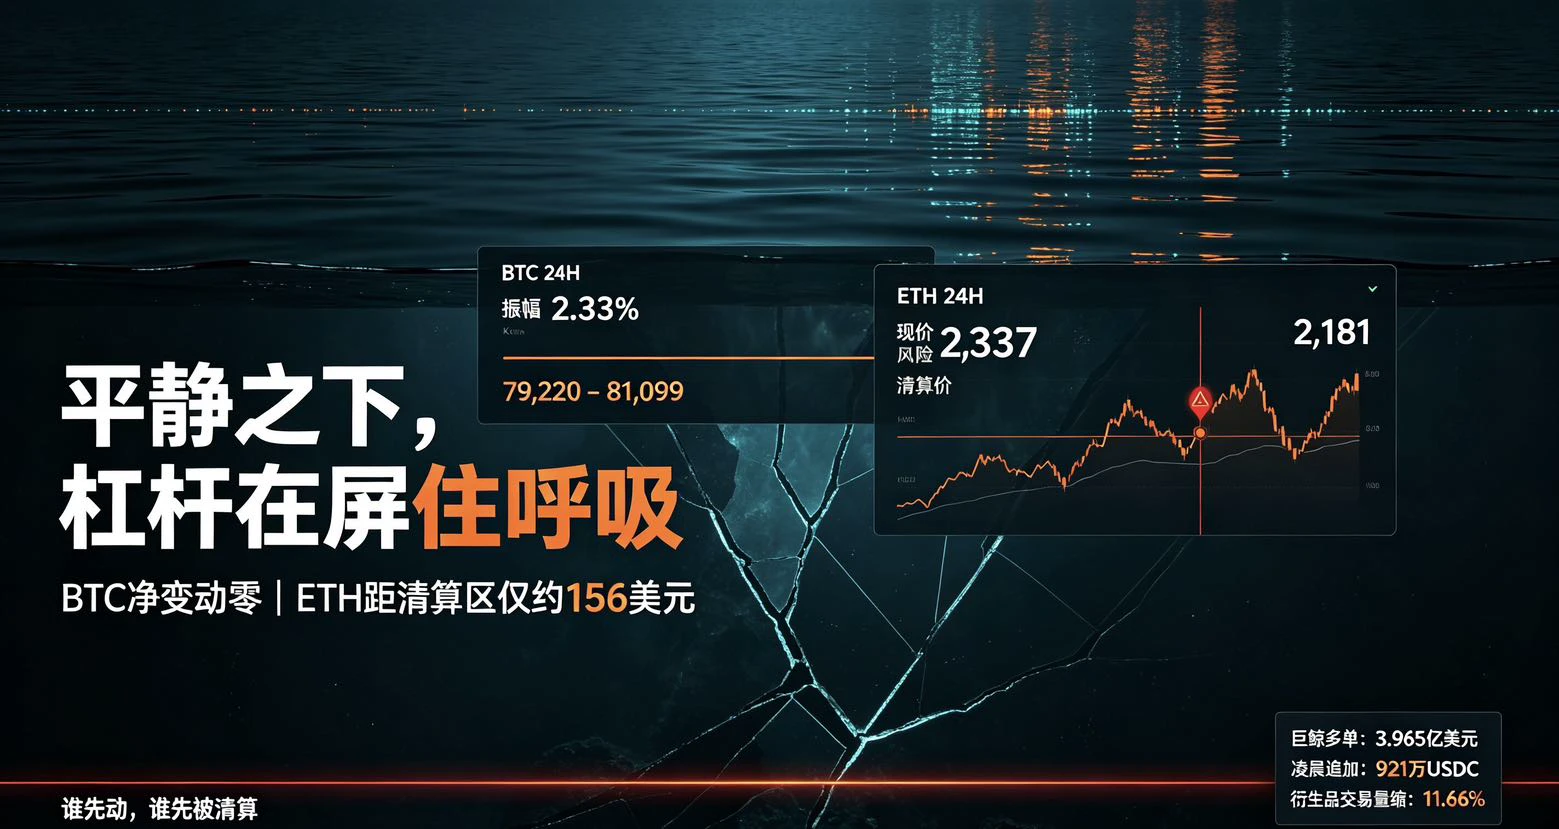
These two candlesticks had me nearly falling asleep watching them—$BTC BTC just drew a flat line while ETH sat on the can. For a moment, I wondered if the exchange had switched its servers to power-saving mode.
BTC’s 24-hour range was 2.33%, swinging all the way from 79,220 to 81,099, only to end up nowhere; ETH fared even worse, hovering around 2,337, just over a hundred bucks above a certain whale/institution’s ETH long liquidation price of 2,181. This whale is sitting on $396.5 million in BTC+ETH longs and urgently topped up its margin with 9.21 million USDC in the early hours, yanking the
post-image
BTC-0.12%
ETH-1.19%
How many of Musk’s big claims over the years have actually come true?
post-image
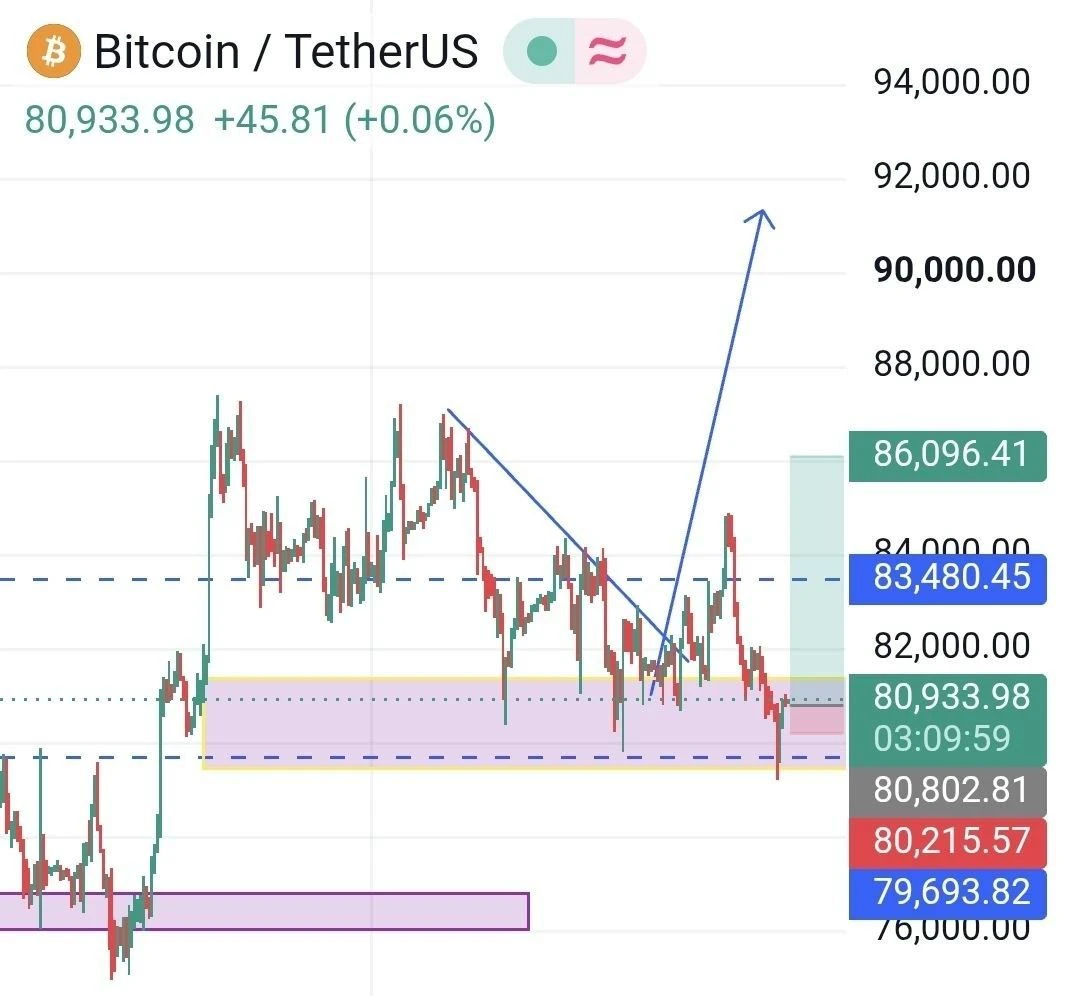
$BTC is testing a critical support zone around $80,800–$81,000. The next move could define the short-term trend.
A reclaim of $83,480 could open the door toward $86,000, with $90,000+ in focus if bullish momentum returns.
But if support fails, downside risk remains.
Watching for confirmation, not chasing the move.
#GateSquareNewCreatorProgram #USConsumerSentimentNearRecordLow #USEarningsSeason #GateWCTCS9GlobalTradingCompetition
post-image
BTC-0.12%
  • 1
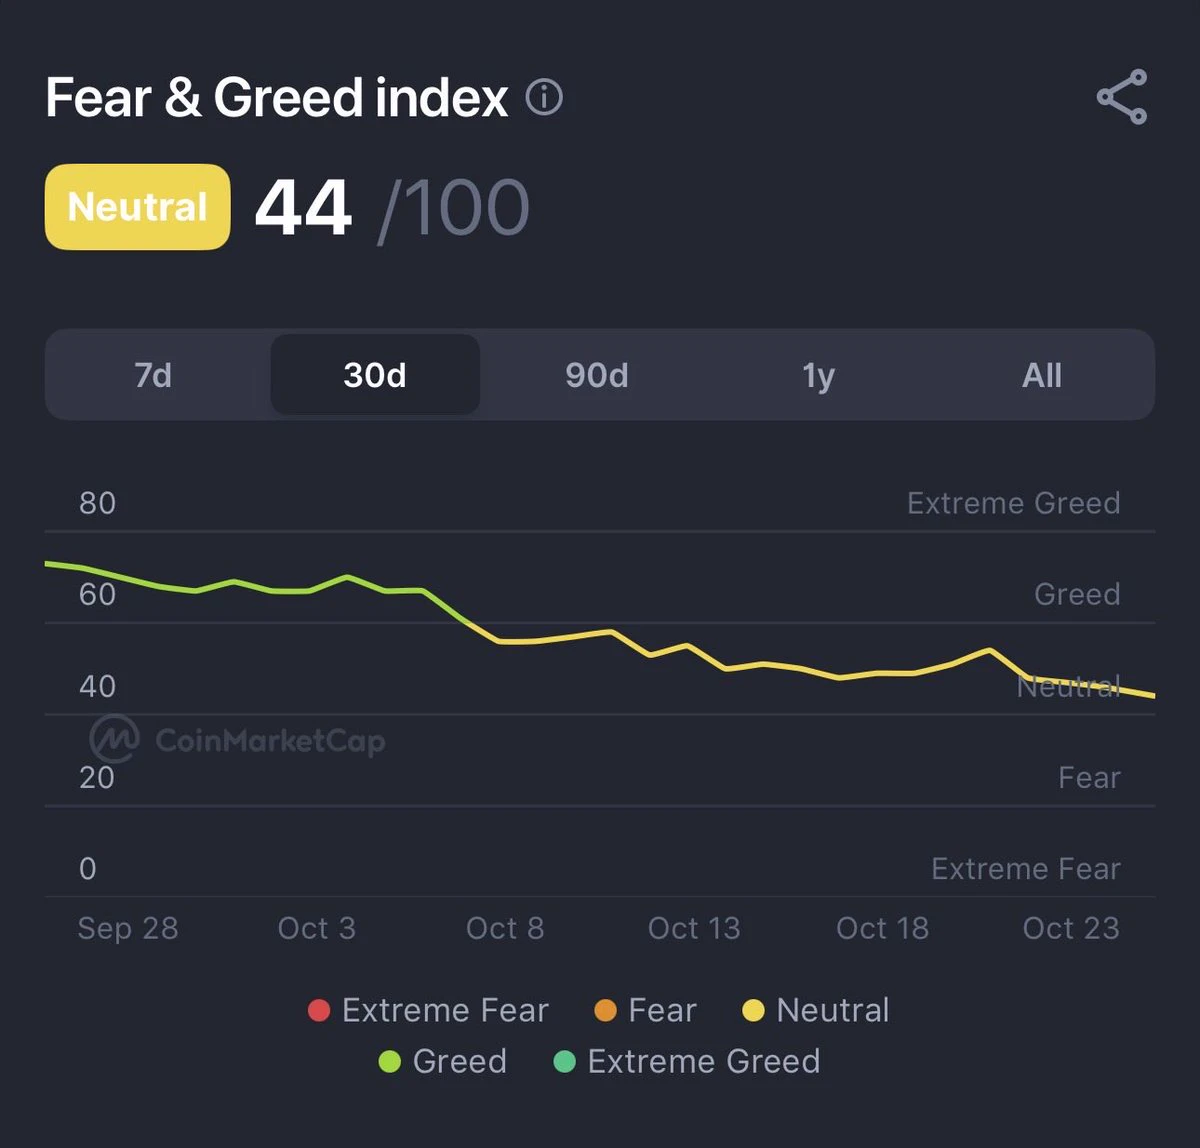
You felt bullish at the end of September.
Four weeks later, you probably feel nothing.
The Fear & Greed index shows exactly how that happened.
Late September:
Mid 60s, solidly in Greed
Today:
44, Neutral, just above the Fear zone
That is a slide of more than 20 points in market mood in one month.
Here is where the market stands this morning:
Total crypto market cap: $2.68T
$BTC : $80,090
$ETH : $2,323
Fear & Greed: 44
Yesterday's drop toward $2.65T got bought back within hours.
And the top headline on the board?
The US OCC finalizing its rules for the GENIUS Act, America's stablecoin law.
Read t
post-image
BTC-0.12%
ETH-1.18%
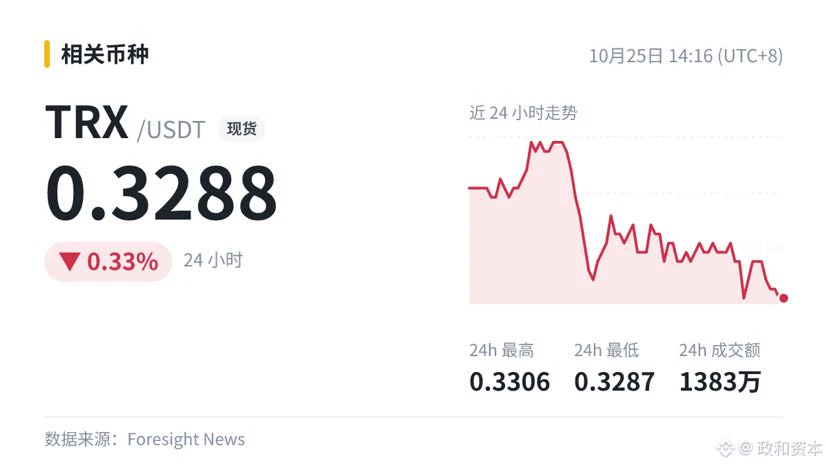
Salus: Tether has frozen 9 addresses linked to the CoinDCX incident, involving 2.2129 million USDT
When bad news hits, everyone wants to sell. The real bottom often comes when no one dares to buy. Don’t chase the news as soon as it breaks; wait for the candlestick to close before judging. Do you think this news is being undervalued? $TRX ‌#美股财报季
post-image
TRX-0.38%
Seeing a few smart people talk about $XMR atm and it's certainly one I've watched for a while. For me, I think I'd want exposure to both $ZEC and $XMR.
Looking for this low time frame breakout against ZEC, XMR hasn't pumped against ZEC since 2021 era, maybe we will see a shift.
XMR+0.00%
ZEC+4.86%
Load More

Join 40 M users in our growing community

⚡️ Join 40 M users in the crypto craze discussion

💬 Engage with your favorite top creators

👍 See what interests you

Trending Topics

USEarningsSeason

89.79k Views3.45k Discussing

The U.S. Q3 earnings season is in full swing, with major tech companies including Tesla and Meta reporting results. Market focus is shifting beyond revenue and profit toward AI spending, capital expenditure, margins and forward guidance. Which company’s earnings are you watching most closely?

GateWCTCS9GlobalTradingCompetition

690.21k Views8.02k Discussing

USConsumerSentimentNearRecordLow

9.7k Views271 Discussing

View More