
Share your thoughts
placeholder
Article
JUST IN: Bonk Guy flags PONS as undervalued, citing $1.34M in one-day revenue and ~ $202M annualized revenue against a $434M market cap, with $3.7M in buyback funds accumulating to buy PONS via TWAP. Could signal renewed macro focus on Robinhood Chain tokens. $PONS
post-image
PONS-15.53%
Hunter Biden's crypto memecoin $LAPTOP crashes 99% two hours after launch.
According to DexScreener, its MarketCap still showing more than $600M
post-image
#BitMine66WeekETHStreak592M
🔥 BitMine Keeps Buying ETH — Is Ethereum Preparing for Its Next Big Move?
Ethereum is entering an interesting phase where institutional accumulation and technical structure are telling a similar story: buyers are still active, but the market needs confirmation before the next major move.
BitMine has now extended its Ethereum buying streak to an impressive 66 consecutive weeks. Its reported treasury has reached approximately 5.93 million ETH, putting its holdings close to 4.9% of Ethereum’s total supply and very near its stated 5% supply target.
That is a significa
ETH-0.55%
Most traders will miss this quiet move in SYMBOL right now.

$SOL /USDT - LONG

Trade Plan:
Entry: 100.79 – 101.25
SL: 98.19
TP1: 103.15
TP2: 104.56
TP3: 106.69

Why this setup?
Why now? The 1h price sits at 101.02, the exact entry reference, so the setup is live and the daily trend remains range-bound, which keeps chop contained. The 15m RSI at 51.53 shows the short-term momentum is neutral, neither overbought nor oversold, giving room for a clean push. The 1h ATR of 0.908369 defines the volatility envelope, so the expected wave from entry is roughly that size. The entry zone between 100.7
SOL-1.19%
Layout for Bitcoin, Ethereum, and Dogecoin
live-cover
LIVE1,301
Thursday morning! Continue shorting the rebound! Enter the first position around 786, with the target still around the previous low of 763! The overnight 776 target was basically reached, so everyone is out. For ETH, 2430 should do!
Initial jobless claims are due today! This data comes out every Thursday and won’t trigger too much panic, so just buy the dip on the short-term wick! The broader direction still depends on whether U.S. stocks can bring about significant volatility!
post-image
ETH-0.55%
September 10 Market Analysis
BTC Silk Road reference setup
Pullback range: Go long near 777_00–78000
Stop-loss: 77200
First target: 79100, second target: 79500
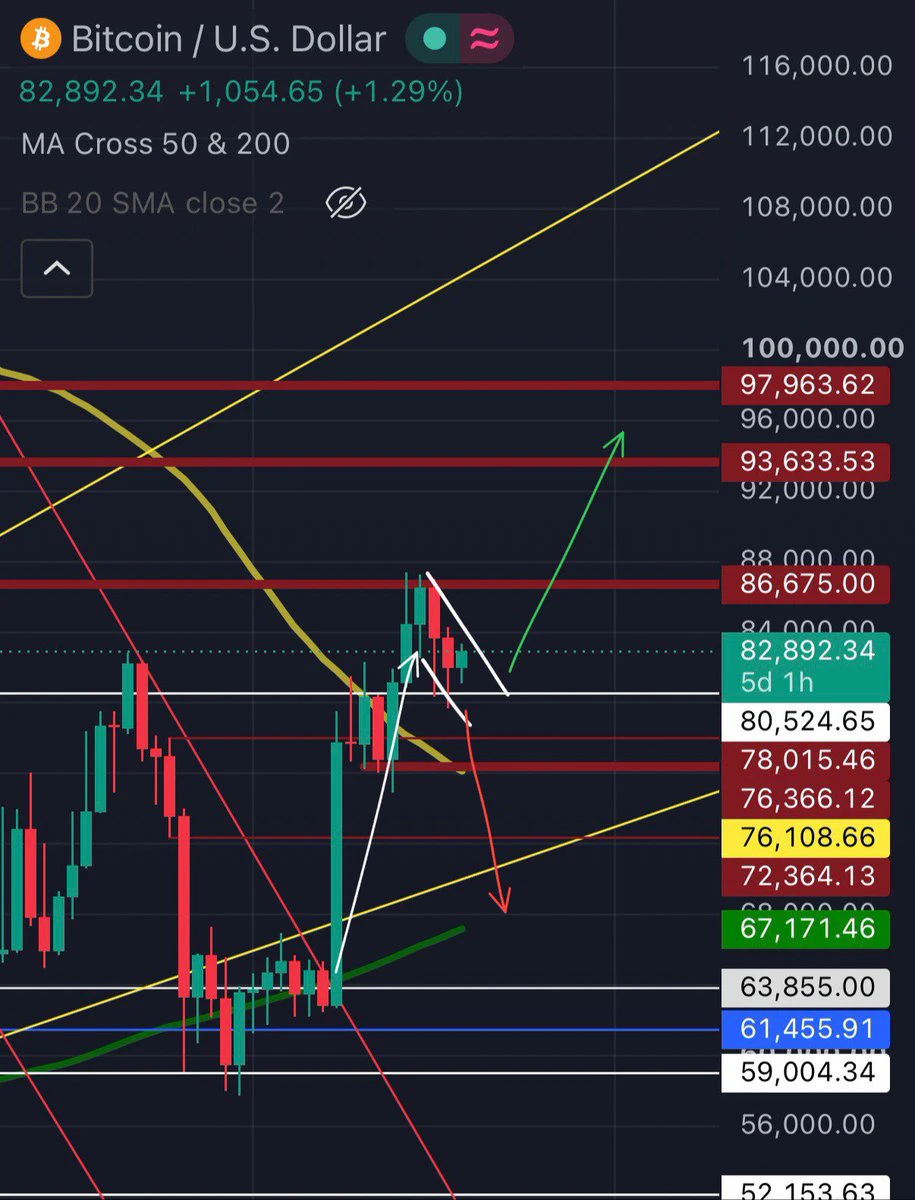
BTC market | Holding key support, awaiting CPI guidance
Current price 77950, with a slight rebound from the lows and range-bound trading.
Nonfarm payrolls-driven rate hike expectations are weighing on the market, while funds await inflation data.
The 4-hour MACD remains generally weak, with the green bars contracting and a golden cross imminent.
Resistance: 79000‑79300
Support: 77500‑77800
A break below support will open up further down
post-image
BTC-0.32%
ETH-0.56%
Your likes will have a blue heart effect today 🩵. If you don't believe me, try it in my comments 👇 #AppleEvent
post-image
A Brief Analysis of BTC Short-Term Trends from Dow Theory, Chan Theory, Elliott Wave Theory, Volume-Price Relationships, Order Flow, and Price Action
I. Dow Theory
Primary trend (1-hour timeframe): The primary downtrend from the historical high of 82,814 on May 6 confirmed a trend reversal in mid-August. The price began a strong rebound from the August 14 low of 62,488. After forming a secondary bottom at 63,979 at 03:00 on August 18, the bulls launched an epic rally. From 63,979, the price surged to the August 28 high of 81,346.95, setting a new near-term high, for a cumulative gain of 17,368
BTC-0.29%
Tia 12h low sweep and pump imo
$TIA
post-image
TIA-6.00%
  • 2
Brother Tong’s 9.10 BTC strategy
$BTC 787-792: enter shorts around this range, stop-loss at 797, first target 775, second target 765.
Current price: 78032. Buyers catching the dip does not mean a reversal is coming. If it were truly strong, it should have reclaimed 80,000 with a single bullish candle instead of dawdling around 780. This kind of hesitant rebound is simply giving shorts a window to re-enter.
787-792 is the platform that broke down yesterday. Once it breaks and then returns, its nature changes—the former support has now become resistance.
So don’t chase shorts here; wait for a bo
post-image
BTC-0.32%
#原油##CL!# rose to 96.1. Can it rise further? The second image shares my view. 【Iran has a total of 170 oil tankers, 8 of which have already been destroyed by the US military. Every time Iran strikes the US military, the US military destroys 3 tankers. Iran can strike the US military 53 more times. Every strike pushes crude oil up a little.】 $CL
CL+1.03%
Political events: The U.S. election, the Brexit referendum, the probability of legislation passing a vote, and similar events are often difficult for traditional polls to predict accurately. Through its pricing mechanism, prediction markets can often provide more timely indicators that are closer to the actual probabilities.
post-image
☀️ GM! Tonight’s PPI will “take the market’s temperature” 🌡️
❄️ Cool down? 🔥 Heat up? Or just right? BTC and ETH are already waiting on the sidelines for the result
👇 How do you think the market will move tonight?
💬 Come chat on Gate Square: https://www.gate.com/post
BTC-0.29%
ETH-0.55%
A Brief Analysis of BTC Short-Term Trend from Dow Theory, Chan Theory, Wave Theory, Volume-Price Relationship, Order Flow, and Price Action (Strategy Recommendations)
Comprehensive Assessment
Dow Theory confirms that the primary trend remains strongly bullish, but the consecutive declines from September 7 to 9 completely broke the bullish structure that had been in place since September 3, successively falling below the round-number levels of 80,000 and 78,000. The sharp rise followed by a pullback on September 9 showed heavy resistance at 79,500-79,700, while the slight rebound on September
BTC-0.29%
$ZEC I’m bullish, but not because of negative funding rates.
$ZEC I’m bullish on this move, but not because “negative funding rates will trigger a short squeeze”—we backtested that thesis ourselves, and it doesn’t hold.
What’s really worth watching is these three figures lining up: funding rates turning negative across all platforms (-0.038% to -0.1321%), perpetuals trading at a 0.033% discount to spot, while the 7-day figure is already up +56%, reaching 99.3% of the 30-day range.
A leveraged-driven move doesn’t grow like this. A long frenzy should mean funding rates surging positive and perpe
ZEC+5.72%
On Wednesday, gold’s daily chart formed a large bullish candle, directly reversing the previous weak pattern of consecutive declines and turning stronger accordingly. However, note that the candlesticks are still trading below the Bollinger middle band. Even though the chart has strengthened, the upward momentum remains relatively limited. Today, continue to focus on whether the 4450 level of resistance holds!
On the 4-hour timeframe, the pattern is even more clearly range-bound, with the Bollinger Bands narrowing and the moving averages converging and intertwining. The current effective range
post-image
GT-0.30%
XAUUSD+0.29%
What truly sets people apart is whether you have the ability to access a broader world of information and then form your own judgment. $PI
post-image
PI-2.06%
#GateLaunchesTrenchesWith0GasFee
🔥 I’m Not Looking at TRENCHES as Just Another Gate Launch
#GateLaunchesTrenchesWith0Gas
Most crypto users look at a new feature and immediately ask one question:
“What can I earn from it?”
I look at it differently:
What opportunity does it create, how easy is it to access, and does it reduce the friction that normally stops users from participating?
That is exactly why Gate Trenches with 0 Gas caught my attention.
⛏️ ZERO GAS CHANGES THE EXPERIENCE
Gas fees may look small, but repeated costs can make users think twice before interacting with an on-chain oppor
post-image
Load More

Join 40 M users in our growing community

⚡️ Join 40 M users in the crypto craze discussion

💬 Engage with your favorite top creators

👍 See what interests you