Square
Following
Hot
News
Notifications
Profile
Share your thoughts
placeholder
Article
Bitcoin ETF investors can hedge during Thanksgiving's 40+ hour trading gap
Arca-listed spot Bitcoin ETFs will miss Thursday’s core session. Eligible CME futures can still trade, with Thursday trades submitted for clearing due to clear Friday.
Quick Take
⚠️ Personal market analysis only. NFA — manage risk and DYOR.
Educational content, not investment advice or a recommendation to buy, sell, deposit, or withdraw any asset. No paid promotion or referral/affiliate links.
post-image
BTC-5.94%
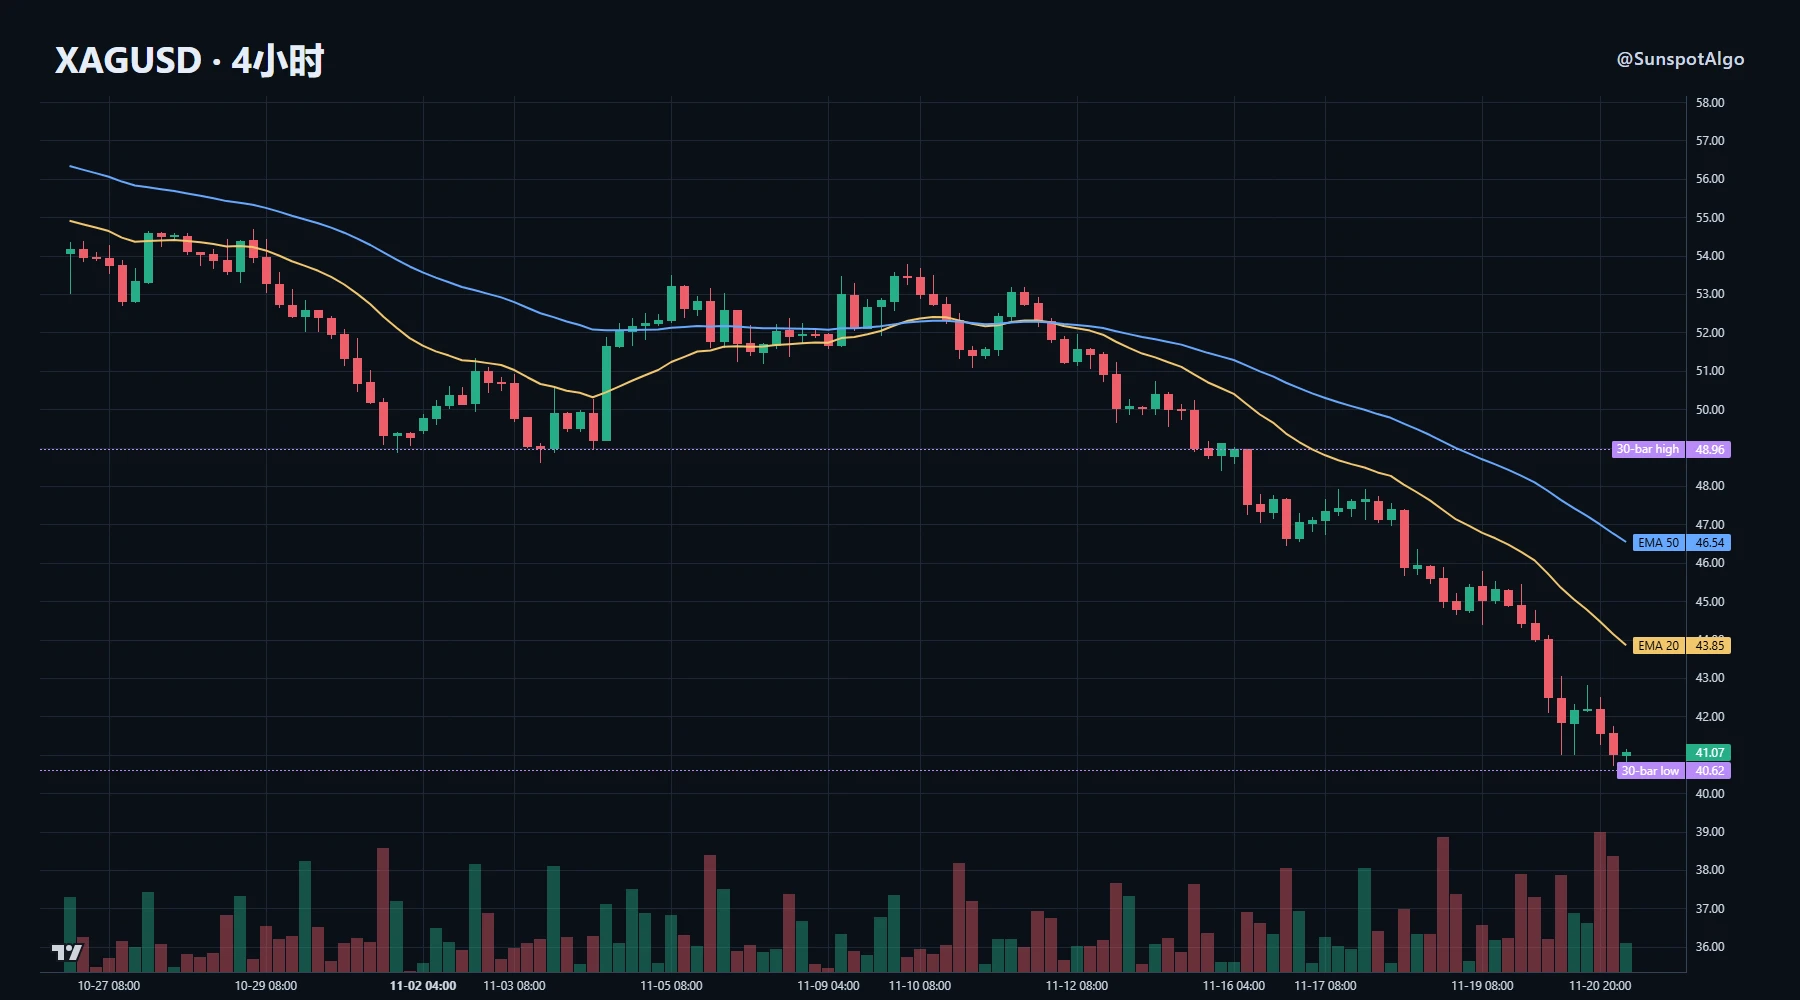
The rhythm of this silver sell-off is more noteworthy than its magnitude.

A roughly 16% drop over 5 days pushed silver to the bottom of its 30-day range at 40.9, while gold fell less than 10% over the same period. The chart’s rhythm has three notable details: the 4H 20-period moving average is at 43.9, while price is at 41.1, a deviation of over 6%; the volume ratio is 1.76, clearly indicating elevated volume; and ATR is at the 92nd percentile of the past 60 candles. The long lower wick around 40.6 was a classic stop-loss sweep: after breaking below that level, price failed to reclaim it, and
post-image
XAG+0.47%
XAU+0.38%
Trenches
IDOL
I
bade
b
IDOL
0x3b...ab07
Market Cap
$.
Change
.
24h Vol
$.
Holders
.
PIEVERSE
P
bade
b
PIEVERSE
0x0e...25a9
Market Cap
$.
Change
.
24h Vol
$.
Holders
.
FIONA
F
bade
b
FIONA
B34n...pump
Market Cap
$.
Change
.
24h Vol
$.
Holders
.
Singularity
S
bade
b
Singularity
7R4M...pump
Market Cap
$.
Change
.
24h Vol
$.
Holders
.
CLAUDIA
C
bade
b
CLAUDIA
2j5S...W2ZM
Market Cap
$.
Change
.
24h Vol
$.
Holders
.
#黄金逼近3500美元关口
Gold at $3,538: The $3,500 Support Battle Could Decide the Next Major Move

Gold is approaching a critical turning point after an aggressive selloff pushed prices toward $3,500. The latest available spot-market quote stands near $3,537.90 per ounce, following a session decline of approximately 2.38%. The metal traded as low as $3,502, bringing the market dangerously close to breaking an important psychological threshold.

What makes this decline particularly significant is that gold is experiencing selling pressure despite broader financial market uncertainty. This reflects a ma
XAU+0.38%
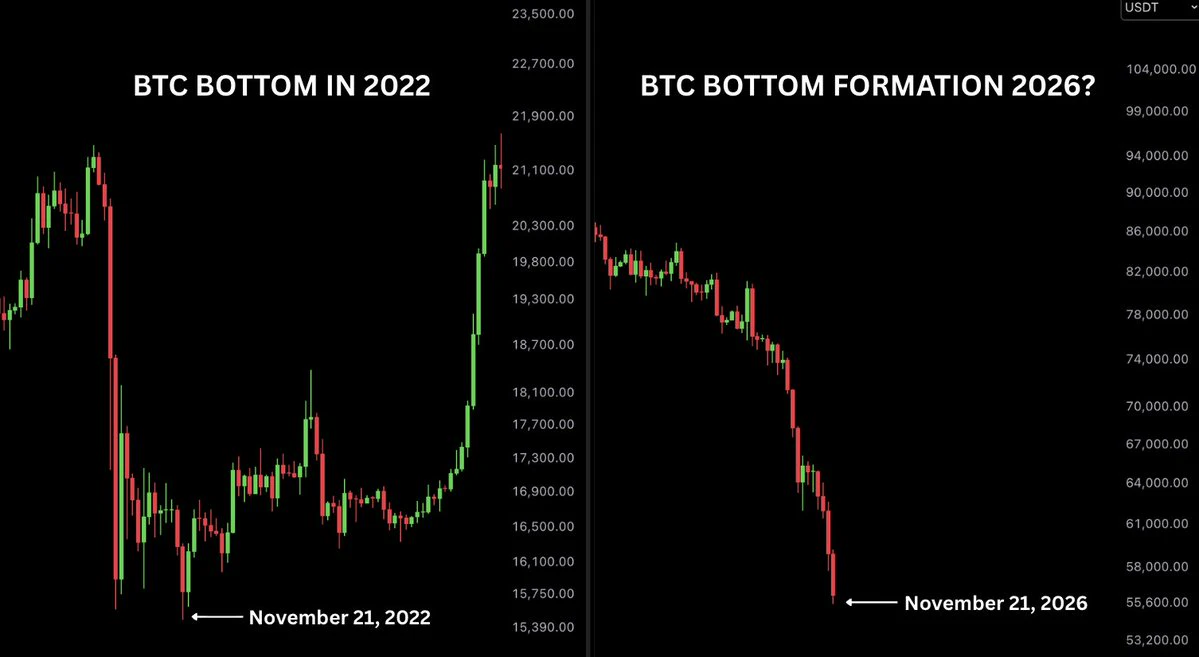
🚨 HISTORY IS GETTING INTERESTING! 👀
Exactly 4 years ago today, Bitcoin formed its cycle bottom.
Fast forward to today, and $BTC has dropped to a new cycle low of $55,150.
Could this be another major turning point for Bitcoin?
What if the bottom is already in and nobody believes it yet? 🚀📈
**Are we witnessing the beginning of the next bull run?** 🔥
post-image
BTC-0.67%
  • 1
  • 1
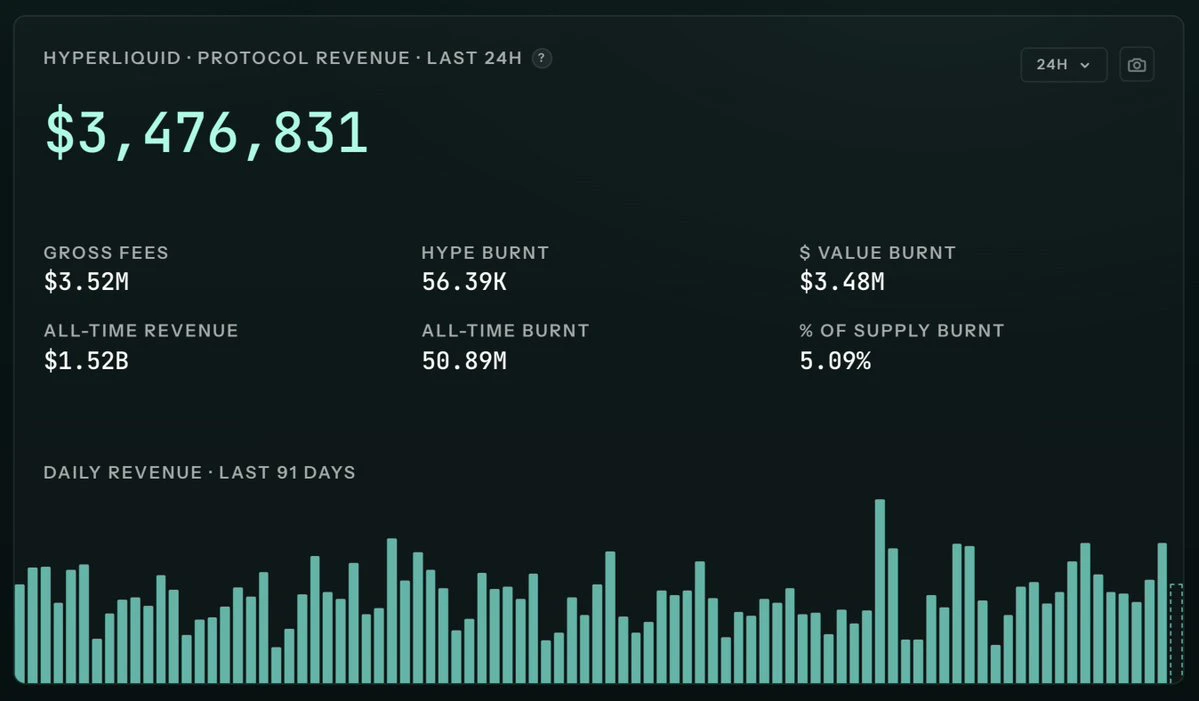
$HYPE is down 40%, but hyperliquid still makes $3M+ a day in revenue
what is zcash doing these days
post-image
HYPE+0.24%
ZEC+1.16%
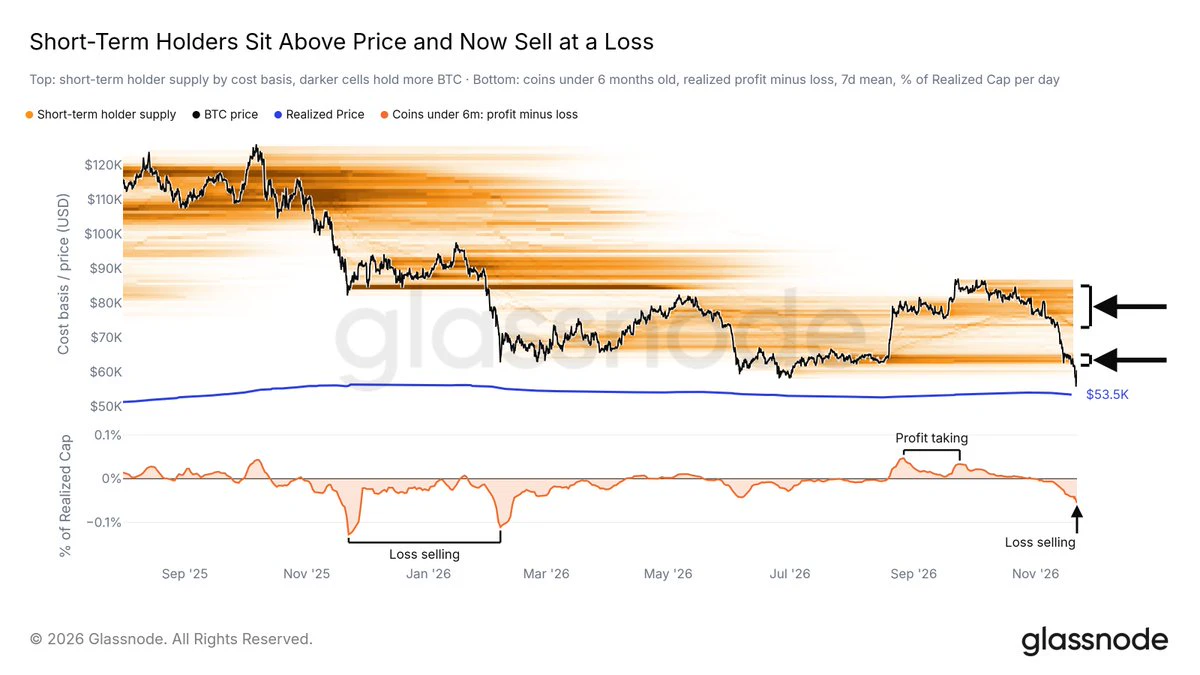
The short-term holder cluster under bitcoin:native has failed to hold.
As price broke below the $62K–$65K block, short-term holders started ramping up their selling at a loss.
Cost basis clusters like this often become resistance once price is below them.
post-image
BTC-0.67%
WEEKEND PREDICTION
live-cover
LIVE2,098
BTC-0.65%
SOL-0.74%
DOGE-0.18%
ZEC+1.29%
XAU+0.38%
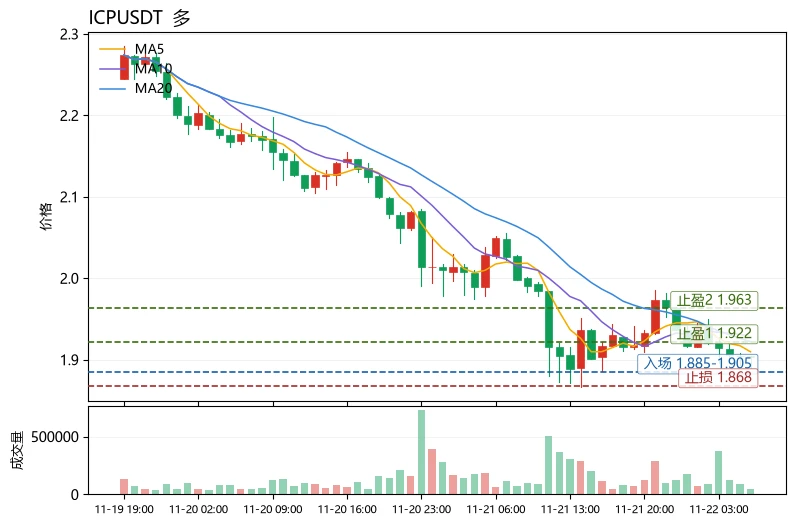
The Extreme Fear Index plunged to 12, yet $ICP fell only 6.26% and the MACD histogram remains positive—this is the most unusual detail in today's market: panic selling is underway, but bearish momentum has not expanded in tandem. Dragged down by BTC's weakness, ICP is now at 1.903, close to the lower Bollinger Band at 1.881. MA5 is below MA20 in a bearish alignment, RSI at 37.8 is nearing oversold territory, and the funding rate of -0.0041% shows shorts are paying to hold positions, indicating elevated crowding. Extreme sentiment combined with a negative funding rate often provides fertile gr
post-image
ICP-1.14%
DOT-1.51%
UNI+3.05%
GT is dropping like crazy, screaming, screaming, screaming aoaoj
post-image
GT-2.41%
  • 1
Everyone, $IDOL is going wild! It surged 79.54% in 24 hours, with strong bullish momentum. Can IDOL sustain this rally, or is a pullback coming soon???
post-image
IDOL-6.71%
Watching for a long opportunity on the 4-hour timeframe for $XRP : the key is whether buyers can hold 0.934 as support. My idea is that the price holds above this level on a pullback; if it loses 0.923, I’ll abandon the trade entirely. Essentially, this is a rebound within a downtrend, so a stop-loss is essential.
The current 4-hour price is at 0.935, still trading below the 0.970 EMA50, making a stop-loss even more important. Let’s do the math: the stop-loss distance is about 1.4%, and the distance to the third target is about 2.2%, giving a risk/reward ratio of roughly 1.6R if the trade goes
post-image
XRP-1.15%
This is the most important thing right now: after the 11/20 close, SK Hynix returned to 106.3 to 106.5, up 2.6% to 2.8%; $SKDD meanwhile fell from 15.56 to 14.56 to 14.80, down 5% to 6.4%.

Whenever the other side bounces, it gives back its gains. The leverage is still 2x, and the same applies in the opposite direction.

Then look at its fundamentals: assets total only $6 million to $8 million, the annual management fee is 2.2%, and average daily trading volume is 4.45 million shares. It’s a very small fund, so gaps and severe slippage are common.

During the early morning hours, the underlyi
post-image
SKDD-1.02%
BTC-0.65%
  • 1
For more than a month now, we’ve been witnessing history every day. It really leaves you wanting to cry, with nothing you can do about it.
The Nasdaq 100 $QQ peaked on 10/6. Since then, this past month has been packed with nothing but epic trading days.

From 10/6 to 10/16, $SOX fell for 9 consecutive trading days, dropping a total of 16.3% and tying its longest losing streak since listing.

On 10/29, $GOOGL plunged 12.64%, its biggest single-day drop since listing in 2004, wiping out around $500 billion in a single day.
On 10/30, INTC tumbled 28.58%, its worst day at least since 1980.
On 1
post-image
GOOGL+0.11%
Goizzzzzz $IDOL All take-profit targets have been successfully hit, securing a huge victory 🥳🥳🥳🥳🥳🥳🥳 Making history! Every target has been successfully hit. • TP1: 0.028 ✅• TP2: 0.030 ✅• TP3: 0.032 ✅• TP4: 0.034 ✅Congratulations to everyone who caught this move! 🥂 From the initial entry to TP4, the entire move unfolded perfectly according to plan. You believed in the plan, and it paid off. Missed the whole move? Don’t worry. The next move is here: Final push: 0.045 🧲• Entry: 0.0330 – 0.0345 (current range / slight pullback)• Target: 0.045• Stop-loss: 0.0290 (protect profits)Execution
post-image
IDOL-6.71%
I’m long $VVV . Trade parameters: Entry: 23.432 - 23.959 Target 1: 25.025 Target 2: 26.089 Exit: 22.495 VVV has temporarily pulled back at MA25 support; it’s time to add to the position again, kick off a new rally, and challenge the highs. Trade here with me. My list today includes
‍$NAORIS and $ETH .
post-image
VVV+0.37%
NAORIS+0.66%
  • 1
Damn, it moves like a Pixiu
post-image
$NVDAB 131.05, 24H +1.61%. The 1h chart looks relatively strong, but RSI at 69 is nearing overbought territory. Volume is only 0.21x the average, and price has yet to break above the 131.5 resistance. I’m watching this level closely: I’ll only consider higher prices if it holds above 131.5; a break below 127.4 would turn the short-term outlook bearish. Short-term momentum is still settling, so I’m mostly waiting for a clear direction before acting. I’ll watch the chart and decide. Keep monitoring. No need to rush. Not investment advice
#NVDAB
post-image
Nvidia intetim ceo colltte kres faces a ......
live-cover
LIVE52
ETH-1.26%
BTC-0.67%
SOL-0.77%
USDC+0.01%
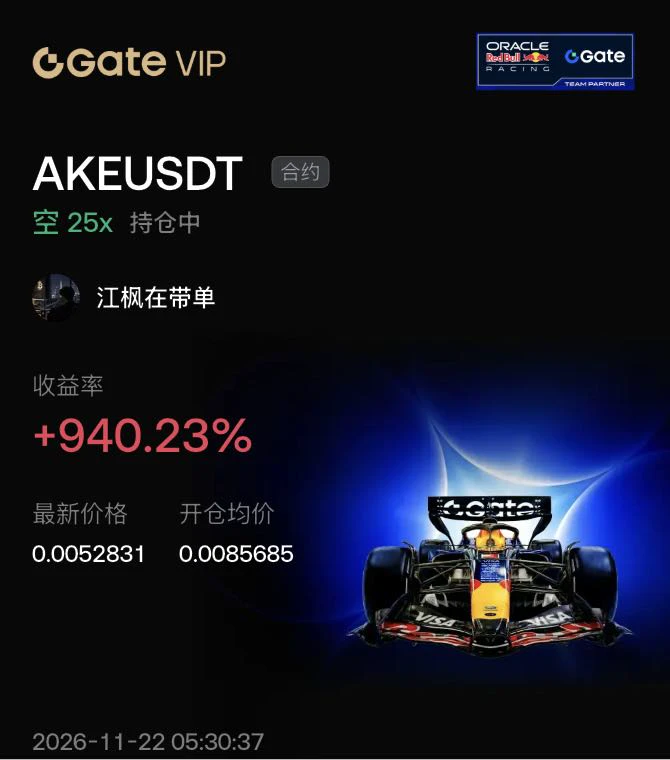
$AKE Unlike other coins, its supply keeps increasing.

Just over 20% of the total supply is circulating. About 2.1 billion tokens are released on the 21st of every month, roughly 10% of the circulating supply. The batch for November 21 has already been released, and another similar-sized batch will come on December 21. This will continue until 2029.

The price is driven by capital, but the number of tokens keeps growing every month. Without a steady influx of new buyers, every unlock is a supply shock.

After this batch was released, the price bounced and then fell, showing that buying demand
post-image
AKE+6.39%
SNDK-0.18%
ETH-1.23%
  • 1
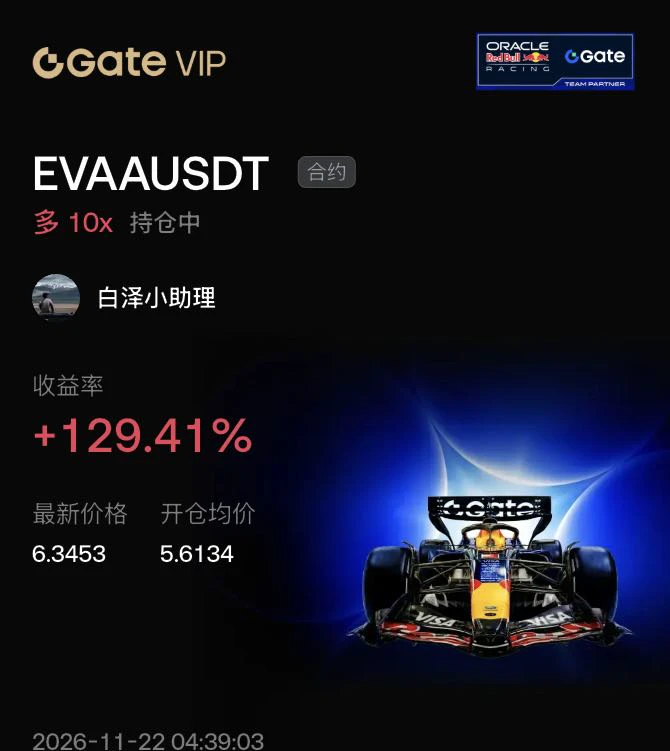
This is the key thing to pay attention to. $EVAA

Deposits in the protocol are about $6.69 million, down 20.9% over 30 days; active borrowing is about $3.47 million. The peak on January 31 this year was $84.3 million, and now only about 8% of that remains.

The price is up 10x, but deposits are down 20%. Market cap is about 30 times deposits.

Some promote it as having "300k wallets and $1.4 billion in cumulative trading volume," but independent data shows only $6.69 million on deposit.

The token also has limited utility: the current claims are discounted fees and boosted yields, while cards
post-image
EVAA-0.42%
ETH-1.23%
  • 1
Load More

Join 40 M users in our growing community

⚡️ Join 40 M users in the crypto craze discussion

💬 Engage with your favorite top creators

👍 See what interests you

Trending Topics

BTCBreaksBelow60K

2.1M Views30K Discussing

BTC fell below $60,000 on November 20 for the first time since July, alongside a tech stock selloff and broader pressure on risk assets. Will $60K become resistance, or can BTC quickly reclaim it? What price or volume signals would convince you that selling pressure is easing?

GateDirectIPOPhase3ANTAllocates92100Shares

794.1K Views4.9K Discussing

NvidiaDropsNearly14Percent

332.6K Views7.6K Discussing

View More