



Square
Following
Hot
News
Notifications
Profile
Share your thoughts
placeholder
Article
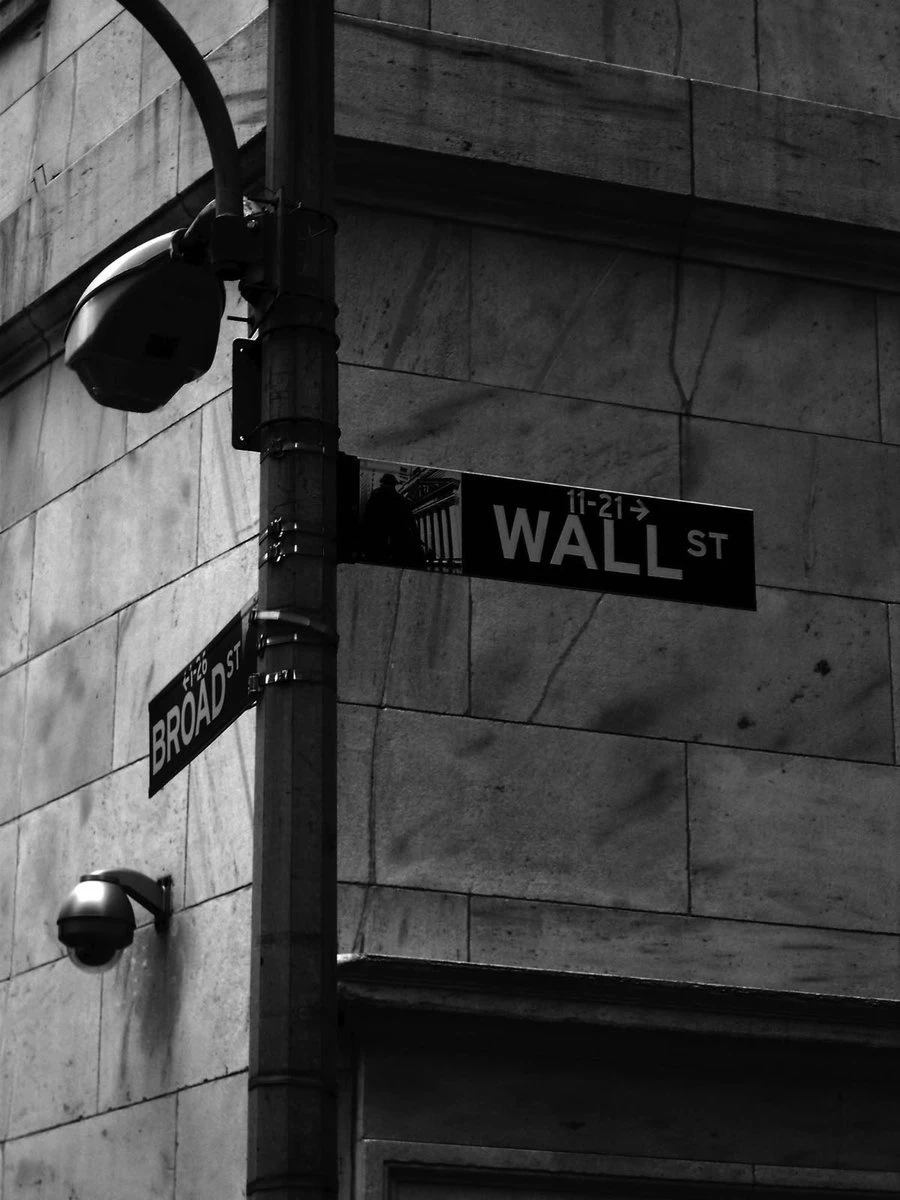
can you imagine the sentiment on Wall Street rn? S&P 500 down 9% this week and these guys are literally losing billions. crypto liquidations are nothing in comparison, just a drop in the ocean
post-image
US500-2.99%
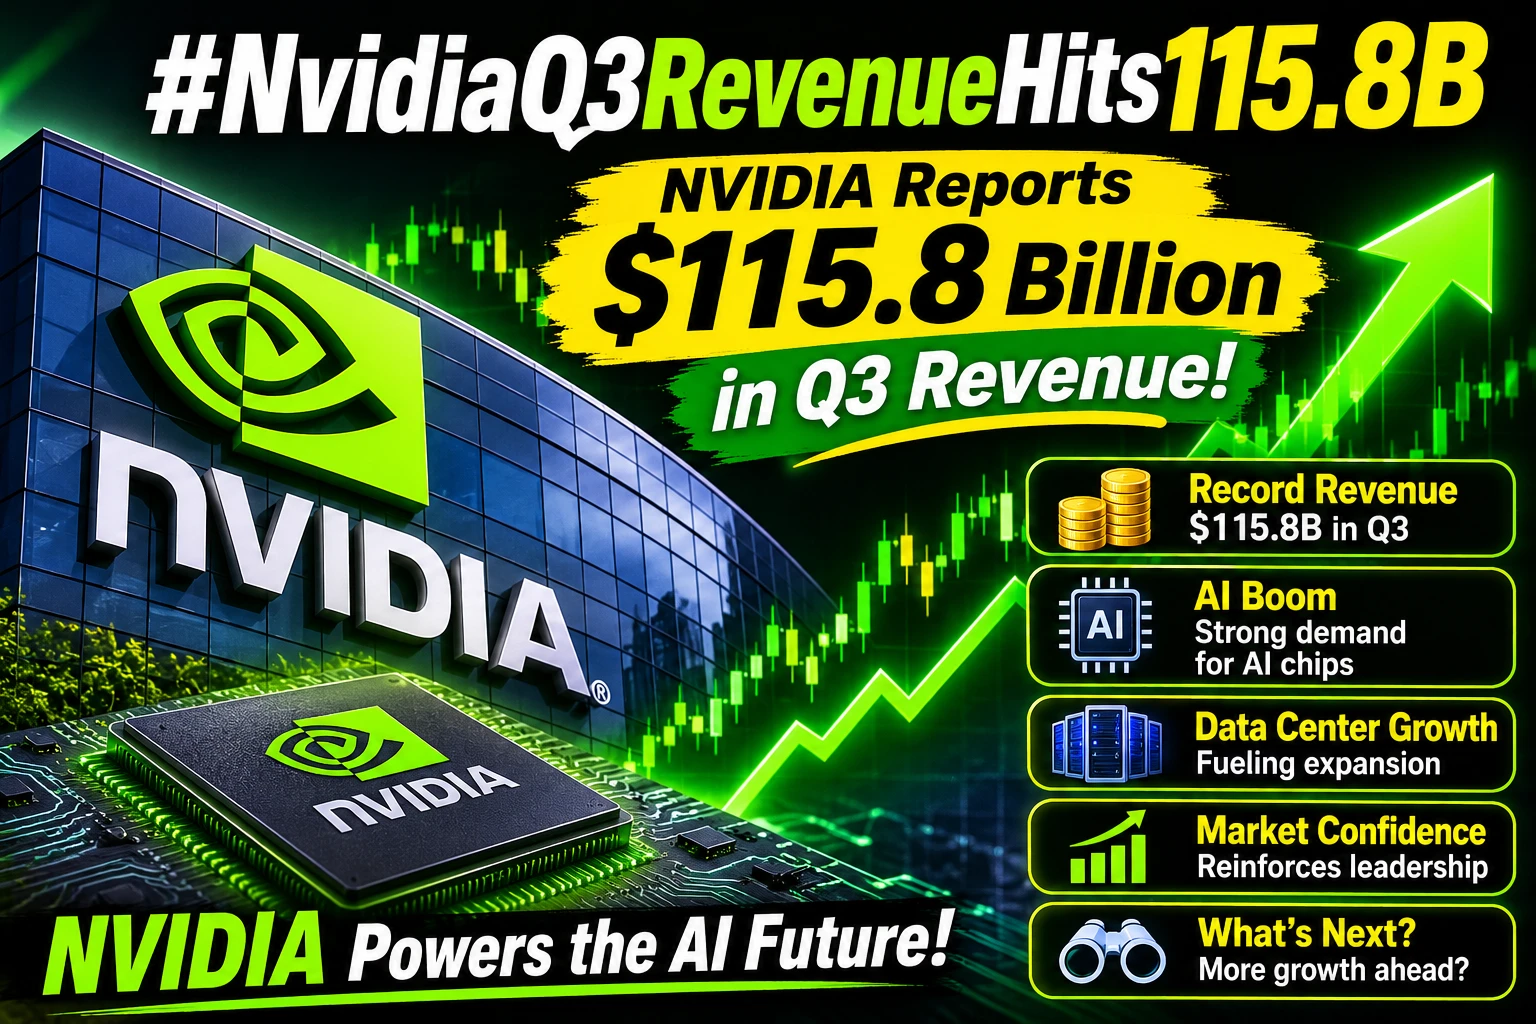
🚀 #NvidiaQ3RevenueHits115.8B
NVIDIA delivers another powerful quarter, with revenue reaching $115.8 billion, highlighting continued strong demand for AI chips and data center infrastructure.
💰 Record Revenue: NVIDIA reports $115.8 billion in quarterly revenue, showcasing massive growth.
🤖 AI Boom: Growing AI demand continues to drive NVIDIA's business expansion.
🖥️ Data Center Growth: AI infrastructure remains a major revenue engine for the company.
📈 Market Confidence: Strong earnings reinforce NVIDIA's position as a leading AI technology powerhouse.
🔥 What's Next? Investors are watchin
post-image
NVDA-13.84%
  • 13
Trenches
FIONA
F
bade
b
FIONA
B34n...pump
Market Cap
$.
Change
.
24h Vol
$.
Holders
.
PIEVERSE
P
bade
b
PIEVERSE
0x0e...25a9
Market Cap
$.
Change
.
24h Vol
$.
Holders
.
mihao
m
bade
b
mihao
4Cxj...pump
Market Cap
$.
Change
.
24h Vol
$.
Holders
.
PROS
P
bade
b
PROS
0x8b...9832
Market Cap
$.
Change
.
24h Vol
$.
Holders
.
CLAUDIA
C
bade
b
CLAUDIA
2j5S...W2ZM
Market Cap
$.
Change
.
24h Vol
$.
Holders
.
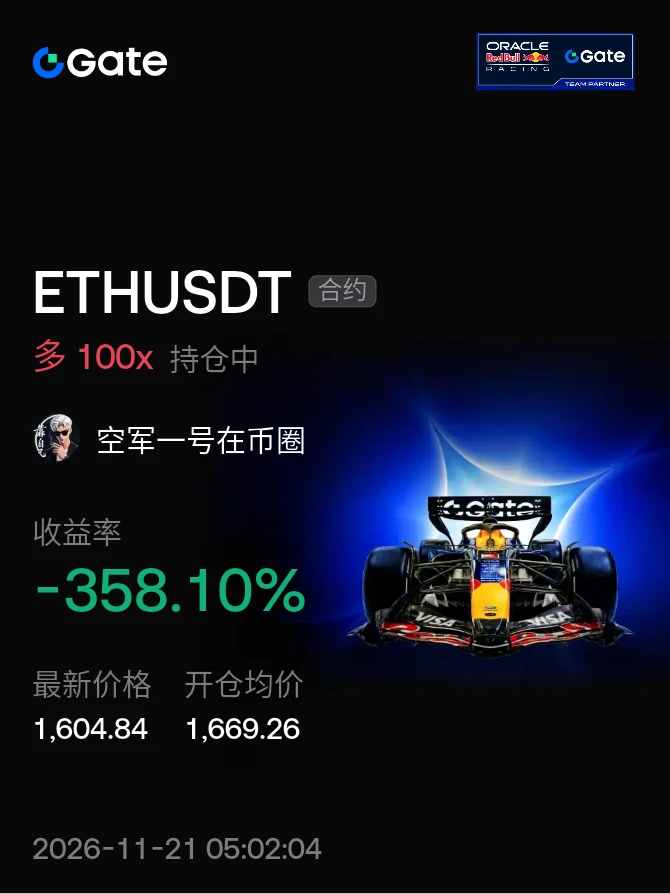
When others panic, I enter, adding to and trimming my position along the way while keeping my liquidation price at $500; the 2022 all-time low was only around 700, and I plan to trim around 1690 and keep adding at 1600. If it doesn’t rally, it won’t move, so I’ll proceed steadily and cautiously, gradually lowering my average entry price—staying alive is what matters most
post-image
ETH-1.23%
  • 2
$OPEN Sellers are in control... next target 0.066557OPEN has continued sliding after retreating from 0.091800. The break below 0.078500, along with a second red candle, indicates sellers are still applying pressure. As long as it stays below 0.078500, the structure remains bearish; a break below 0.075400 could extend the decline to 0.069671. Reclaiming 0.078500 would invalidate this view. The second candle is still forming, so wait for it to close before entering. Will sellers push the price to a new low? Sell and trade $OPEN
$BNB $HYPE
post-image
OPEN-1.04%
BNB-0.76%
HYPE+0.24%
Shitcoin
$NVDA
post-image
NVDA-13.84%
marjet update anyalsis about sol and skyanix
live-cover
LIVE37
ETH-1.26%
BTC-0.67%
SOL-0.77%
DOGE-0.22%
Nvidia’s market capitalization has fallen by more than $2.6 trillion from its peak of $5.8 trillion on October 6, dropping to $3.11 trillion. Having been the world’s most valuable company just a few weeks ago, Nvidia now sits in fourth place globally.

Looking at the current landscape, the top spots have shifted:
Apple leads with $5 trillion.
Microsoft is second with $3.62 trillion.
Alphabet is third with $3.3 trillion.
Nvidia ranks fourth at $3.11 trillion.
Amazon follows closely behind with $2.68 trillion.

So, what lies behind this massive loss in value? In reality, this decline is not driv
post-image
User_any
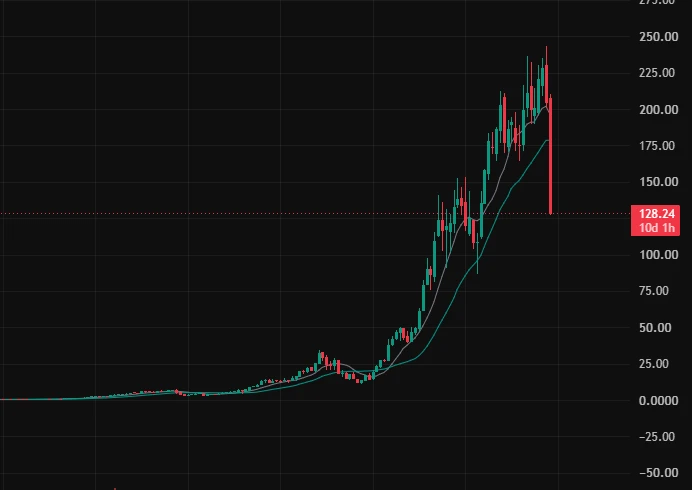
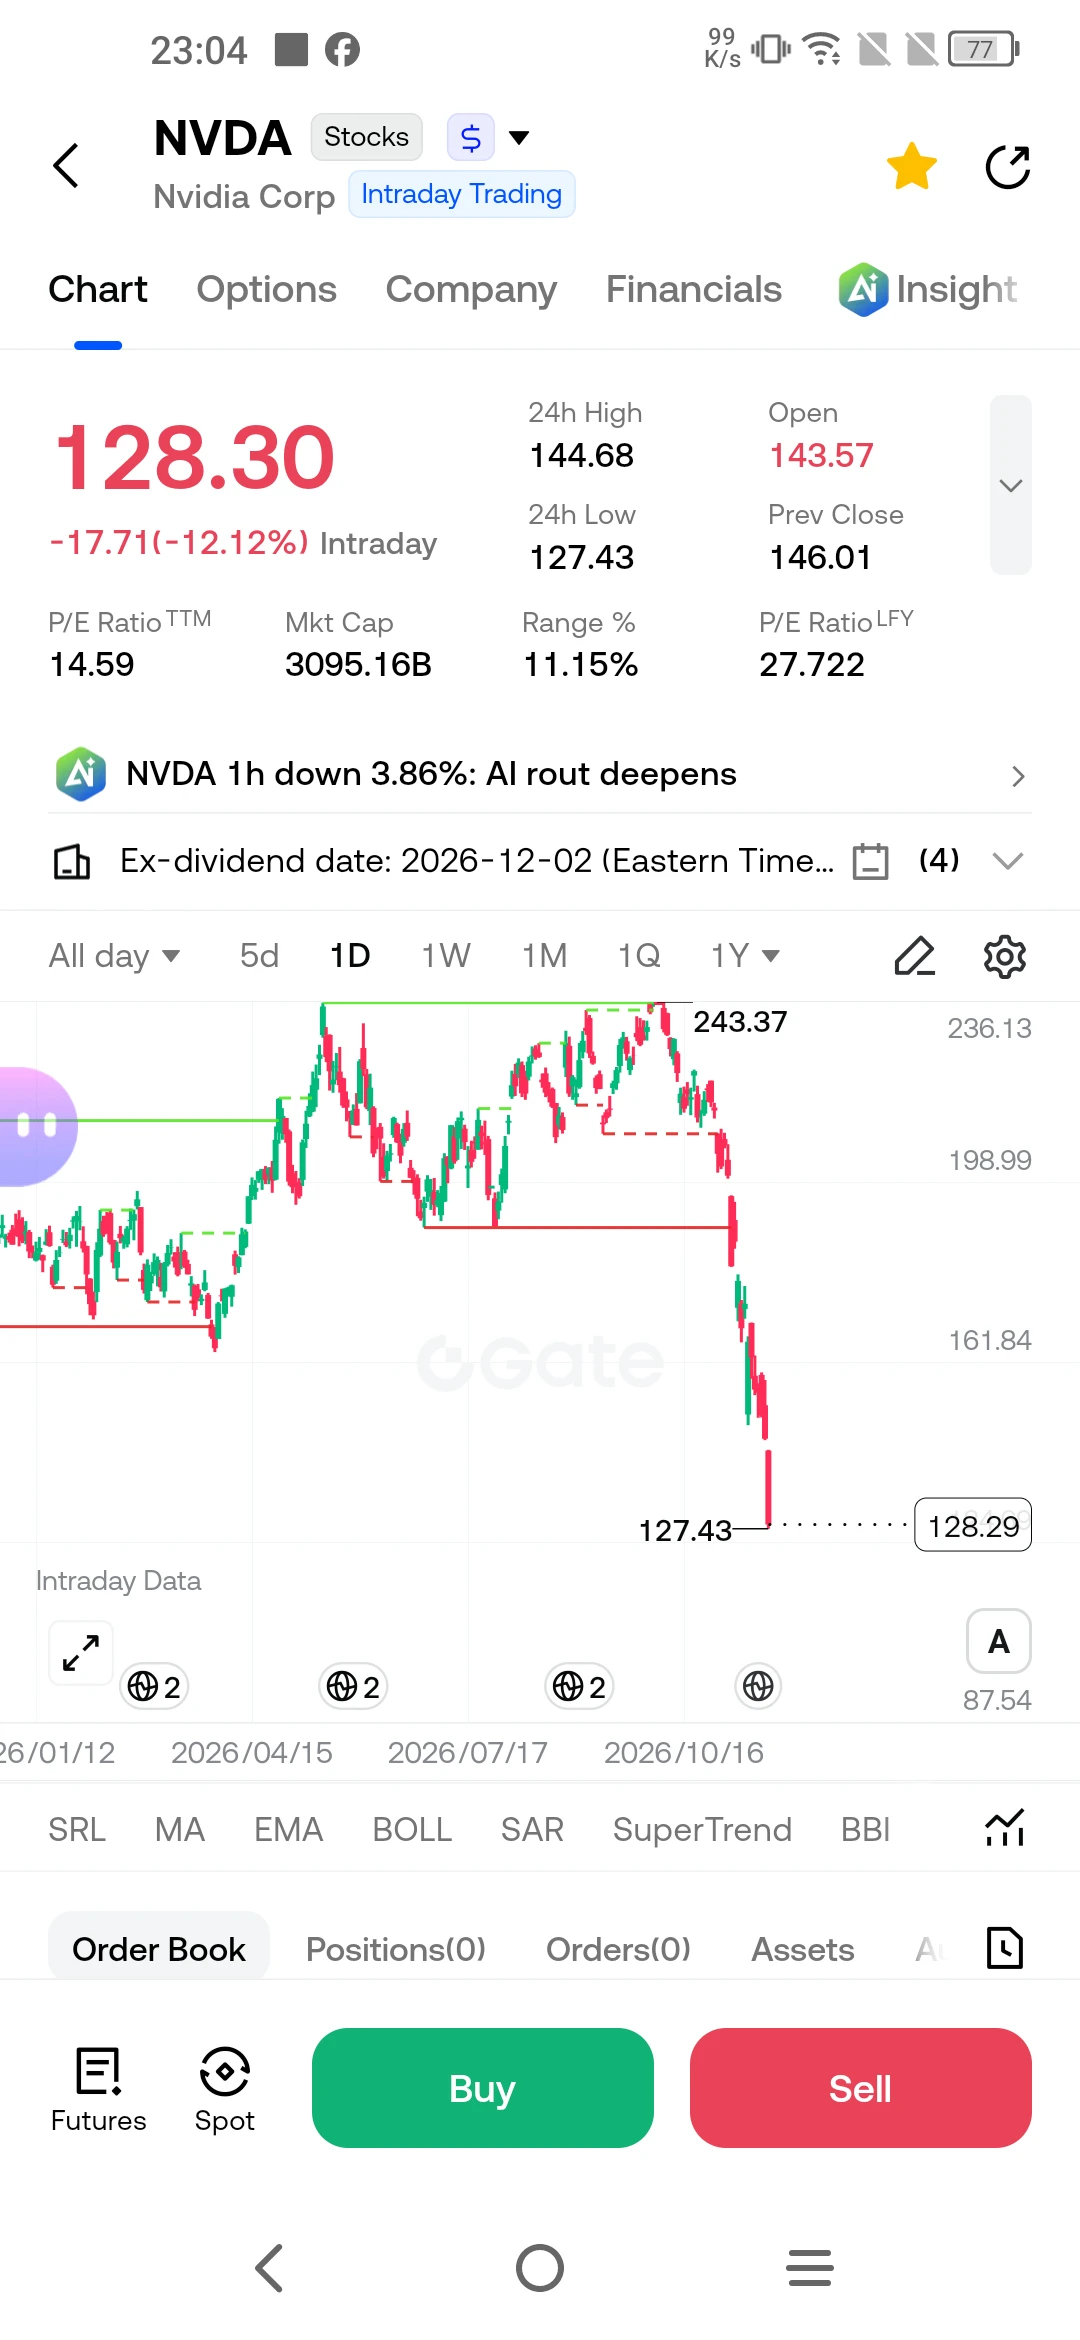
$NVDA On Friday, November 20, 2026, Nvidia shares fell by more than 12% during intraday trading to $128.30—marking the sharpest single-day decline for the company since 2009—as the stock headed toward its seventh consecutive weekly loss. Since reaching a peak of $243.37 in early October, the stock has shed over 44% of its value, erasing approximately $2.5 trillion in global market capitalization. So, what dynamics have brought this once-most-valuable company to such a point?
Three primary factors are driving this decline. The first is macroeconomic pressure: October’s Consumer Price Index (CPI) data in the U.S. came in higher than expected, pushing the probability of a Federal Reserve interest rate hike at the December meeting to over 90%. In a high-interest-rate environment, growth stocks—whose valuations are based on future cash flows—face significant downward pressure. The second factor is a company-specific crisis: the resignation of CEO Jensen Huang on November 12—following allegations regarding his personal conduct and reports concerning overseas operations—triggered a major leadership upheaval. The company remains under further strain amid reports that the U.S. Securities and Exchange Commission (SEC) is investigating potential accounting irregularities. The third factor is a structural reassessment: questions regarding the sustainability of massive expenditures on artificial intelligence infrastructure, combined with intensifying competition from rivals such as Google and AMD, have led the market to reprice the entire "AI narrative." Despite this negative backdrop, Nvidia’s core business performance continues to show strong signals. In documents released on November 17, the company reported a record revenue of $115.8 billion, with a robust fourth-quarter outlook of $130 billion. Interim CEO Colette Kress has set a target of 75% revenue growth for the upcoming fiscal year, signaling that the company remains firmly on track. With its market capitalization trailing behind Apple, Microsoft, and Alphabet, Nvidia is currently trading at a price-to-earnings (P/E) ratio of 9.3x, whereas AMD is priced at 29x earnings. This valuation gap suggests that the market is applying a significant discount to Nvidia’s future—even though its underlying business model remains largely sound.
For individual investors, the takeaway is clear: Nvidia is no longer just a chipmaker; it has become an asset situated at the intersection of a management crisis, macroeconomic tightening, and debates surrounding an "AI bubble." In times like these, the most dangerous approach is to make impulsive moves based on panic or to attempt to dictate one’s strategy based on a single piece of news. Moving forward, the Federal Reserve’s interest rate decisions, the appointment of a new CEO, and the trajectory of the SEC investigation will be the key factors that determine the stock's direction. In this equation, which do you believe carries more weight: the company’s core performance or the uncertainty surrounding its management?
#Nvidia #GateSquare #Macro #TechStocks #ShareWeekly
Not investment advice.
repost-content-media
AAPL-1.83%
AMZN-3.90%
GOOGL-2.50%
MSFT-2.61%
NVDA-13.84%
  • 5
  • 1
The market is really bad 🥲
I'm looking for a wealthy older woman
post-image
The data at hand indicates that the market is at a highly critical psychological threshold. The decline of the Fear and Greed Index to a level of 10 is not merely a "sell" signal; it serves as a mirror reflecting the collective sentiment of all market participants. Let us analyze this situation calmly, in light of the figures and investor behavior.

First, let’s examine the concrete data behind this downturn. As of November 20, 2026, Bitcoin is trading at approximately $58,412, having dipped as low as $57,750 during the day—its lowest level since early July. The decline stands at 15.24% over t
BTC-0.67%
GT-2.41%
ETH-1.26%
XAU+0.38%
NAS100-4.58%
  • 8
  • 2
$BTC
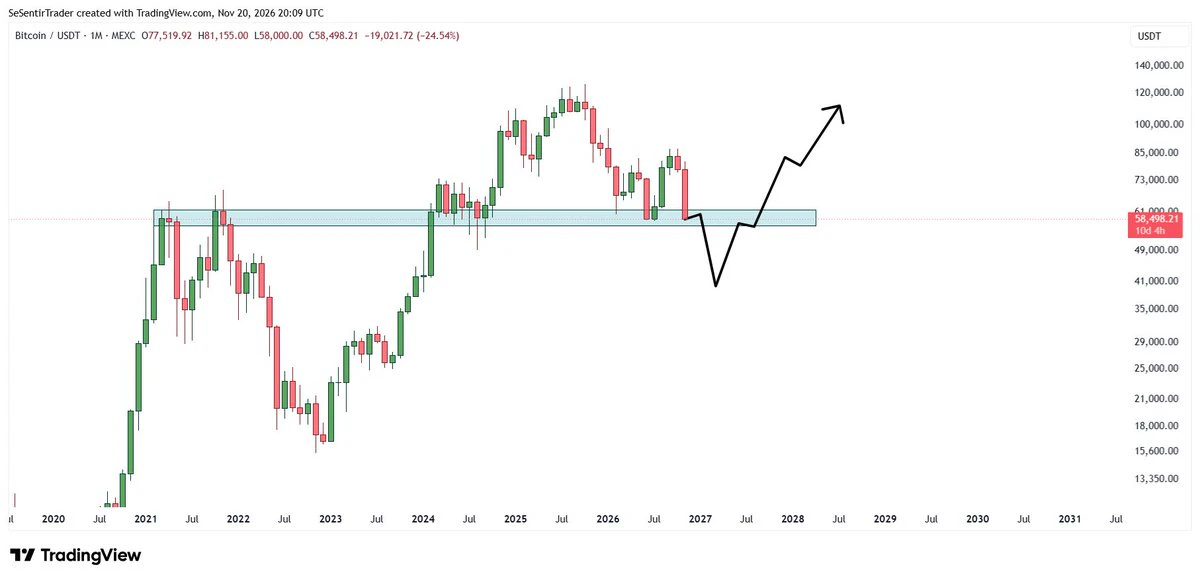
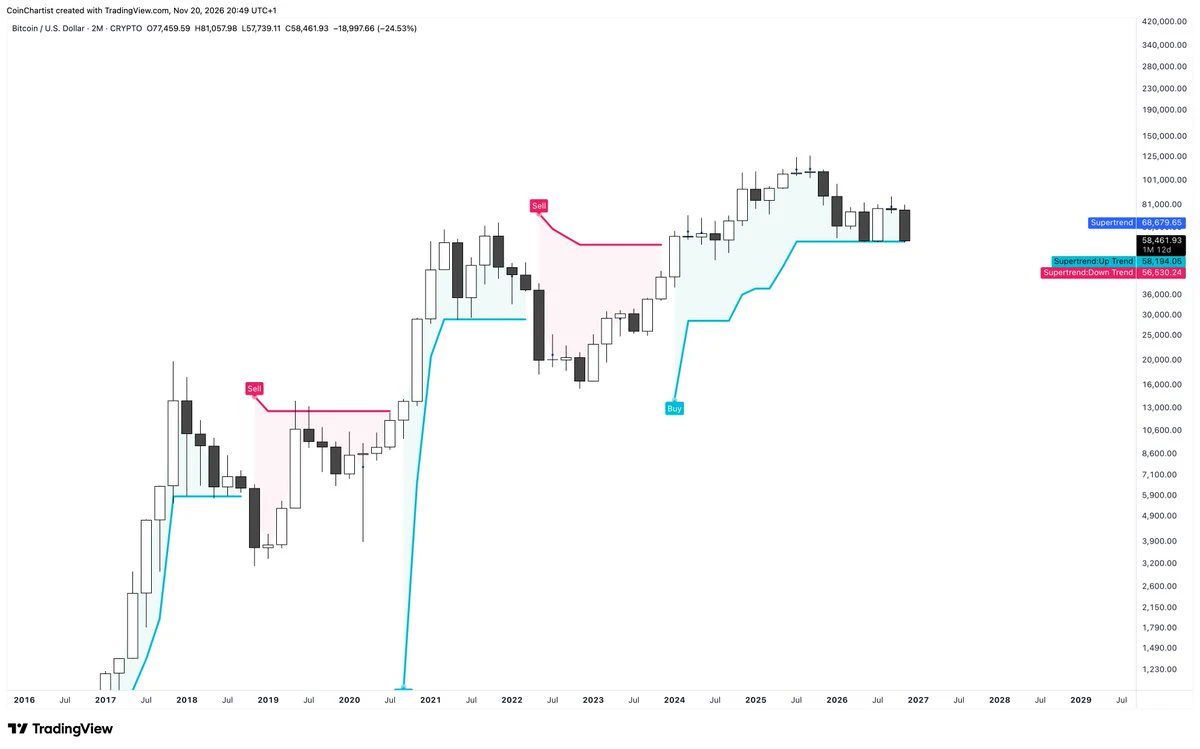
Looking at the monthly chart, this is looking bad for bulls.
We're once again retesting the 60,000$ area, where the 2021 ATH is located.
And the more a support is tested, the more likely it is to break.
However, there is one glimmer of hope.
If Bitcoin ever dips to 40,000$, despite the tears and the pain for holders, it might be one of the greatest opportunities of our lifetime.
Indeed, the crash will be hard and even stressful for holders. But 40,000$ for ONE Bitcoin will be a bargain.
Because at that point, most retail traders will have capitulated.
post-image
BTC-0.67%
[NEW STREAMER]market update
live-cover
LIVE30
TSLA-7.56%
SPCX-7.38%
NVDA-13.84%
ETH-1.26%
USDC+0.01%
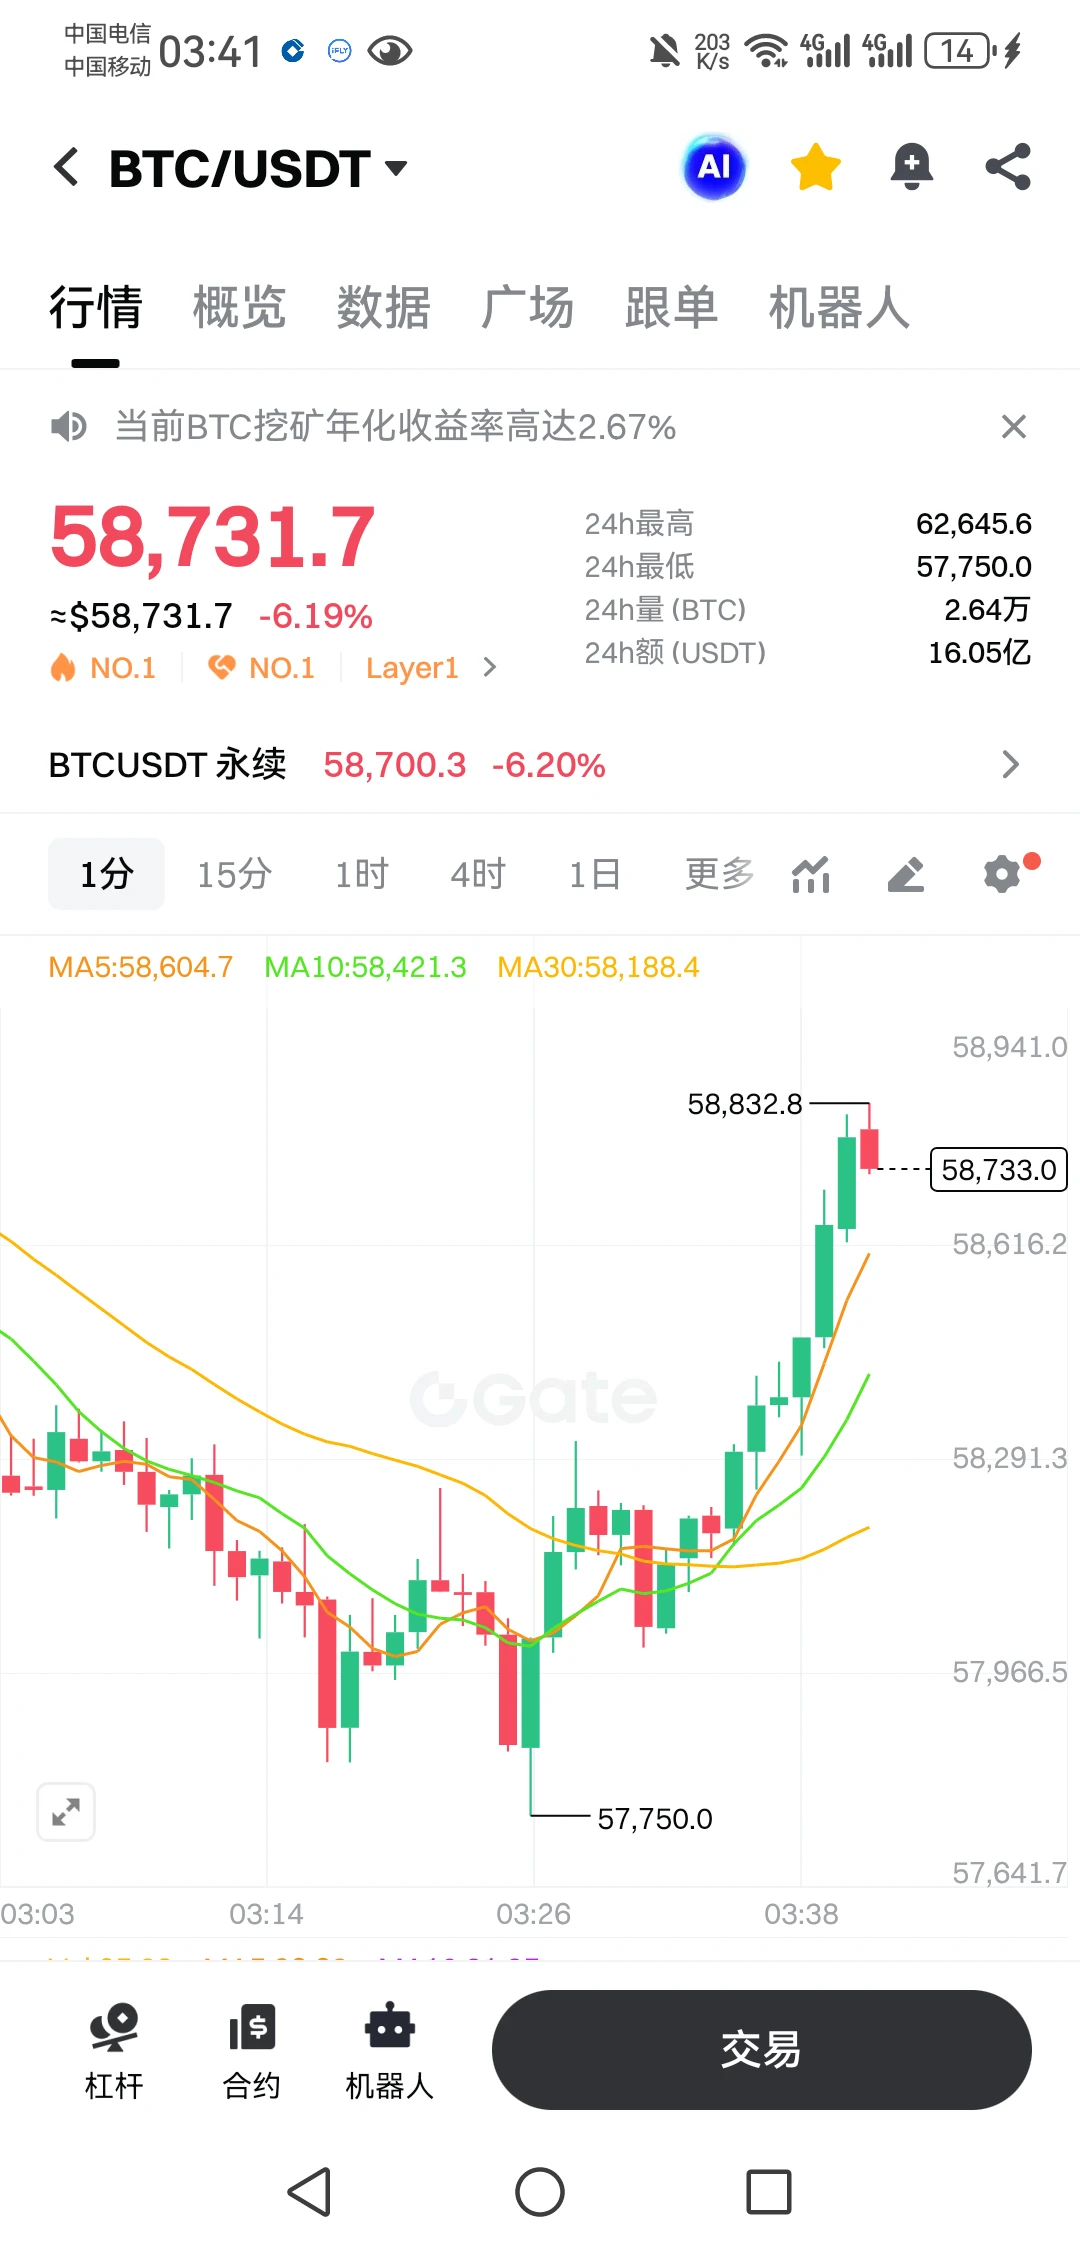
57,750 hits a new low for the first time
post-image
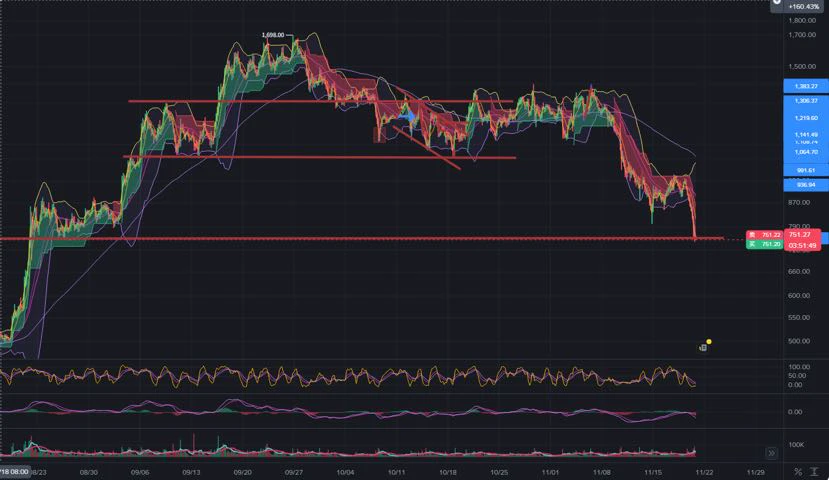
11.21-22 Weekend ZEC Strategy
【Long Strategy】: $ZEC
  Entry range: around 745-760 (if the price does not reach the entry range, execute Plan B)
  Stop-loss: 700
Staggered take-profit levels
  First target: 782
  Second target: 802
Third target: 818
Fourth target: 830

【Market Analysis】: The current price has fallen straight through the lower Bollinger Band, and the channel has opened wide to the downside. Bearish momentum has accelerated sharply, and the market is deeply oversold. A rebound is expected, but selling pressure is extremely strong. The current bearish move
post-image
ZEC+1.29%
it's times like this that you recall when everyone calls you lucky
if you're still around at this point, it's because you deserve to win
survive long enough for it to inevitably materialize
post-image
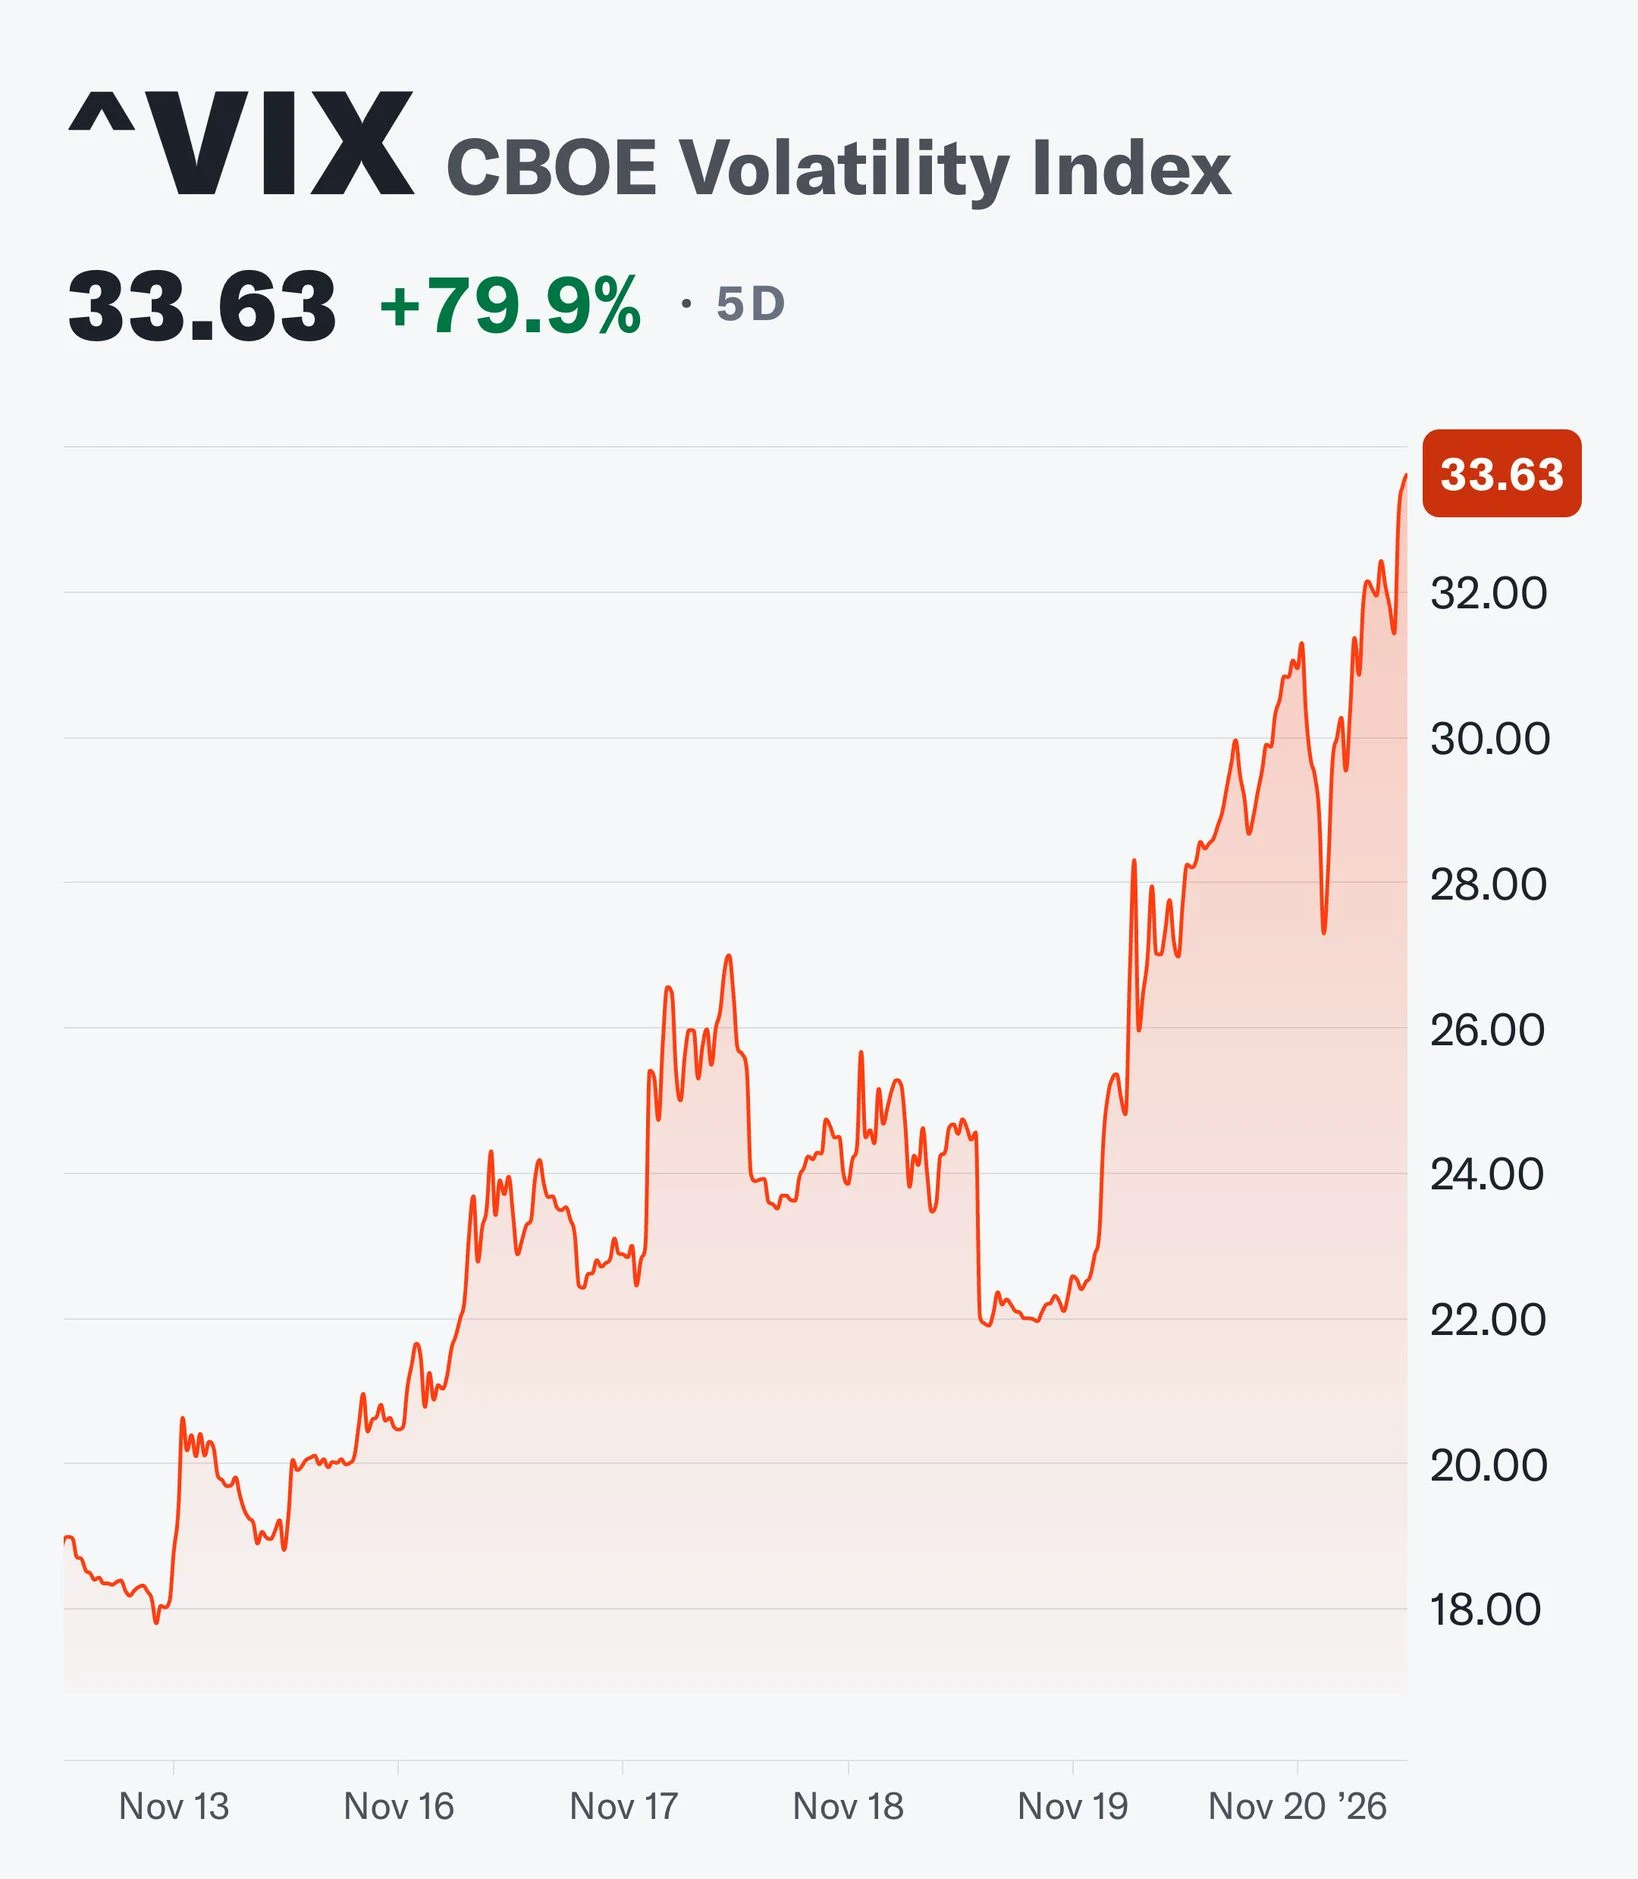
As of November 20, 2026, the "fear index" (VIX) has reached 33.63—a 79.9% surge over the last five days—marking its highest level since March.

Several developments have converged to drive this sharp rise. Foremost among them is a sell-off in artificial intelligence (AI) stocks; Anthropic’s initial public offering (IPO) failed to meet expectations, and broader concerns regarding valuations within the sector have contributed to a decline of over 3% in the Nasdaq. Furthermore, growing expectations that the Federal Reserve will implement an interest rate hike in December, combined with U.S. restr
post-image
User_any
The data at hand indicates that the market is at a highly critical psychological threshold. The decline of the Fear and Greed Index to a level of 10 is not merely a "sell" signal; it serves as a mirror reflecting the collective sentiment of all market participants. Let us analyze this situation calmly, in light of the figures and investor behavior.
First, let’s examine the concrete data behind this downturn. As of November 20, 2026, Bitcoin is trading at approximately $58,412, having dipped as low as $57,750 during the day—its lowest level since early July. The decline stands at 15.24% over the past week and exceeds 31.02% over the past month. Market capitalization has fallen to $1.16 trillion, while trading volume hovers around $1.61 billion. Ethereum is under similar pressure, trading at $1,749, with a weekly loss of 10.8% and a monthly decline of 29%.
The primary catalyst for this decline is the withdrawal of institutional investors. On November 19, U.S. spot Bitcoin ETFs saw a net outflow of $582.3 million. Of this, $541.1 million originated from BlackRock’s IBIT fund—the largest single-day outflow since the fund’s inception. Total outflows for the month of November have reached $3.47 billion. This suggests that institutional demand has effectively come to a halt, or has even begun to reverse.
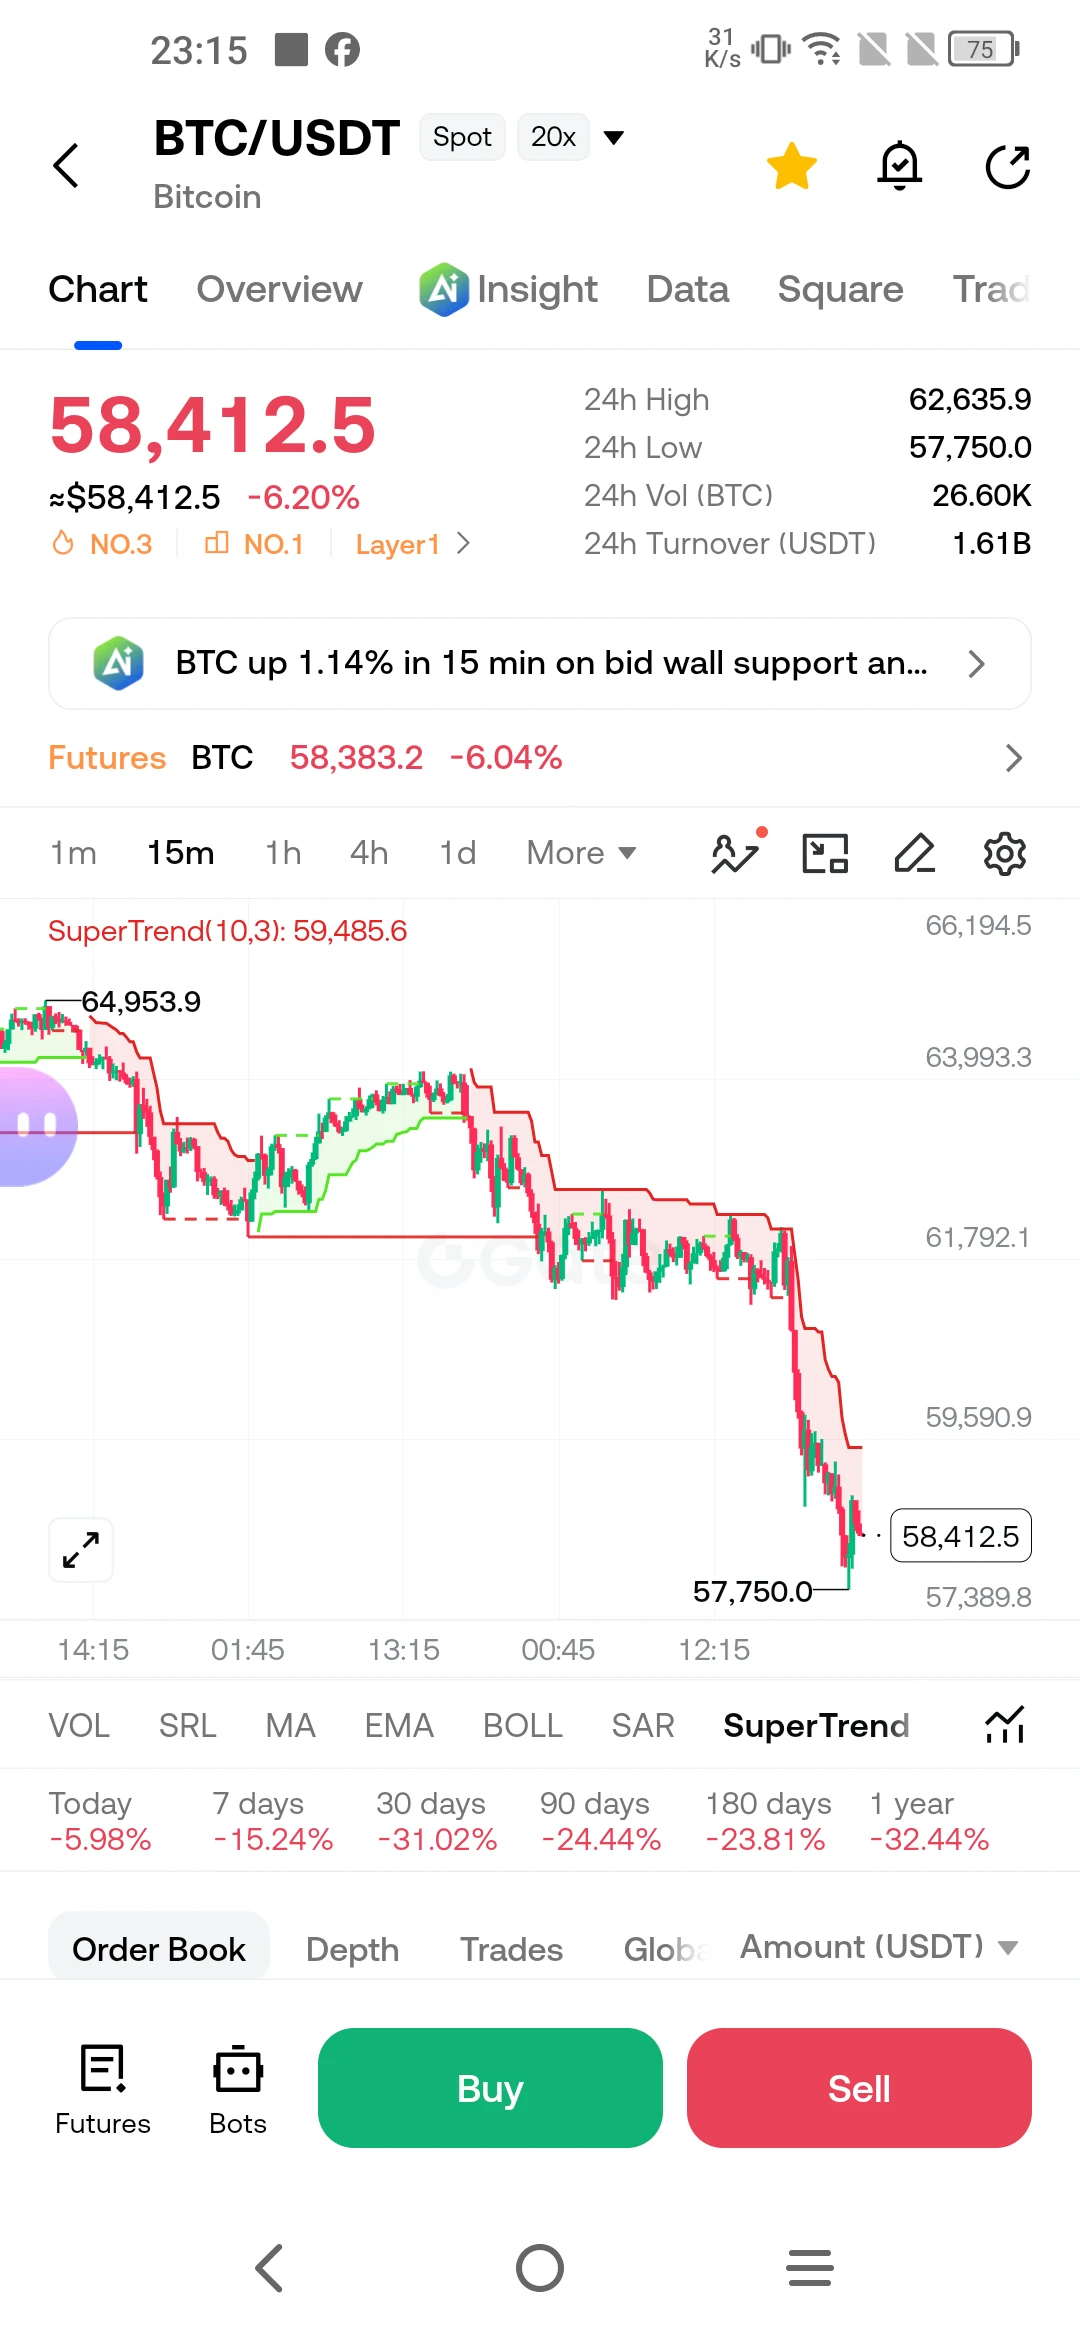
The situation regarding leverage is equally unsettling. Nearly $700 million in liquidations have occurred over the last 24 hours, with $167.21 million coming from Bitcoin long positions. In other words, the market has penalized those betting on an upward move. As shown in the screenshot, Bitcoin has fallen below the SuperTrend indicator ($59,485), presenting a technically weak outlook.
What Does Extreme Fear Signify?
A reading of 10 on the Fear & Greed Index indicates that 90% of investors are gripped by "fear." However, a critical distinction must be made: an index value of 10 does not necessarily mean the price is near a bottom. Historically, periods of extreme fear can persist for months, with each "bottom" potentially followed by an even lower one—much like in 2022, when the fear index remained at low levels for an extended period. Bitcoin is currently experiencing its seventh consecutive weekly decline, marking its second-longest losing streak since 2022.
Yet, there is a "glimmer of hope." According to CryptoQuant data, while 30-day visible demand remains in negative territory at -247,700 BTC, large-scale holders—or "whales"—continue to increase their Bitcoin reserves. This suggests that while some institutional investors are pulling back, major long-term players are quietly accumulating. This divergence could be a signal that the market is laying the groundwork for a bottoming formation, though it is not sufficient on its own.
Why Now?
This decline is not driven solely by dynamics internal to the crypto market. The Federal Reserve’s hawkish stance and higher-than-expected inflation data are dampening the appetite for risk assets. Weakness in technology stocks is directly impacting Bitcoin; the 2.25% decline in the Nasdaq following Anthropic’s IPO, combined with a six-day losing streak for the S&P 500, has rippled through the crypto market.
Rather than panicking in the face of this situation, it is best to focus on three key questions. First: Are you using leverage? If so, your chances of maintaining your position during such waves of liquidation are slim. Second: What is your time horizon? If you are thinking in the short term, staying on the sidelines during periods like this is not an act of cowardice—it is a strategy. Third: Have you defined your price levels? If the price falls below $57,750, the next support zones may be tested; keep this level in mind.
In short, the market is currently gripped by "extreme fear." While this might look attractive to those hunting for opportunities, it also demands caution. When the Fear & Greed Index sits at 10, the smartest course of action is to stick to your plan rather than trying to make predictions.
Do you believe this environment of extreme fear presents an opportunity for long-term accumulation, or does it signal that the market is bracing for a deeper correction?
#FearAndGreed #Macro #MARKET
#WCTCS9 #ShareWeekly
$BTC $GT $ETH $XAU $NAS100
Not investment advice.
repost-content-media
NVDA-13.84%
MU-13.88%
ANT-8.68%
AMD-13.27%
AAPL-1.83%
  • 1
  • 3
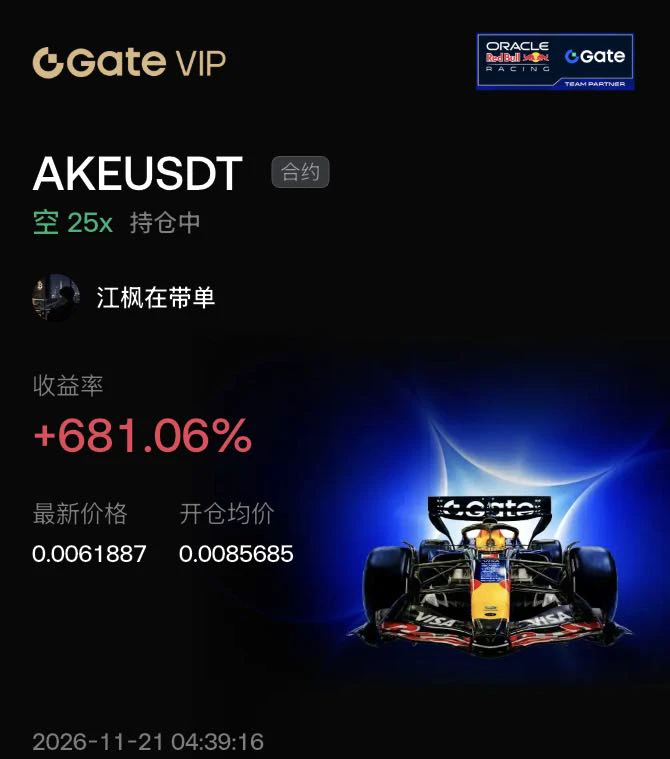
$AKE This time, things went differently from what everyone expected: the tokens were released, the price didn't tank, and instead it climbed.

When the 2.1 billion tokens hit the market around midnight, the price was pulled straight up from just over 0.005 to around 0.0062. The reason is simple: after falling 40% yesterday, most people who wanted to get out had already left. The remaining shorts were crowded into the 0.005 to 0.006 range, so as soon as buying pressure came in, they had to rush to cover.

This is what I've been saying all along: good news being fully priced in marks a top, whil
post-image
AKE+6.39%
EVAA-0.42%
  • 1
We haven't seen the bloodbath yet in bitcoin:native but it is coming
post-image
BTC-0.67%
$SPY $Q
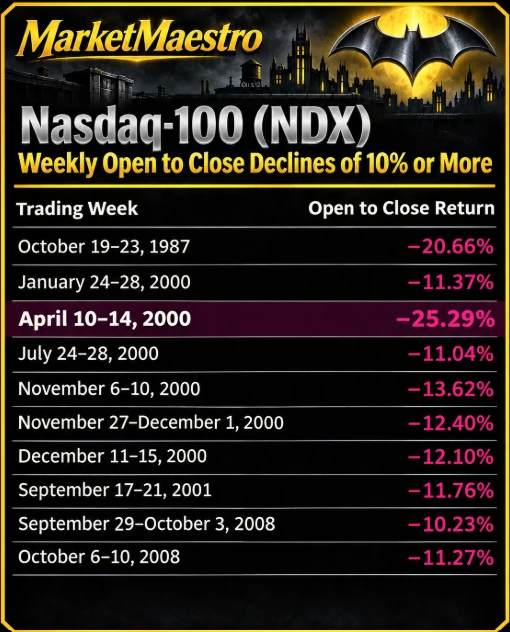
Dates when NDX fell more than 10% in a week like this one
post-image
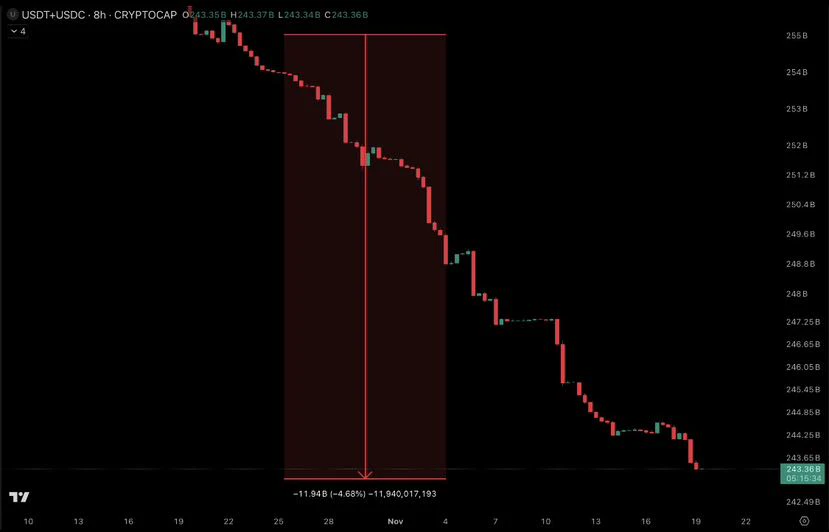
I think people are seriously underestimating what 7 consecutive weeks of stablecoin outflows mean

Everyone is positioning for the next big rally, but liquidity is one of the things we should be watching very closely

No point expecting fireworks when the fuel is running low
post-image
  • 1
  • 2
NVDA has fallen below $130. One might have expected capital flowing out of the artificial intelligence sector to shift into cryptocurrencies, yet Bitcoin is also declining. Nevertheless, I believe these are the final drops. We will see a very sharp rebound from Bitcoin and altcoins backed by blockchain technology $LUNC will be among them. As for the rest, they will be weeded out... We should steer clear of cryptocurrencies that fail to generate any value.

#LUNC #TerraClassic #Bitcoin #FedMayNeedA50bpRateHike $BTC $LUNC ‌ ‌
post-image
LUNC-2.74%
BTC-0.67%
Load More

Join 40 M users in our growing community

⚡️ Join 40 M users in the crypto craze discussion

💬 Engage with your favorite top creators

👍 See what interests you

Trending Topics

GateDirectIPOPhase3ANTAllocates92100Shares

699K Views4.7K Discussing

The allocation results for Gate Direct IPO Phase 3 — Anthropic (ANT) — have been announced, with a total of 92,100 $ANT shares allocated. Successful participants can check their accounts and review their subscription results. Did you secure an allocation this time? Share your subscription experience and allocation result on Gate Square!

USNOVJoblessClaimsBeatExpectations

185.6K Views1.5K Discussing

FedMayNeedA50bpRateHike

427.5K Views3.4K Discussing

View More