Share your thoughts
placeholder
Article
Everyone’s staring at TRUMP’s 2.322—but the 4h chart is quietly building a trapdoor.

$TRUMP /USDT - SHORT

Trade Plan:
Entry: 2.315 – 2.329
SL: 2.388
TP1: 2.272
TP2: 2.239
TP3: 2.190

Why this setup?
Why now?
- 1D range + 4h SHORT bias = mean reversion, not breakout.
- RSI 15m at 50.82 = no momentum fuel; price is stalling mid-range.
- ATR 1h (0.0275) shows thin volatility—easy to slap down to TP1 (2.272) before news hits.
- Entry 2.322 with SL 2.388 gives you a 2.8:1 reward-to-risk if TP2 (2.239) prints.
- Confidence 55% isn’t screaming, but the range’s lower half is the path of
TRUMP-1.89%
#USELESSSurgesAnother67% USELESS Surges Another 67%
USELESS Surges Another 67% — Momentum Takes Center Stage
The crypto market has once again reminded traders that momentum can appear when least expected. USELESSSurgesAnother67 has become a headline-grabbing move, with the token recording another 67% surge and attracting fresh attention from traders and the wider crypto community.
A move of this magnitude naturally raises an important question:
What is driving the momentum, and can it continue?
Momentum Is Back in Focus
A sharp price increase can bring a wave of new market participants. Tra
post-image
USELESS-18.08%
Layout for Bitcoin, Ethereum, and Dogecoin
live-cover
LIVE3,678
  • 1
BNB Surpasses 770 USDT with a 7.24 percentage Increase in 24 Hours
live-cover
LIVE1,441
9.7 BTC Analysis
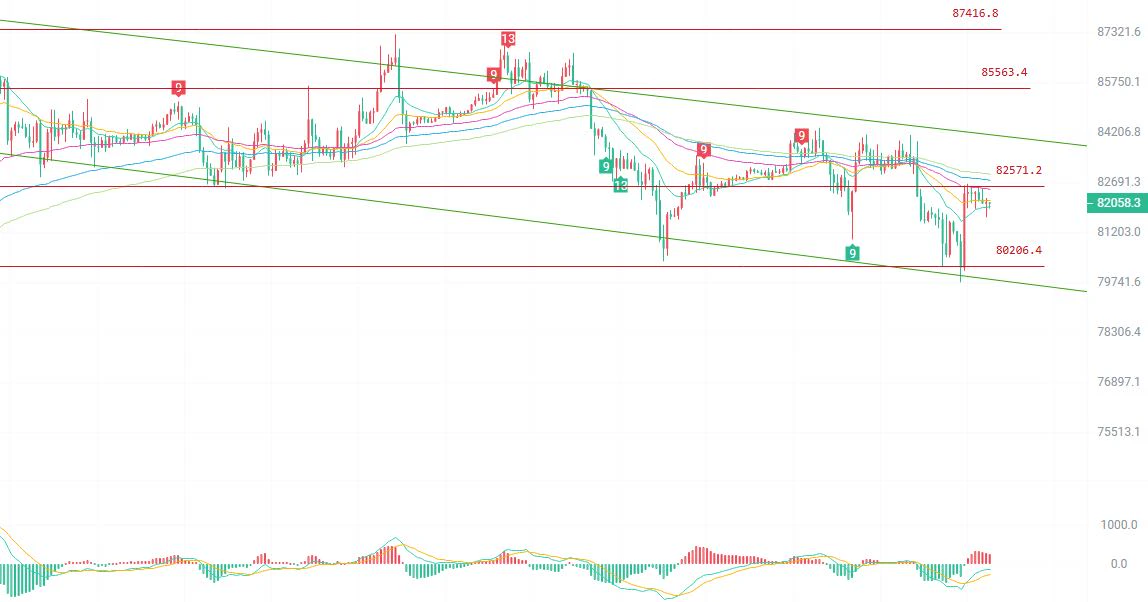
After an impulsive surge on the BTC one-hour chart, the price pierced the upper Bollinger Band, while RSI6 reached around 75 and entered the overbought zone. Although the MACD red bars are expanding, bullish momentum shows signs of exhaustion, indicating a need for a technical pullback. U.S. stock markets are closed today for Labor Day, creating a vacuum in external news. Market movements are being driven entirely by funds in on-platform contracts. Key resistance is around 80400, while strong support is near 79832, along the Bollinger middle band. In the short term, stop losse
post-image
ETH+1.36%
BTC+0.68%
9.7 Gold Morning Strategy
On the hourly chart, gold prices surged and then pulled back under pressure. After a rapid retracement, the decline slowed, and prices found support above the lower Bollinger Band. The lower Bollinger Band is gradually flattening. After the sharp short-term drop, a technical rebound is likely, while the pace of the decline has eased. Do not blindly chase short positions in the morning; focus on opportunities to stabilize after a pullback.
Key Levels
Resistance: 4450, 4470
Support: 4410, 4395
Strategy:
Go long after prices stabilize in the 4400–4415 range following a p
post-image
XAUT-0.19%
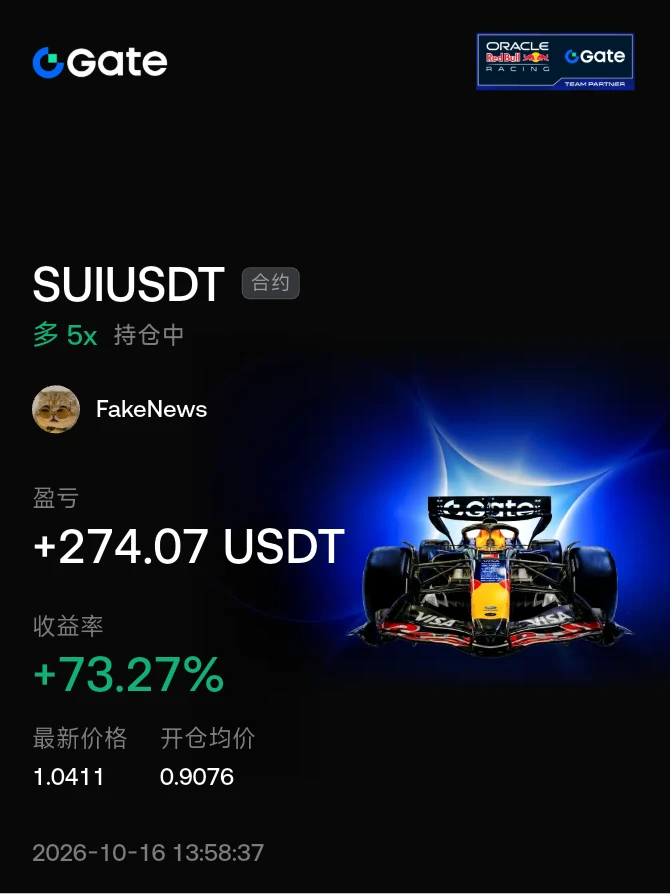
I will definitely get better. I won’t be afraid of all the pitfalls I’ve encountered along the trading journey. I was born lucky.#晒出我的持仓收益
post-image
My hand trembled slightly when I set the stop-loss a few days ago, only to find this morning that it was unnecessary filial piety. The last thing I saw before bed was $HYPE stabilizing around 83.949 after a pullback, with buying pressure clearly strengthening. I immediately told everyone this level had potential. Looking again today, 87.898 has already played out, delivering a +333.59% return. Those who got on board must have woken up smiling, right? The sleepless nights weren’t in vain—we got the rhythm right. Don’t hesitate to lock in profits: take 80% off first, move the protection level fo
post-image
HYPE+2.82%
BNB-1.87%
SOL+3.18%
I originally wanted to cut my losses to appease the heavens, but the ritual never happened—the meat cooked itself. While the market was bottoming out, I saw $HEMI pull back to around 0.008964. The key level was rock-solid, as if welded shut, and buying pressure was quietly building. I said at the time: this level is worth a try. By the time it broke out, I realized that 0.011188 had already left the level I was watching in the dust, with +488.21% secured. It felt incredible—the people on board must have woken up laughing. I’m taking 80% in profits first, putting the bulk in my pocket; I’ll mo
post-image
HEMI+5.22%
XRP+0.64%
DOGE+1.08%
$LTC broke out a few days ago, but I did not chase it directly and instead waited for a pullback confirmation before entering. The core logic at the time was that after breaking above a key level on increased volume, price could not quickly fall back below it. Once that level was confirmed, there was an open range above. I placed limit orders to enter long, and the market moved fairly smoothly after entry, without any major pullbacks.

I took partial profits after the rally reached the first target, with roughly 70% of the position banked at around +606.25%. I moved the protection level for t
post-image
LTC+0.51%
BTC+0.71%
DOGE+1.08%
I just took profit on my long position, so I’m reviewing it while the memory is still fresh. The market was moving sideways at the time, with the moving averages on the hourly chart converging, volatility narrowing further, and the chips clearly being compressed. I judged that the direction would most likely break upward, so I first positioned part of my long near the lower boundary of the range.

The move started a little later than I expected, with even several false dips in between. However, none of the dips broke down the range structure, and the key levels were actually moving higher. Th
post-image
ZEC+19.75%
BNB-1.87%
Rewards are being distributed! Open your mystery box now and win up to 100 USDT worth of tokens!
Gold Pulls Back to Build Momentum, Awaiting a Breakout Amid Rate-Hike Expectations
The four-hour chart shows that gold prices pulled back after touching a high of $4,696 and are currently trading near the middle Bollinger Band. The RSI is in neutral territory, indicating that buying and selling forces are temporarily balanced, with the short-term direction awaiting breakout confirmation.
At the news level, the market is closely focused on the Federal Reserve’s September interest-rate decision, with expectations of whether to raise rates repeatedly shifting. Various U.S. economic data continue
post-image
XAU-0.21%
Rewards are being distributed! Open your mystery box now and win up to 100 USDT worth of tokens! https://www.gate.com/referral/earn-together/invite/UFRFAQ0M?ref=UFRFAQ0M&ref_type=103&utm_cmp=rXJBDjtJ&activity_id=1788357807948
post-image
  • 2
Goldman Sachs is flexing with an $87.45M XRP ETF position, leading the pack among U.S. institutions! 🚀 What does this mean for crypto's future? $XRP #CryptoNews
XRP+0.64%
This was purely the market being in a good mood and casually tossing out some gold coins—one just happened to hit me on the head🍀. When I checked the market after lunch, the $TAO order book was already looking unusual, with funds quietly entering.
The price returned to around 225.0 and repeatedly held firm on declining volume. No one was willing to sell on the pullbacks, so I said just one thing: this level is worth trying to follow. Stronger buying pressure is the most honest signal—no need for too many tricks.
I just refreshed the price, and 262.3 has already been reached. +801.07% is more
post-image
TAO+11.79%
SNDK+0.77%
ETH+1.38%
MARKET ALERT - XAUUSD
#Gate60MillionUsers
Trend Analysis
Timeframe 15 Minutes (M15): Dominant trend Bearish. Price is moving below all EMA lines (EMA5: 4428.51, EMA20: 4429.85, EMA50: 4436.57, EMA200: 4434.75). A narrow consolidation is occurring around the previous low support area (4365.56).
Timeframe 1 Hour (H1): Dominant trend Bearish/Downward Correction. A breakdown has occurred below the EMA support area. The price position (4425.80) is now below EMA5, EMA20 (4439.95), EMA50 (4437.54), and EMA200 (4461.86).
Trading Opportunities & Strategy
Primary Option (Sell on Rallies):
Entry: Sell w
Cryptocurrency_ALERT
GIVEAWAY FOR MY SUBSCRIBERS🥳
PART 1
XAUUSD-0.15%
  • 4
  • 1
Bitcoin and Ethereum both moved in the same direction over the weekend and, having lived up to expectations, arrived as promised late last night at $BTC 79119 and $ETH 2457, closing with gains of 1000+66 points.
Time will not stand still, but our efforts will leave their mark. Let us create a better future together.
ChenMingyuan_guanjin
Good evening, September 6! Bitcoin and Ethereum's intraday bulls first pushed prices up to 80085 and 2523, before they fell to 79520 and 2482. Although the range was small, it perfectly matched today's bearish outlook, with the peak validating 600+41 points. We secured 4500+160 points this Thursday.

$BTC Mingyuan, evening of 9/6: Short around 80200-80700, targeting
around 79400-78500.
$ETH Mingyuan, evening of 9/6: Short around 2520-2545, targeting
around 2475-2430.
BTC+0.71%
ETH+1.36%
Name that token $______
#memecoins
post-image
This long trade was actually rather uncomfortable. Right after entering, I got hit by a false-breakout wick, which nearly swept my stop-loss at a key level. I didn’t cut the position at that level because volume hadn’t expanded; instead, it looked more like a shakeout. The chart then saw a series of consecutive small bullish candles, and the battle between bulls and bears quickly shifted in favor of the bulls. When the price reached around 1282.02, I took profit on 70% of the position and moved the stop-loss on the remaining position above breakeven. The profit is currently at +710.41%, and th
post-image
BTC+0.71%
BNB-1.87%
Load More

Join 40 M users in our growing community

⚡️ Join 40 M users in the crypto craze discussion

💬 Engage with your favorite top creators

👍 See what interests you

View More