Square
Following
Hot
News
Notifications
Profile
Share your thoughts
placeholder
Article
ETH’s price action during the day on the 13th was a “crash,” with spot holders dumping and fleeing while long positions in futures were “liquidated in a cascade.”

After 10 a.m. on the morning of the 13th, bearish news broke: “Iran’s Revolutionary Guard says it destroyed a US early-warning radar in Bahrain.” The news triggered a morning crash across the crypto market, with ETH plunging 126 points from 2020 to 1894.

This was Iran’s first direct strike on US military facilities in the Middle East in two months, sharply raising the risk of a US-Iran conflict. The market fears the US may retaliat
ETH-1.26%
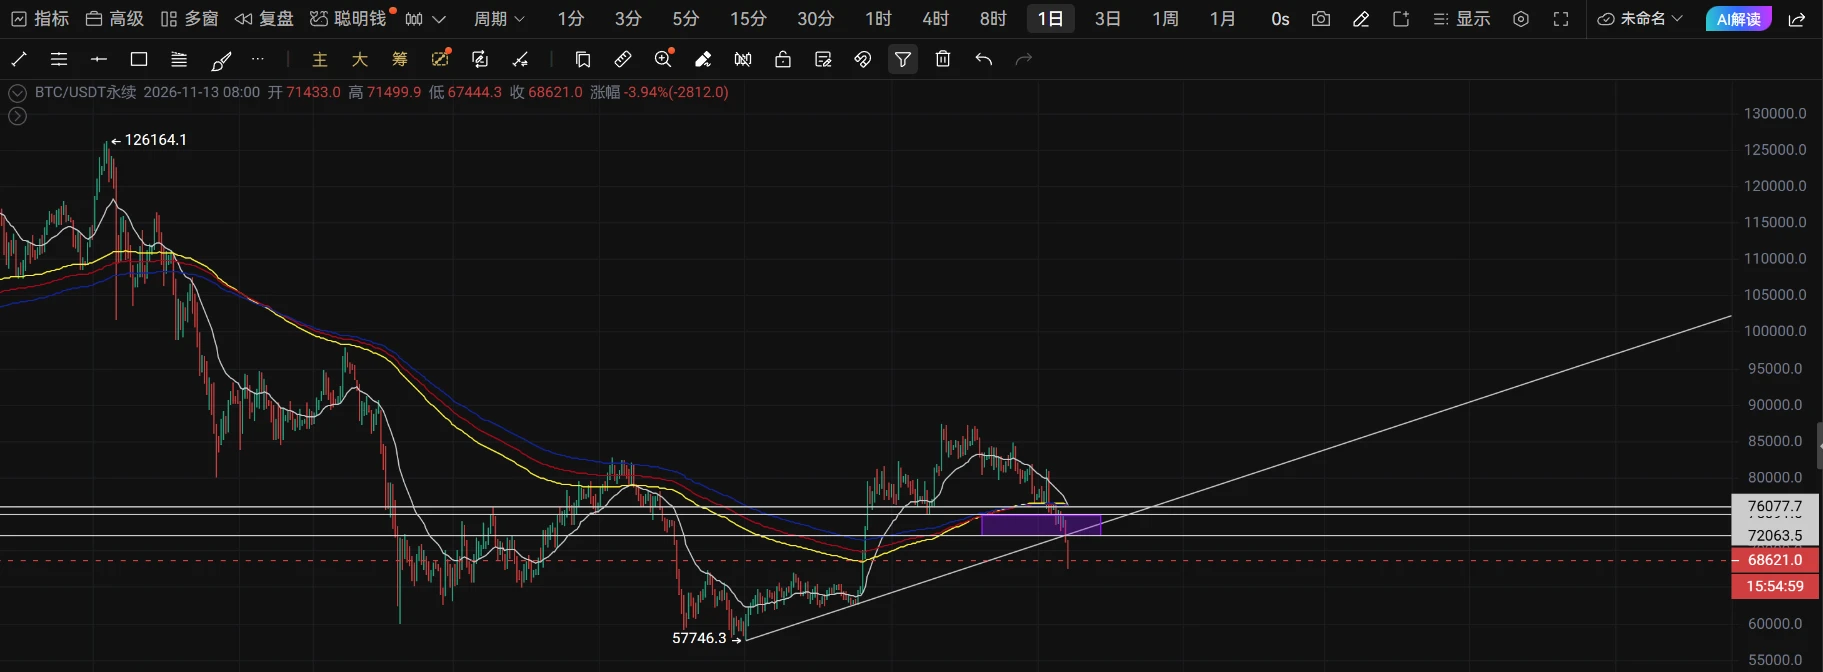
BTC has broken below the uptrend line on the daily chart. The bearish trend is too strong, and market sentiment is driving a panic-fueled decline. The only certainty in the market is uncertainty. Manage your positions strictly, and always set stop-losses when opening trades. Don’t worry—if you’re wrong, cut your losses promptly. If you can’t make sense of the market, consider stopping trading. The market is full of opportunities, so preserve your strength and capital. Stay in the game, and you’ll have opportunities. Don’t hold losing positions—sometimes not trading is a strategy too. $BTC $BTC
post-image
BTC-0.65%
ETH-1.23%
Trenches
mihao
m
bade
b
mihao
4Cxj...pump
Market Cap
$.
Change
.
24h Vol
$.
Holders
.
AGT
A
bade
b
AGT
0x5d...e274
Market Cap
$.
Change
.
24h Vol
$.
Holders
.
FOOD
F
bade
b
FOOD
FTu5...pump
Market Cap
$.
Change
.
24h Vol
$.
Holders
.
IDOL
I
bade
b
IDOL
0x3b...ab07
Market Cap
$.
Change
.
24h Vol
$.
Holders
.
AI
A
bade
b
AI
2T56...pump
Market Cap
$.
Change
.
24h Vol
$.
Holders
.
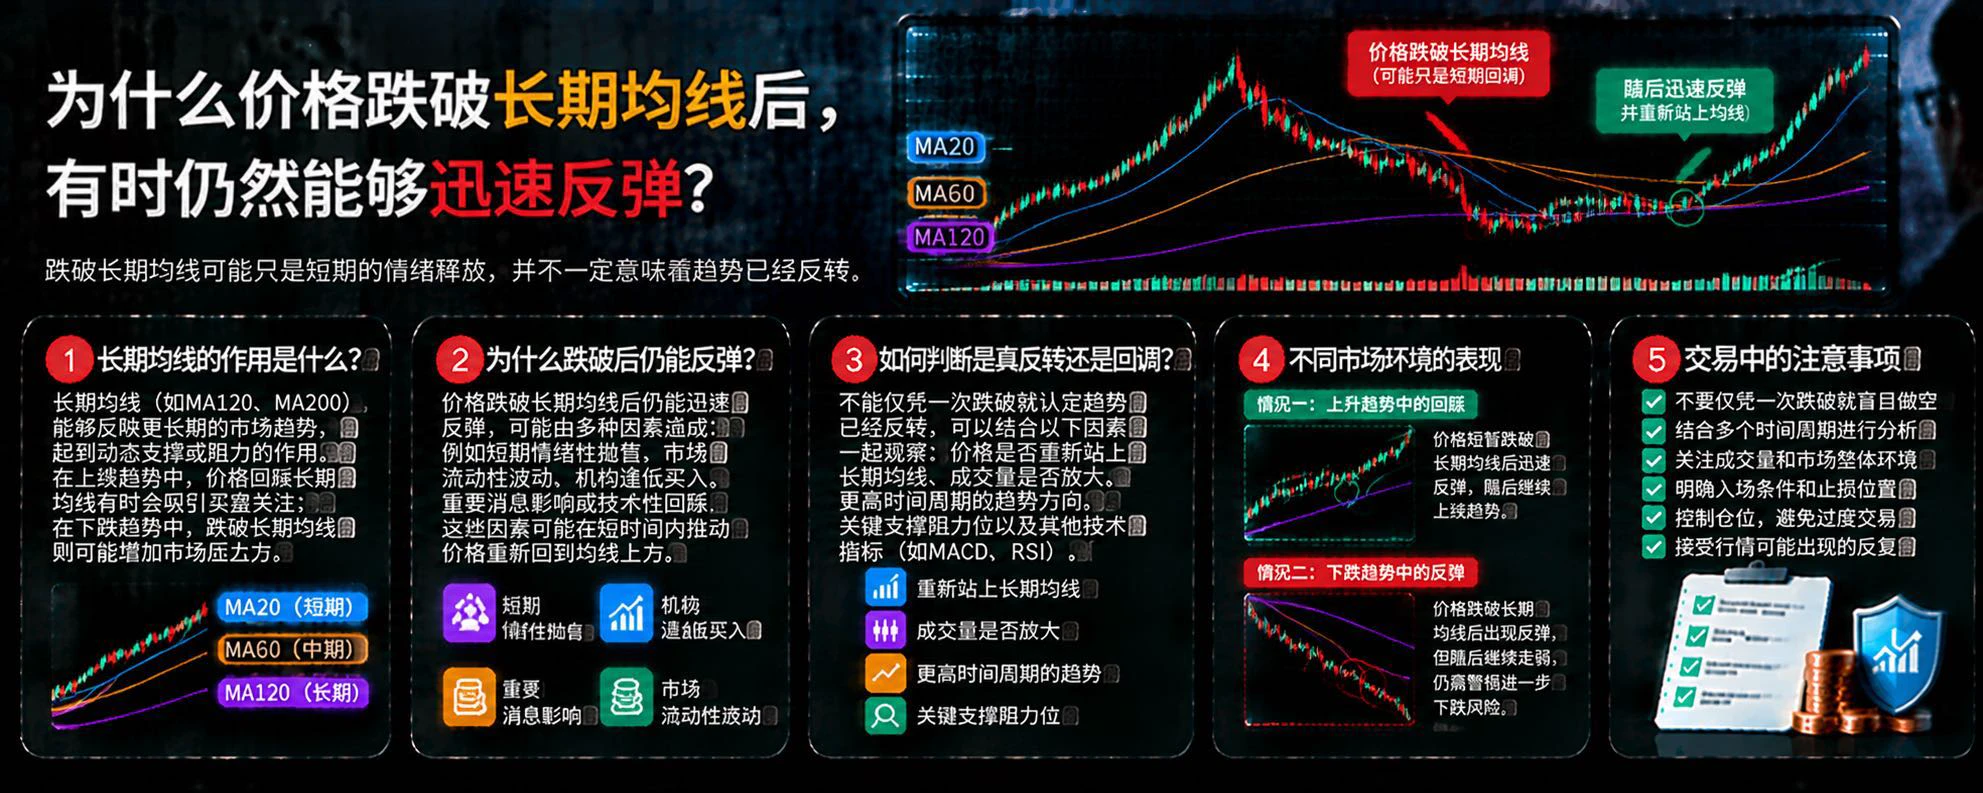
Why Can Prices Rebound Quickly After Falling Below a Long-Term Moving Average?

In crypto markets, long-term moving averages are often used to assess medium- and long-term trends. When prices fall below an important moving average, many traders assume a downtrend is confirmed. In reality, however, prices can sometimes rebound quickly and climb back above the moving average. Understanding this phenomenon can help prevent making trading decisions based on a single signal.

First, long-term moving averages reflect historical prices. For example, MA120 reflects the average price over a certain pas
post-image
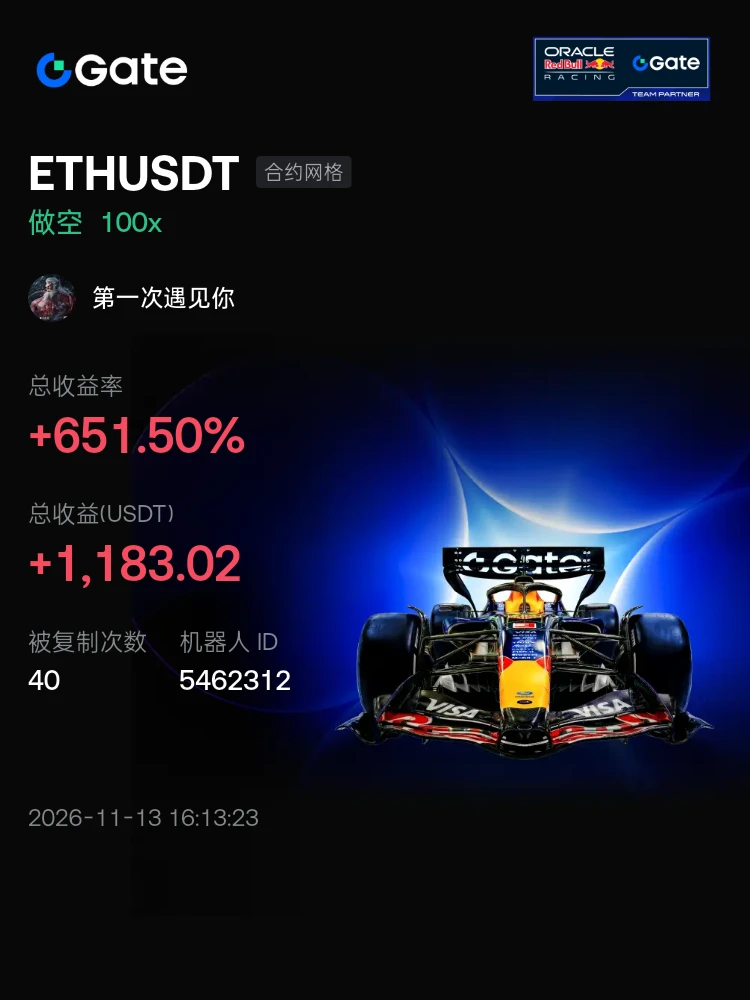
#交易机器人 I'm using the ETHUSDT futures grid bot on Gate—come copy my trades
post-image
Holy shit, the sky is falling.
Are there really people like this in the world?
post-image
Zcash Loses $1,000 as Dormant Wallets Send ZEC to Exchanges
Zcash fell below $1,000 as leveraged traders exited bullish positions and ETF outflows approached $30 million.
Data from CoinMarketCap showed ZEC at approximately $965 on Nov. 12, after a 24-hour low near $953.
⚠️ Personal market analysis only. NFA — manage risk and DYOR.
Educational content, not investment advice or a recommendation to buy, sell, deposit, or withdraw any asset. No paid promotion or referral/affiliate links.
post-image
ZEC+1.16%
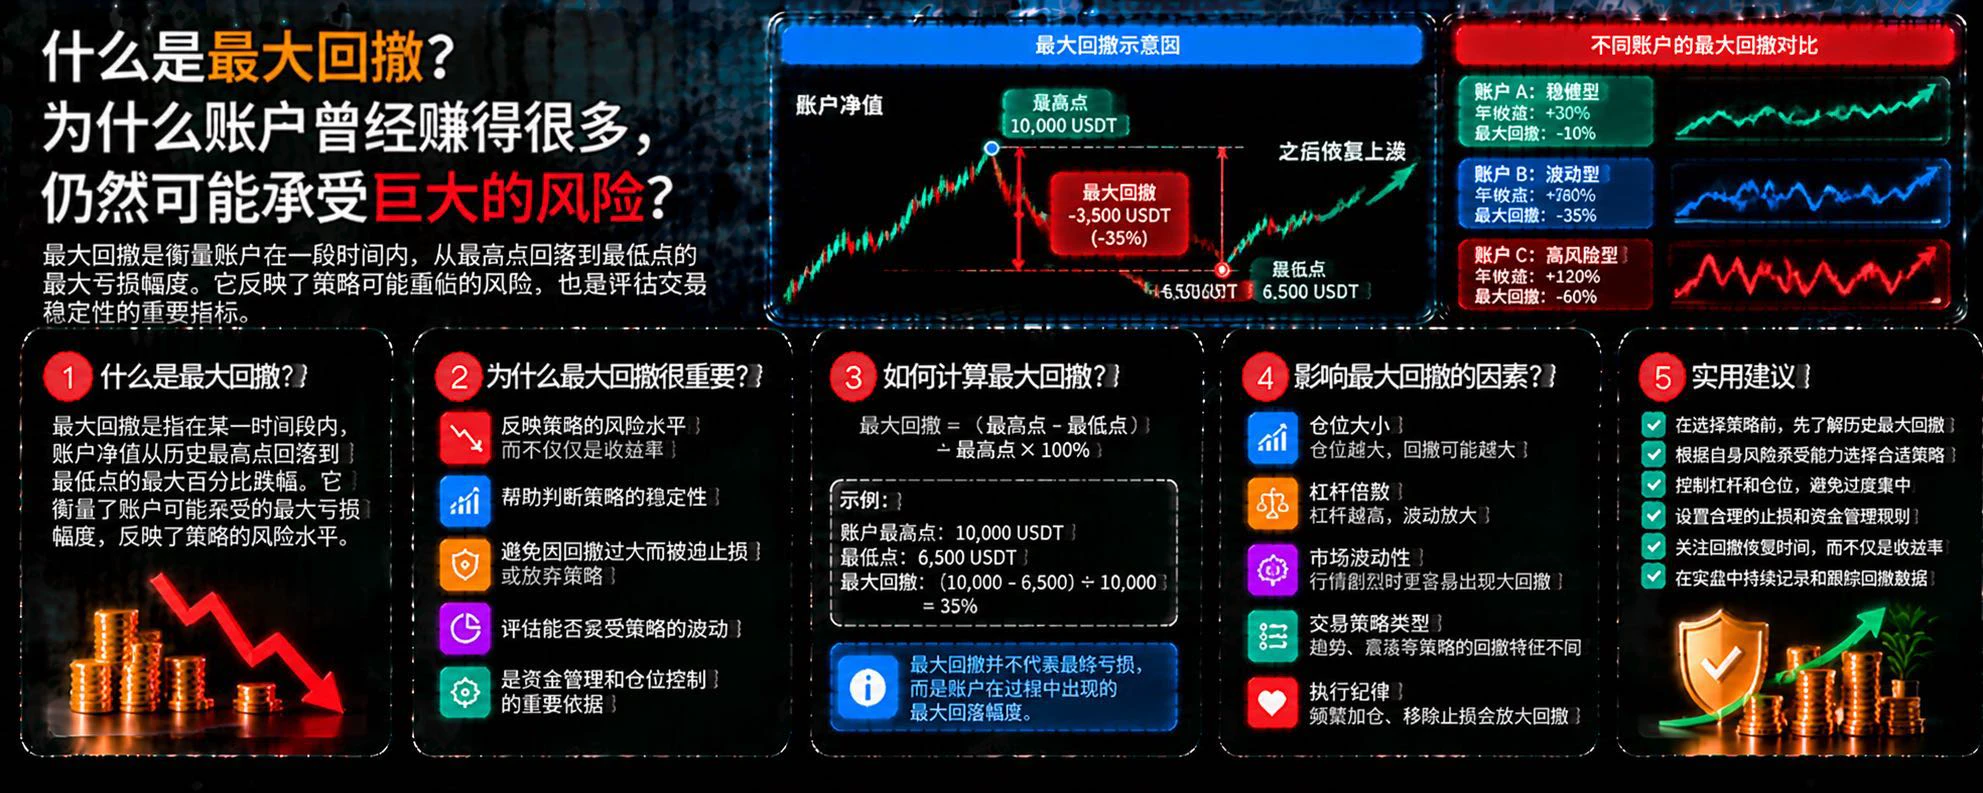
How Should Position Size Be Calculated? Why Is It More Reasonable to Determine the Risk Amount First, Then Decide How Much to Buy?

In cryptocurrency trading, many people are used to assessing the market first and then deciding how much to buy, while overlooking the most important step: if they are wrong, how much of a loss can they actually afford to bear? Sound position management should start with a risk budget, not potential returns.

First, determine the amount of risk you can afford to take.

Suppose your account has 1,000 USDT and you plan to limit the risk on a single trade to 1% of yo
post-image
Phones can do much more than we think and @Acurast is a good example of that
I like how Acurast turns everyday smartphones into compute units instead of relying only on traditional data centers
Its network uses Trusted Execution Environments to keep workloads private and make execution verifiable
I think there is room to bring more AI apps agents and realworld services onto this infrastructure
The next big step for Acurast will be proving that smartphone powered compute can scale reliably for demanding AI workloads
post-image
ACU+1.16%
If you had invested your 20k USD in the following quality assets five years ago today
Today's returns...
Many OGs taught us
Crypto carries higher risk but offers better returns
HODL quality assets and they will outperform traditional finance
But it turns out even A-shares can outperform Bitcoin and Ether?
post-image
ETH-1.26%
#策略# A clear pullback began on October 9; the pullback has continued since then. Today will test 108.62. I shared my view in Figure 2. Strategy has been confirmed for removal from the MSCI index, effective after the close on November 30. Selling pressure will persist until then and ease after November 30. The downtrend is expected to end before November 30. ​​​$MSTR ‌
MSTR-2.01%
$AKE This is really great, great, great, great
AKE+6.07%
  • 1
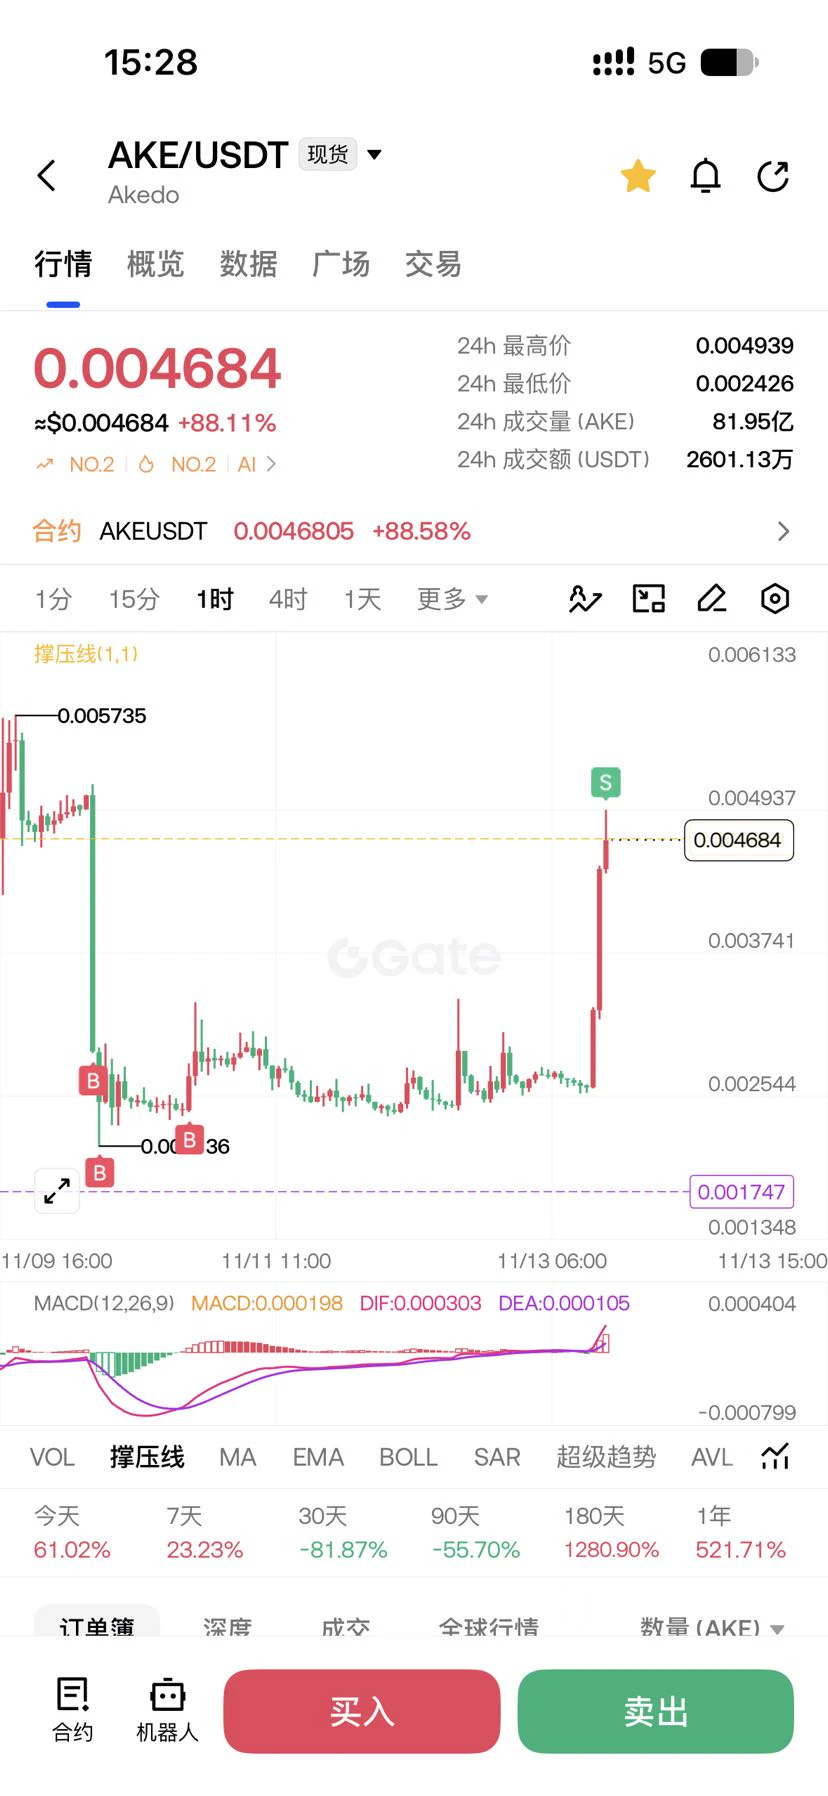
$AKE The project team is showing off now! No wonder this dog market maker even uses dog emojis—any little rebound is a 100% gain! Short sellers are really hurting
post-image
AKE+6.07%
new market update
live-cover
LIVE1,879
society if there was only one token per meme
post-image
TOKEN-0.16%
MEME-0.94%
$AKE It’d be a lie to say I’m not scared, but I’m even more afraid of selling too soon and missing out
post-image
AKE+6.07%
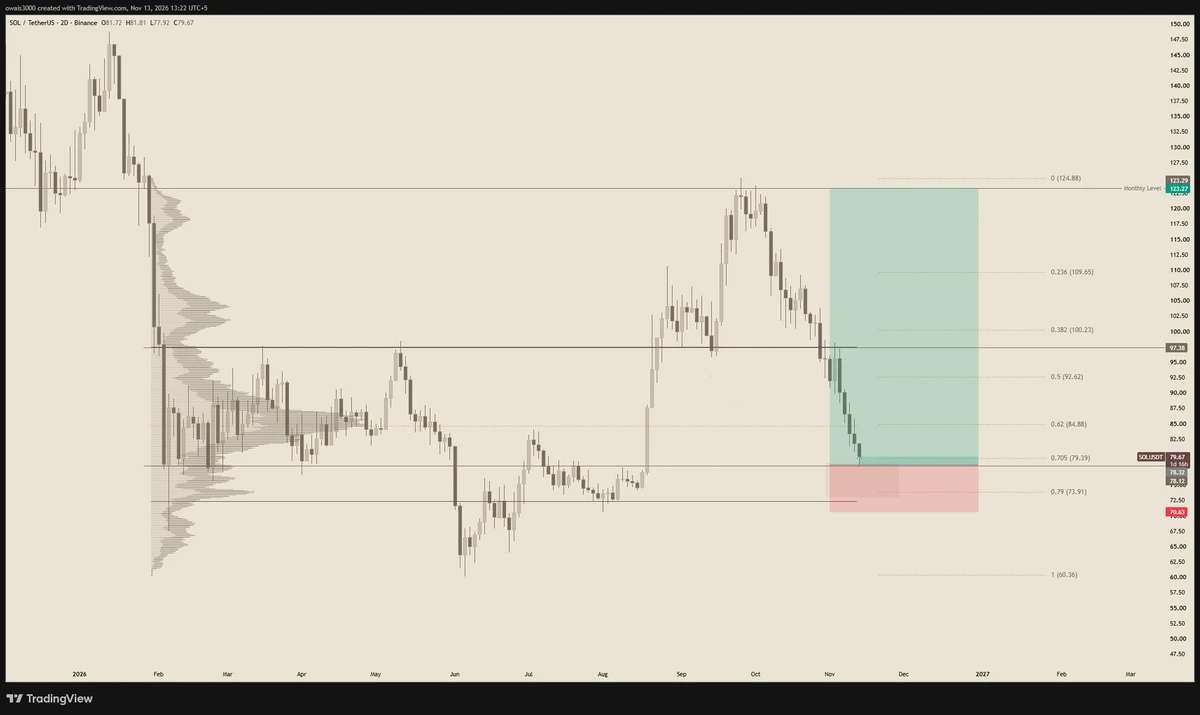
$SOL Trade Swing
Entry: CMP
SL: 70.63 (Daily Close)
You can also take this as spot, we are at huge discount levels, worth buying.
post-image
SOL-0.77%
Gaming has always been about experiences, competition, and digital ownership.
Blockchain technology introduces another dimension by exploring how in-game assets and player economies can work.
The challenge is making the games genuinely enjoyable, not just adding tokens.
Would you play a blockchain game if the gameplay was actually good? 🎮
#GameFi #BlockchainGaming #Web3
post-image
GAFI+1.00%
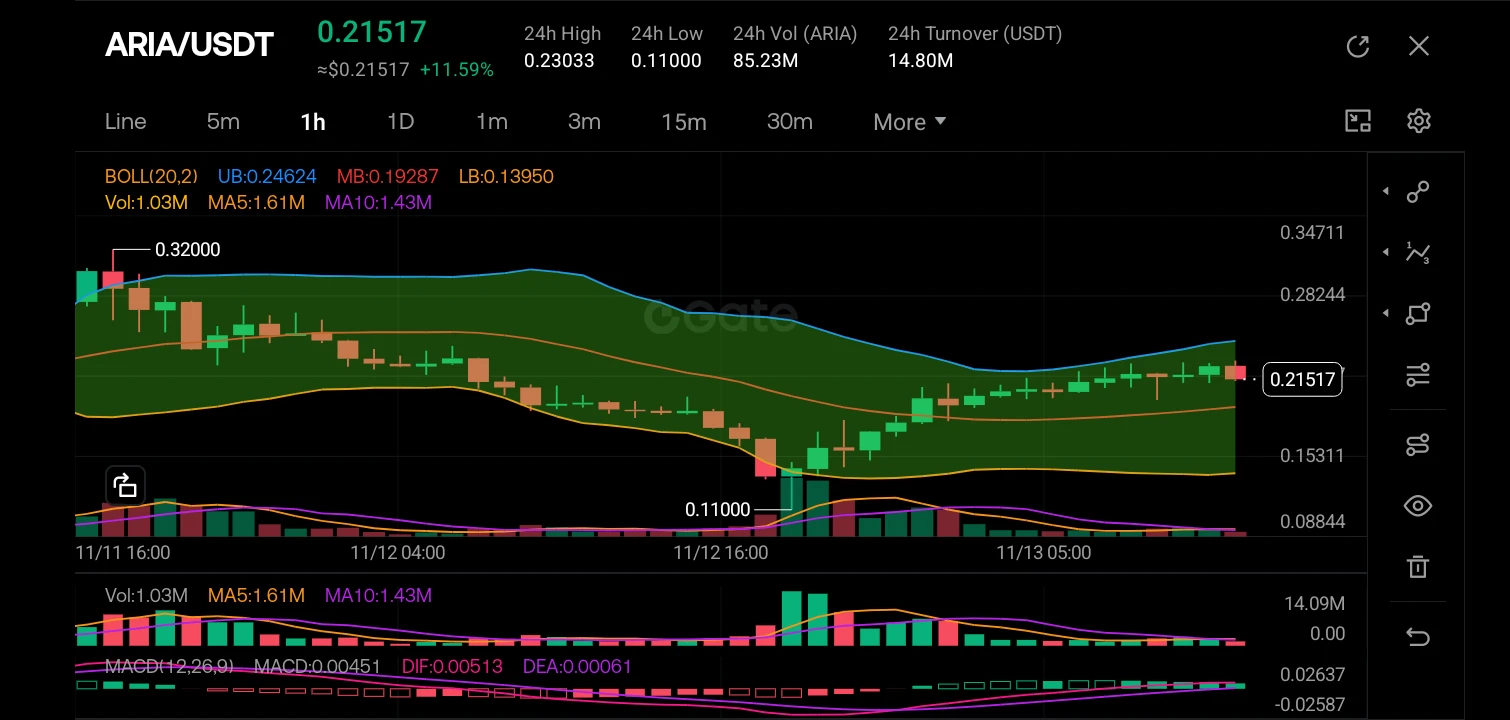
$ARIA ‌
The market structure has shifted from a heavy downtrend to a bullish reversal. After a steep drop to the 0.11000 floor, we see a structural break to the upside (BOS) as price reclaimed the 0.19 level and pushed to 0.21517. The K-lines (candles) show strong buying momentum with consecutive green closes, pushing the price from the lower Bollinger Band toward the upper band (UB: 0.24624), indicating high volatility and a potential overextension in the short term. The MACD is showing a bullish crossover with the histogram expanding green, confirming the current momentum.

I am observing a
post-image
ARIA+22.03%
  • 2
  • 2
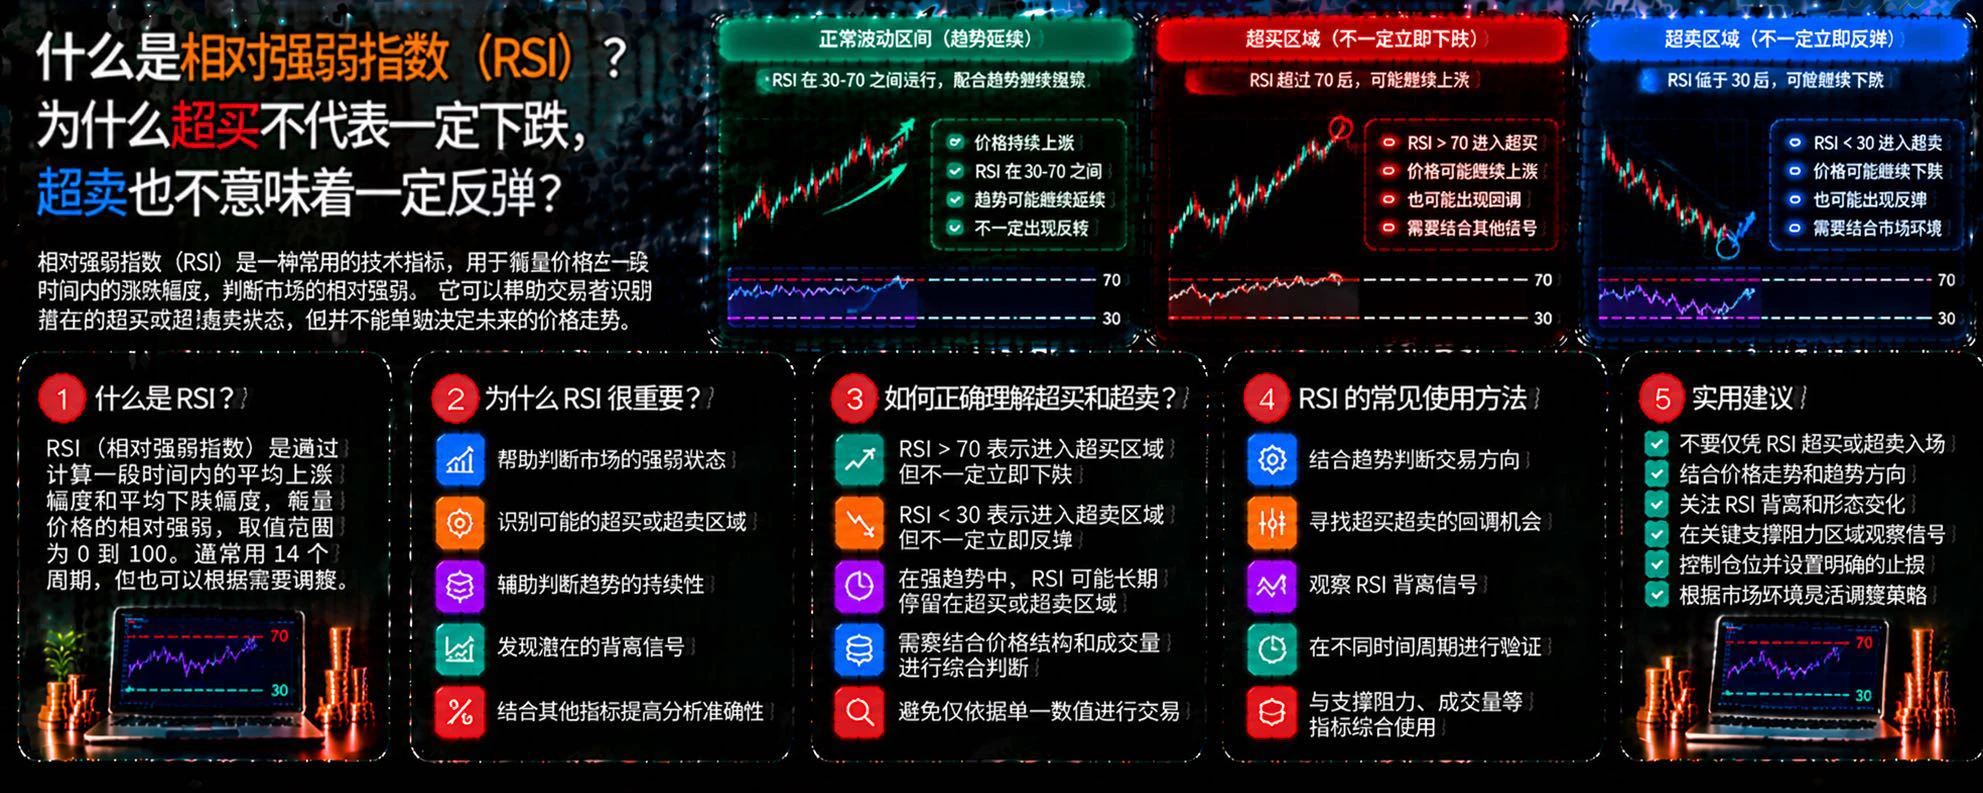
What Is the Relative Strength Index (RSI)? Why Doesn’t Overbought Mean a Drop Is Inevitable, or Oversold Mean a Rebound Is Certain?

In cryptocurrency trading, RSI is a common technical analysis indicator that can help traders observe price momentum. But many people see RSI above 70 and immediately go short, or below 30 and rush to buy the dip, only to find that the market moves in the opposite direction. The issue is that the indicator reflects market conditions, not an inevitable price reversal.

First, what is RSI?

The Relative Strength Index (RSI) typically ranges from 0 to 100 and measur
post-image
[NEW STREAMER]market update
live-cover
LIVE2,803
Load More

Join 40 M users in our growing community

⚡️ Join 40 M users in the crypto craze discussion

💬 Engage with your favorite top creators

👍 See what interests you

Trending Topics

JensenHuangResigns

510.8K Views7.9K Discussing

Jensen Huang has resigned as NVIDIA CEO and stepped down from the board. CFO Colette Kress will serve as interim CEO while NVIDIA considers internal and external successors. $NVDA fell more than 10% in premarket trading following the announcement. With one of AI’s most influential leaders stepping aside, markets are now reassessing NVIDIA’s leadership stability, AI strategy, and long-term valuation.

GateIPOAccessAnthropic

277.4K Views2.6K Discussing

Dr.HanOxfordUnionSpeech

144.1K Views427 Discussing

View More