Share your thoughts
placeholder
Article
$UNI No big deal—hold a heavy spot position through the bull market.
UNI+9.67%
This was purely the market being in a good mood and casually sprinkling some coins, which just happened to land on my head.
Honestly, my hands were shaking when I set the take-profit a few days ago. $BTR was still fluctuating around 0.15892 at the time, volume kept shrinking, and support at the highs was clearly insufficient. Every push upward fell just short. The pattern looked too much like a bull trap, so I directly placed a short to test the waters.
I opened the chart this morning and was completely stunned—it surged to 0.04771, with +4585.5% secured.
How is this a rebound? This is CPR fo
post-image
BTR-3.41%
SNDK+1.42%
BNB+1.29%
With this trend, I don’t even need to think—the account is partying on its own.
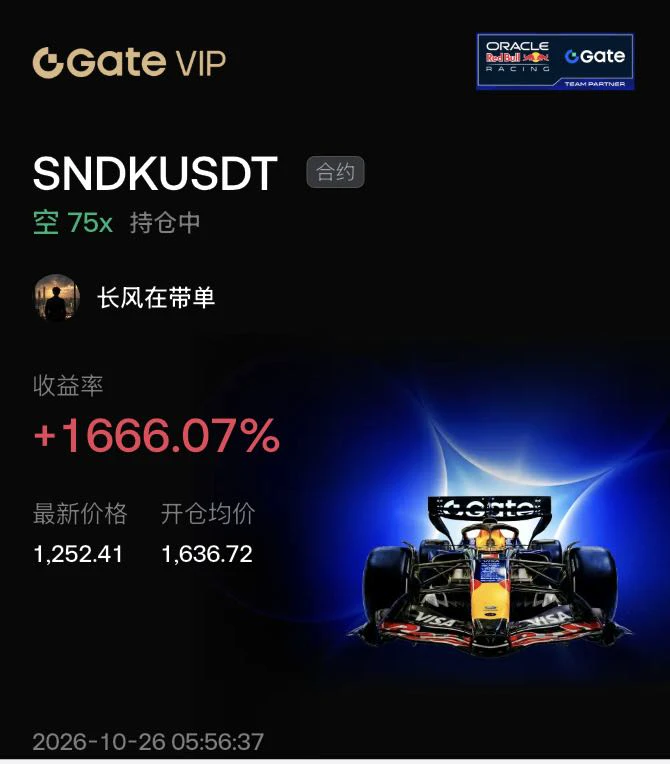
When I checked the chart just after lunch, the market hadn’t fully taken off yet, but buying pressure was quietly strengthening, and I realized the momentum was about to arrive. I set my entry at 1500.51, expecting a push upward, but I didn’t expect the current price to charge straight to 1783.45. I caught this long surge all the way, bringing my position’s return to +1338.9%.
I didn’t panic during the repeated intraday swings; I simply kept the position under control and waited for the rally. The market gave the a
post-image
DOGE+4.87%
ETH+1.55%
$DASH 's long positions were fully liquidated, taking a considerable hit.
post-image
DASH+3.11%
Hold your $ZIVIDEND 🔥
Look at the zcash:native we've accumulated so far 🫢
Market update
live-cover
LIVE1,521
Bitwise shows BTC’s 90-day correlation with gold at a multi-year high and with Nasdaq 100 at a one-year low, while Bitcoin spikes after Treasury ops—risk-off gold drift, risk-on equities disconnect could support tactical hedging moves. $BTC $GLD
post-image
BTC+0.25%
NAS100+0.06%
GLD-0.85%
Everyone’s watching gold’s fake bounce—but the 15-minute RSI just screamed 27.47. That’s not a dip; that’s a setup for $XAU /USDT shorts.

$XAU /USDT - SHORT

Trade Plan:
Entry: 4430.11 – 4432.35
SL: 4441.99
TP1: 4423.16
TP2: 4417.78
TP3: 4409.71

Why this setup?
- 4H bias is SHORT with 55% confidence—not a slam dunk, but the range-bound 1D trend says no breakout fuel.
- RSI 15m at 27.47 = oversold snap-back risk, yet price is pinned at 4431.23 with ATR 4.48—tight stops, fast moves.
- Why now? Entry zone 4430-4432 is the exact rejection line; TP1 at 4423 is a 0.5% scalp before the real
XAU+0.01%
Everyone’s staring at SOL’s 105.58—but the real trap is the 4h candle nobody screenshotted yet.

$SOL /USDT - SHORT

Trade Plan:
Entry: 105.36 – 105.80
SL: 107.66
TP1: 104.02
TP2: 102.98
TP3: 101.42

Why this setup?
- RSI 15m sits at 50.44—dead center, no momentum behind longs.
- 1D trend is *range*, not breakout—so 105.80 is a ceiling, not a floor.
- ATR 1h (0.867) says we’re coiling for a 1%+ move; TP1 at 104.02 is the first domino.
- Why now? Price is “Waiting” at entry, but SL 107.66 gives you a 2:1 risk against TP2 (102.98). The range’s lower edge is calling.

Debate:
Are you fa
SOL+3.96%
🚨 LATEST: $LITE biggest consolidation pattern ever since the uptrend started.
This next breakout above 1000 can target another leg of uptrend towards 1500.
post-image
LITE+4.07%
As Per $ZEC Chart, you can see a Beautiful Cup & Handle Pattern formed on the Weekly Timeframe.
@Zcash has already broken the Neckline/Resistance of this pattern, and if the pattern follows the 100% target, the target could be around $2,200.
No doubt, Cup & Handle is a strong and powerful bullish pattern.
But IMO, these patterns have much higher accuracy when they form near the bottom or after a long downtrend/accumulation phase.
And this is exactly where I’m a little curious and cautious about the current #ZEC setup.
This Cup & Handle has formed near the TOP / ATH area after an already massiv
post-image
ZEC+17.33%
My hand trembled slightly when I set the stop-loss a few days ago; this morning I realized that extra act of devotion had been unnecessary. 😮💨
The last thing I saw before bed was $LTC pulling back to around 49.96. I watched that level for a long while. The pullback held, buying pressure clearly strengthened, and only two words came to mind: dare to buy.
The stop-loss was set, the long position entered, and the rest was left to the market. When I opened the chart this morning, the current price was 54.33, with floating profit at +571.13%—it felt incredible.
Trades like this don't need to be w
post-image
LTC+2.23%
SOL+3.96%
ETH+1.55%
Waiting for the next shot.

$ETH $SNDK
post-image
ETH+1.55%
SNDK+1.42%
No big-picture thinking, can’t hold, the profits on this move are paper-thin, but I absolutely love it. $CRCLX After all, anything you can take away is a good thing.

I was already planning to sell at a loss as a sacrifice to the heavens, but the sacrifice never happened—the meat roasted itself. During that dip in the early hours a few days ago, the whole screen was full of panic selling. I took a look at the key level, and it hadn’t broken at all; it was still moving sideways at the bottom. This is a classic scare rally: sell and you get left behind, hold and you get to eat the meat.

Look
post-image
CRCLX+1.84%
BNB+1.29%
LAB-2.54%
#ZEC is starting to look interesting on the monthly chart.
The bigger picture shows a long accumulation range followed by a strong breakout. ZEC has now moved above the major range resistance and is trading around $1,162.
If this breakout holds, I’d be watching the next major levels rather than chasing every candle.
Trade Setup:
Entry: $950–$1,150
TP1: $1,400
TP2: $2,250
TP3: $3,600+
SL: $820
The key level is the previous breakout zone. If ZEC can hold above it on higher timeframes, the chart could have significantly more room to run.
Invalidation below $820 would make me reconsider the bullis
post-image
ZEC+17.59%
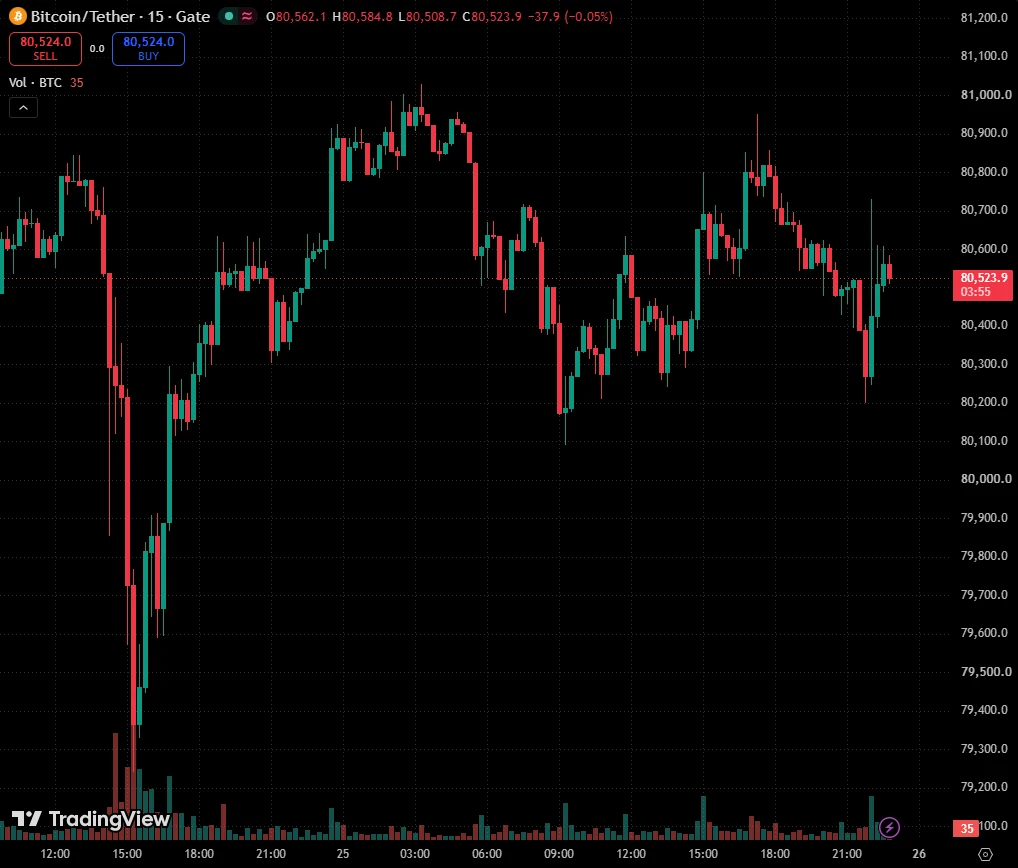
Everyone’s long BTC, but my 4h tape just whispered a name: SHORT. Trust the range?

$BTC /USDT - SHORT

Trade Plan:
Entry: 79826.85 – 79939.39
SL: 80423.28
TP1: 79478.00
TP2: 79207.91
TP3: 78802.79

Why this setup?
Why now?
- Price is pinned at 79,883, hugging the upper lip of a 1D range—rejection fuel.
- RSI (15m) at 50.78 is dead neutral, offering zero upside momentum to break 80,423 (SL).
- ATR (1h) at 225 means we have room to bleed to TP1 (79,478) without panic.
- Confidence is 55.4—not a scream, but a smirk. The range top is the trap door.

Debate:
Are you fading this range t
BTC+0.28%
Up over 21 percent in the 24 hours, $FLOCK is making major moves on the chart and with the utilities.
Cross-chain integration with Chainlink is a big-time bonus for $FLOCK. This happened in August of 2026. Plus, the partnership with Red Hat has been another positive prize.
This is a very solid crypto project, but its very still young. The gains have been very promising for holders.
Heck, they are not complaining at all. They are singing, We are Flock. They also launched FOMO, which stands for FLOCK Open Model. This allows people to trade, launch, and much more.
FLOCK+50.44%
LINK+4.09%
Everyone’s watching HYPE bleed, but the 4H tape just whispered something they missed.

HYPE/USDT - LONG

Trade Plan:
Entry: 86.603 – 86.933
SL: 85.181
TP1: 87.958
TP2: 88.752
TP3: 89.942

Why this setup?
- 1D trend is bullish, yet the crowd is staring at 15m RSI (57.8) like it’s a cliff.
- Price is coiling at 86.768 with ATR (1h) at 0.66—compression before expansion.
- TP1 at 87.958 is only 1.3% away, but TP3 (89.942) is the real prize if momentum resumes.
- Why now? The “Armed” status means the setup is loaded, not dead.

Debate:
Are you fading the 1D uptrend because of a 15-minute
HYPE+3.40%
Load More

Join 40 M users in our growing community

⚡️ Join 40 M users in the crypto craze discussion

💬 Engage with your favorite top creators

👍 See what interests you

View More