Square
Following
Hot
News
Profile
Share your thoughts
placeholder
Article
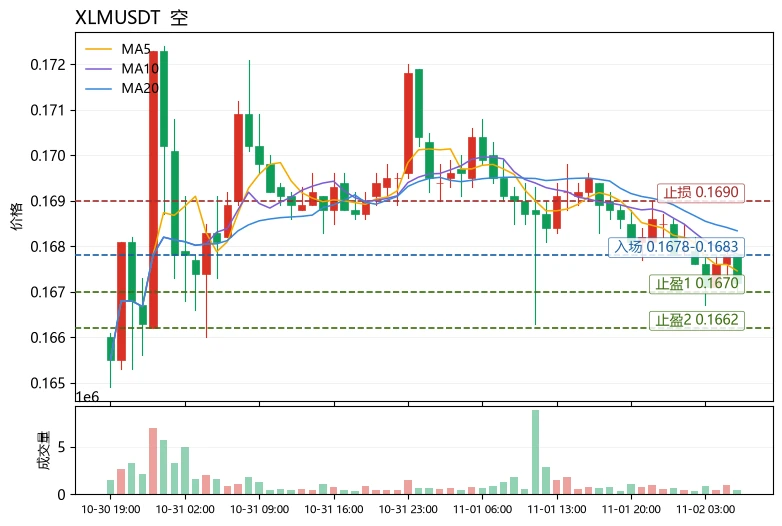
Does a moving-average death cross plus weakening RSI mean you should always chase shorts? Not necessarily—the key is to check where the price sits within the Bollinger Bands and whether the funding rate confirms the move. $XLM is currently a “weak but not collapsing” example, making it a good case for a reusable chart-reading method: use moving averages to determine trend direction, Bollinger Bands to determine price position, and RSI and the funding rate to gauge sentiment.
First, the trend: MA5=0.16746 has fallen below MA20=0.16834, and the MACD histogram is -0.0001168, confirming a bearish
post-image
XLM-0.64%
XRP-1.15%
SUI-1.05%
Bitcoin ETFs shed $643M in a day, erasing weekly inflows
Five funds recorded withdrawals on October 30, with no inflows elsewhere to cushion the reversal.
Quick Take
⚠️ Personal market analysis only. NFA — manage risk and DYOR.
Educational content, not investment advice or a recommendation to buy, sell, deposit, or withdraw any asset. No paid promotion or referral/affiliate links.
post-image
BTC-4.93%
Trenches
ZIG
Z
bade
b
ZIG
0x8c...1145
Market Cap
$.
Change
.
24h Vol
$.
Holders
.
uni
u
bade
b
uni
jM9r...pump
Market Cap
$.
Change
.
24h Vol
$.
Holders
.
Anakin
A
bade
b
Anakin
Exxz...pump
Market Cap
$.
Change
.
24h Vol
$.
Holders
.
IDOL
I
bade
b
IDOL
0x3b...ab07
Market Cap
$.
Change
.
24h Vol
$.
Holders
BTC
B
bade
b
BTC
C5xp...pump
Market Cap
$.
Change
.
24h Vol
$.
Holders
.
Strive's corporate strategy under CEO Matt Cole is built around a "perma-long Bitcoin, short the dollar" thesis.
Instead of traditional debt, the firm uses digital credit via preferred equity as its mechanism to amplify BTC returns. This unique financing structure avoids the standard pitfalls of leverage by remaining completely non-maturing, unencumbered, and immune to margin calls.
‍#CryptoObservers #ShareWeekly
post-image
ASST-10.77%
SATA-3.48%
BTC-0.67%
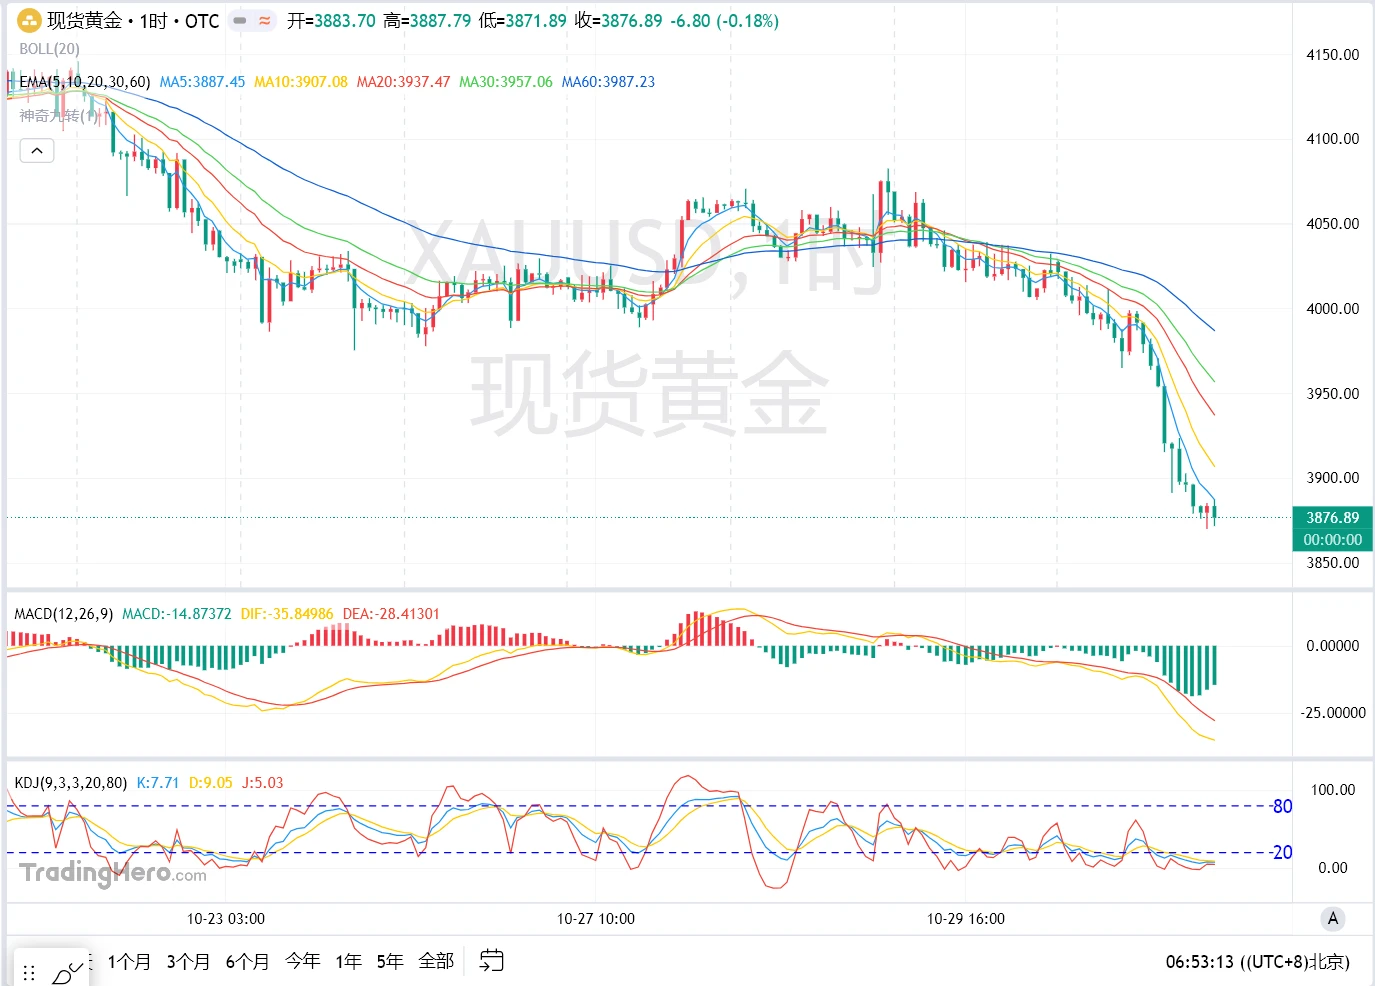
Gold bulls are waking from their pullback-induced slumber—it’s time to squeeze the shorts back to 3940! Buy the dip in $XAU $XAU. Entry range: 3,873.67 - 3,893.14 Take-profit range: 4,071.23 - 4,221.49 Stop-loss: 3,757.46 Please note: If it fails to break above the 24-hour high, it may retest support at 3,881. Don’t go all-in, guys. Keep your position size appropriate for your account.
post-image
XAU+0.38%
Indeed, love for the sake of Allah has a special sweetness ❤️
True love, built on love for Allah and following the teachings of His Messenger (peace and blessings be upon him), is incredibly sweet.
By Allah, seeing this picture of the three scholars made me happier than I can express. Truly, seeing people you love for the sake of Allah is a wonderful thing.
May Allah Almighty unite us with all those we love for His sake in Jannatul Firdaus, in the presence of the Messenger of Allah (peace and blessings be upon him).
Ameen, Ya Hayyu Ya Qayyum ❤️
post-image
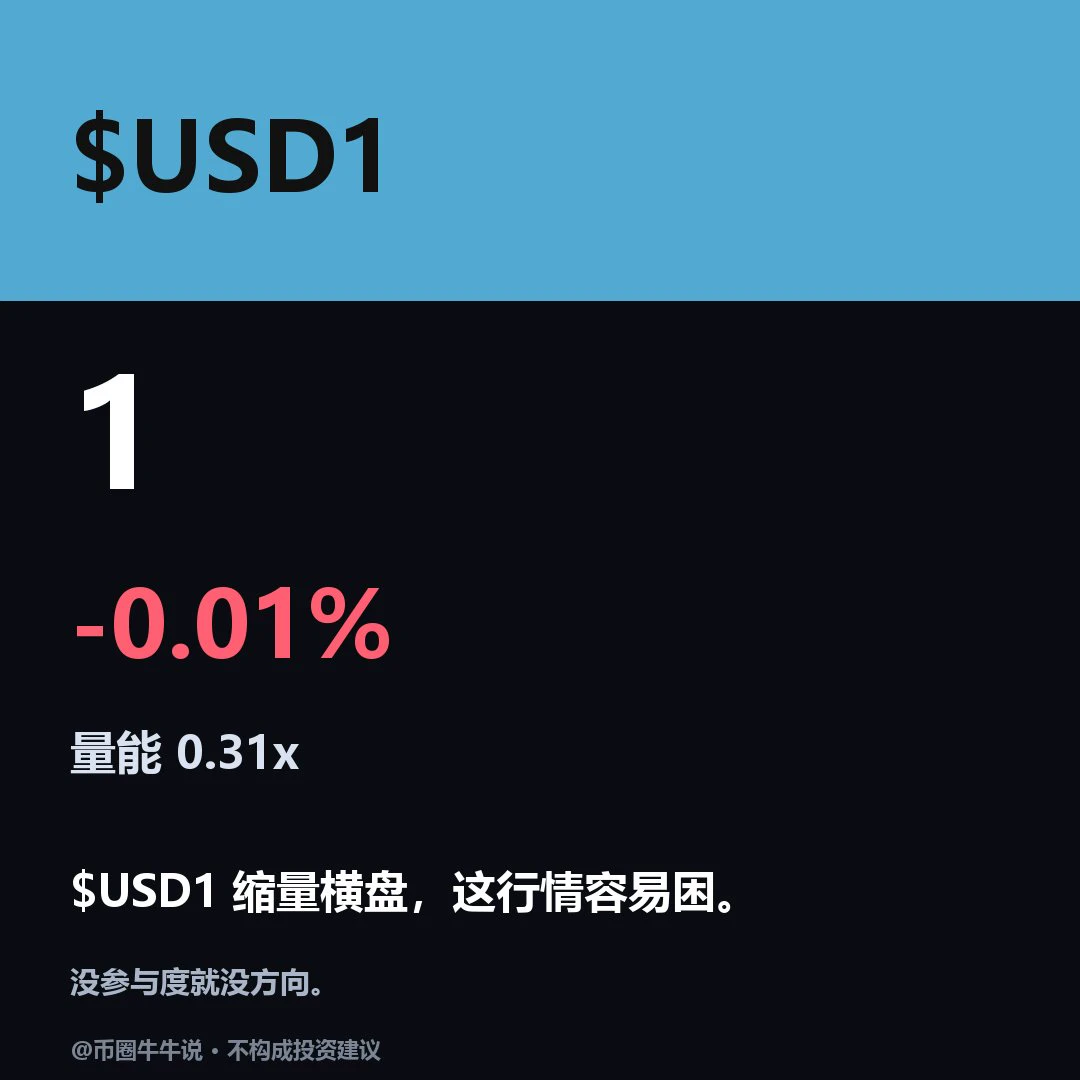
$USD1 is currently trading at 0.99908, down 0.006% over 24H. The 1H is relatively strong (RSI 61.2), while the 4H is relatively weak (RSI 51.6), showing a divergence. If it holds above resistance at 0.99947, a rebound may be possible. If it breaks below support at 0.99868, it may move lower. In the follow-up review, watch whether it can hold above resistance and recover after losing support. With divergence between the two timeframes, short-term moves should not be taken as a trend reversal. Market volatility is high; for observation only.
post-image
USD1+0.00%
Bulls Are Trapped: $SNDK USDT Short Setup Is Ready to Execute
$SNDK /USDT
Direction: SHORT
Entry Zone: 1,160.70299 – 1,162.05187
Take-Profit Targets
🔹 TP1: 1,150.60781
🔹 TP2: 1,143.42635
🔹 TP3: 1,132.65416
Stop-Loss: 1,175.74292
$SNDK ‌
SNDK-0.18%
[New Streamer] Market Prediction
live-cover
LIVE1,652
Long $IDOL $IDOL ‼️Entry : 0.0250 - current priceTP : 0.0306SL : 0.0204
post-image
IDOL-6.71%
Developing games with AI is really fun
Hahahaha
I finally understand the joy of being a game developer
Poor people play with cars, rich people play with dicks, and the ultra-rich play Hamster Run
post-image
Shorting SOL is guaranteed profit—don't ask me how I know #sol
post-image
SOL-0.74%
This chart looks like it wants to rip.
I like it.
post-image
$AKE A new low of 0.0084 was just hit 20 minutes ago. It’s now at 0.0087, down 20.31% over 24 hours, with 92.3M in trading volume. That’s not low volume under normal circumstances, but paired with this nearly vertical red candle, something feels off.
My read of the tape: this isn’t panic selling. Someone had shorts in place near 0.0115, then relentlessly drove the price down. The move from the 24-hour high of 0.0115 to the low of 0.0084 represents a swing of more than 27%, with almost no meaningful bounce along the way—a classic liquidity-hunt pattern. The 92.3M in trading volume shows that a
AKE+6.07%
  • 7
  • 1
November 2 Gold Morning Brief
Gold plunged sharply last Friday, falling nearly $160 and becoming severely oversold. It touched an intraday low near $3,870 and closed near $3,876. The daily chart formed a large bearish candle, breaking straight through the key 3,900 level as bearish momentum was fully unleashed.
Fundamentally, the Fed left interest rates unchanged at its decision early Thursday morning last week, but that does not mean dovish views are in control. Fed Chair Warsh hinted that there is still room for rate hikes, and market expectations for a 25-basis-point hike in December rose t
post-image
XAUUSD+0.64%
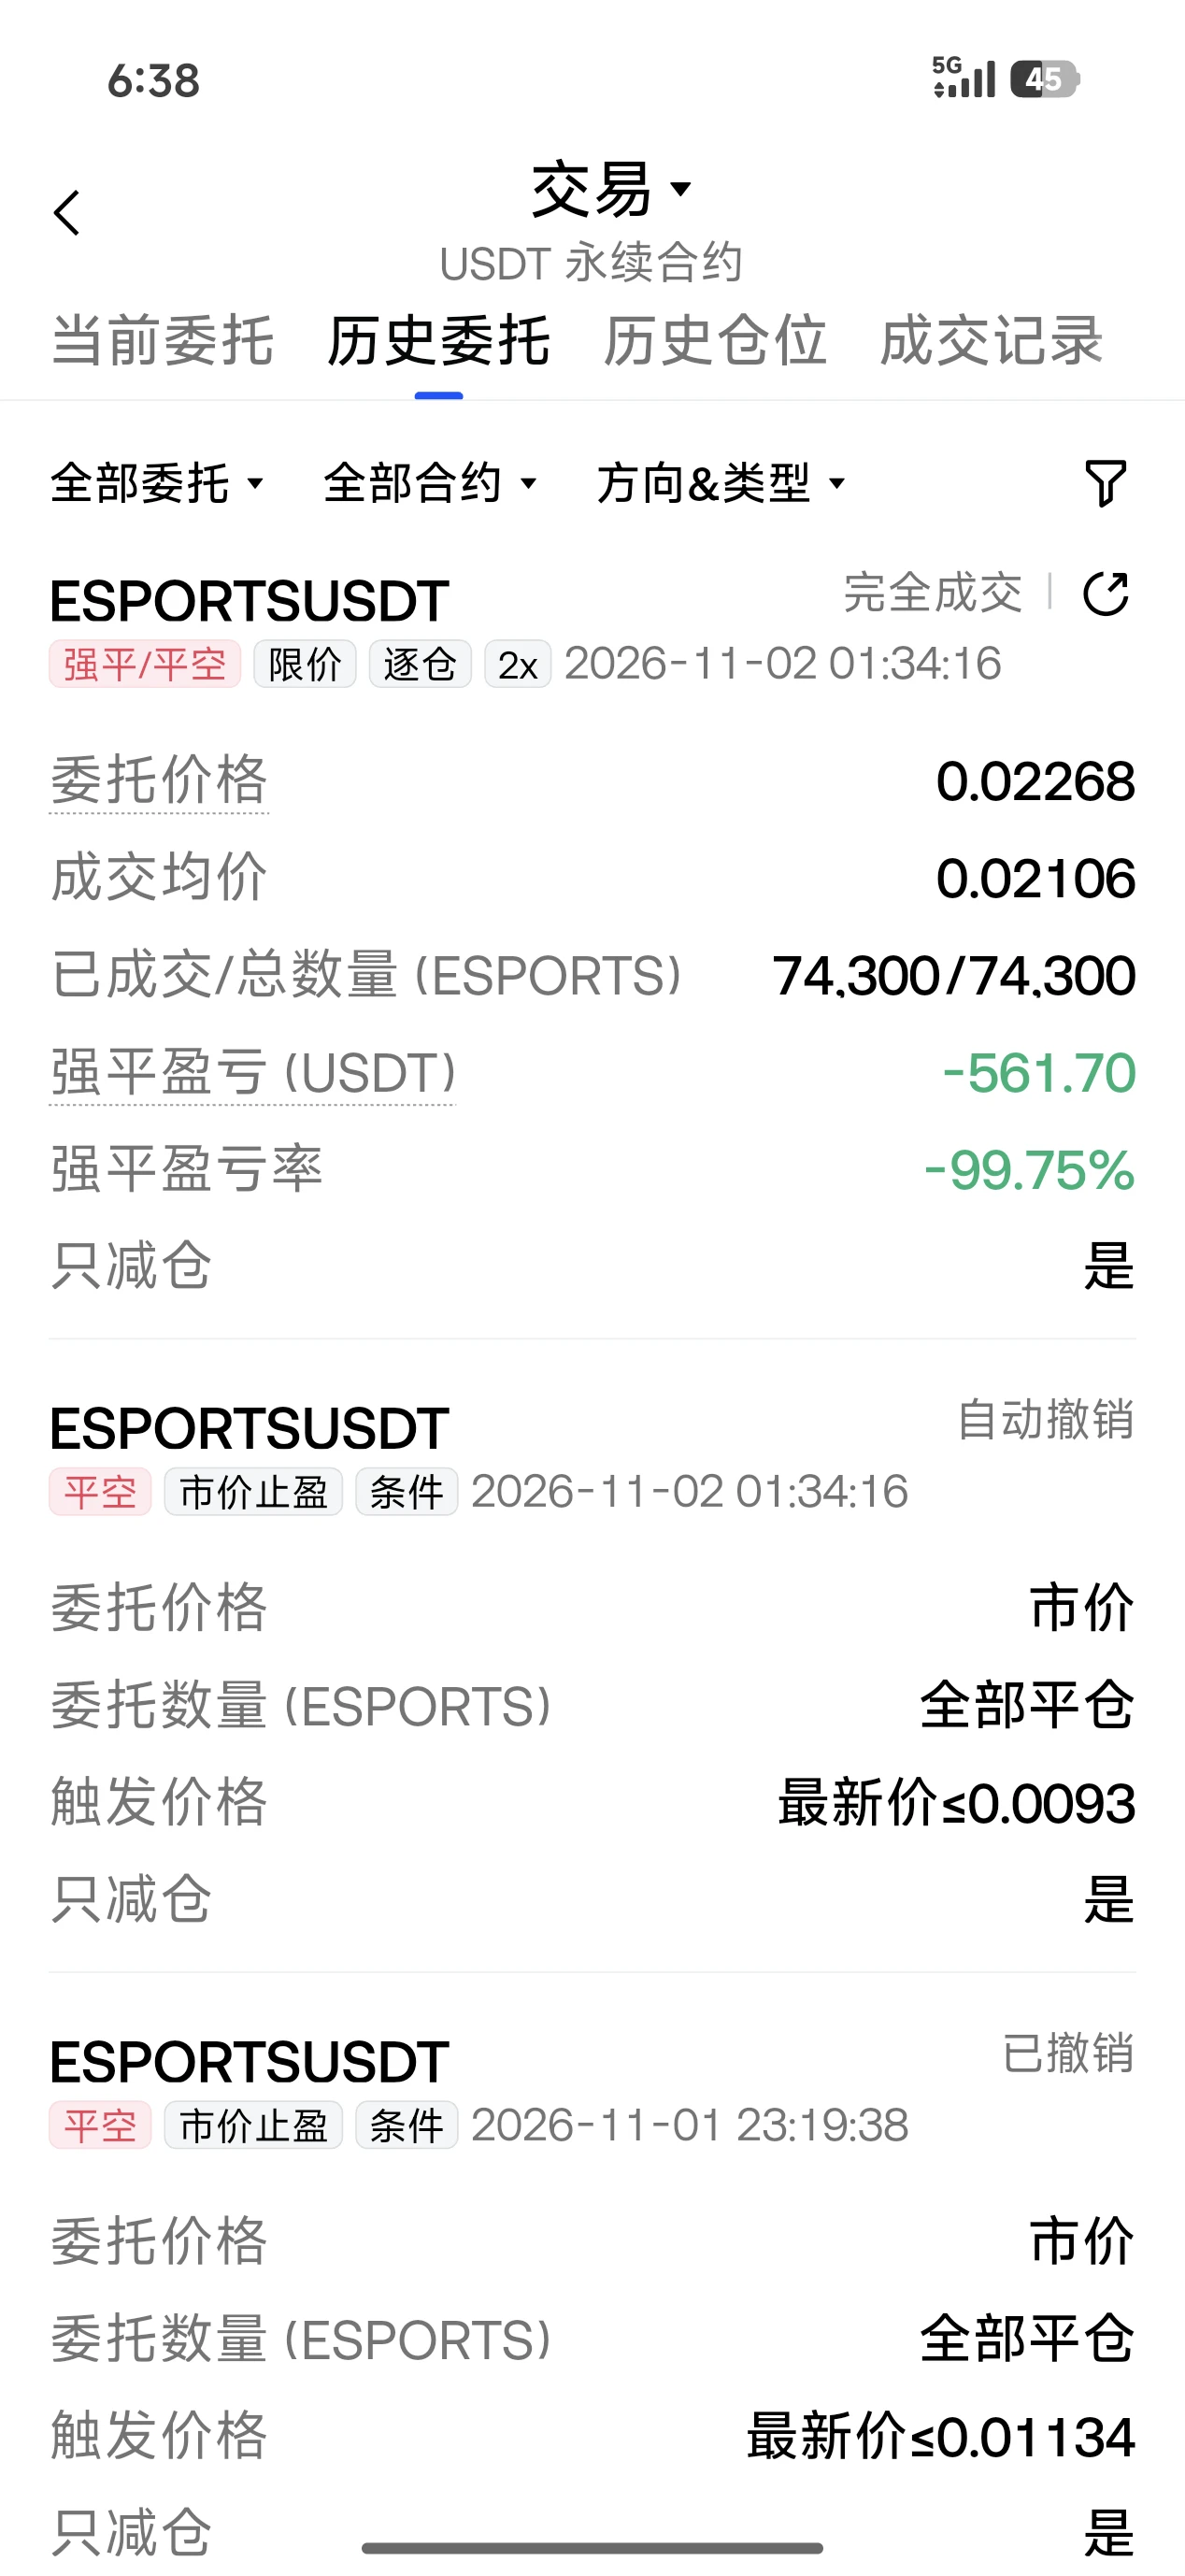
$ESPORTS Holy shit, it actually liquidated me. It hit the liquidation price exactly
post-image
ESPORTS-5.30%
  • 3
Wall Street just went onchain. Crypto holders might want to check the fine print.
DTCC launched tokenization infrastructure backed by a custody business holding $114T in securities.
Here's the awkward part. Banks can use DTCC's private blockchain without buying your favorite crypto token.
Bitcoin already seems to need Nasdaq's permission to rally. Now Wall Street might adopt blockchain without buying our bags.
Wall Street gets the technology. Who actually gets the token demand?
Which token can the banks NOT avoid?
BTC-0.67%
NDAQ+0.65%
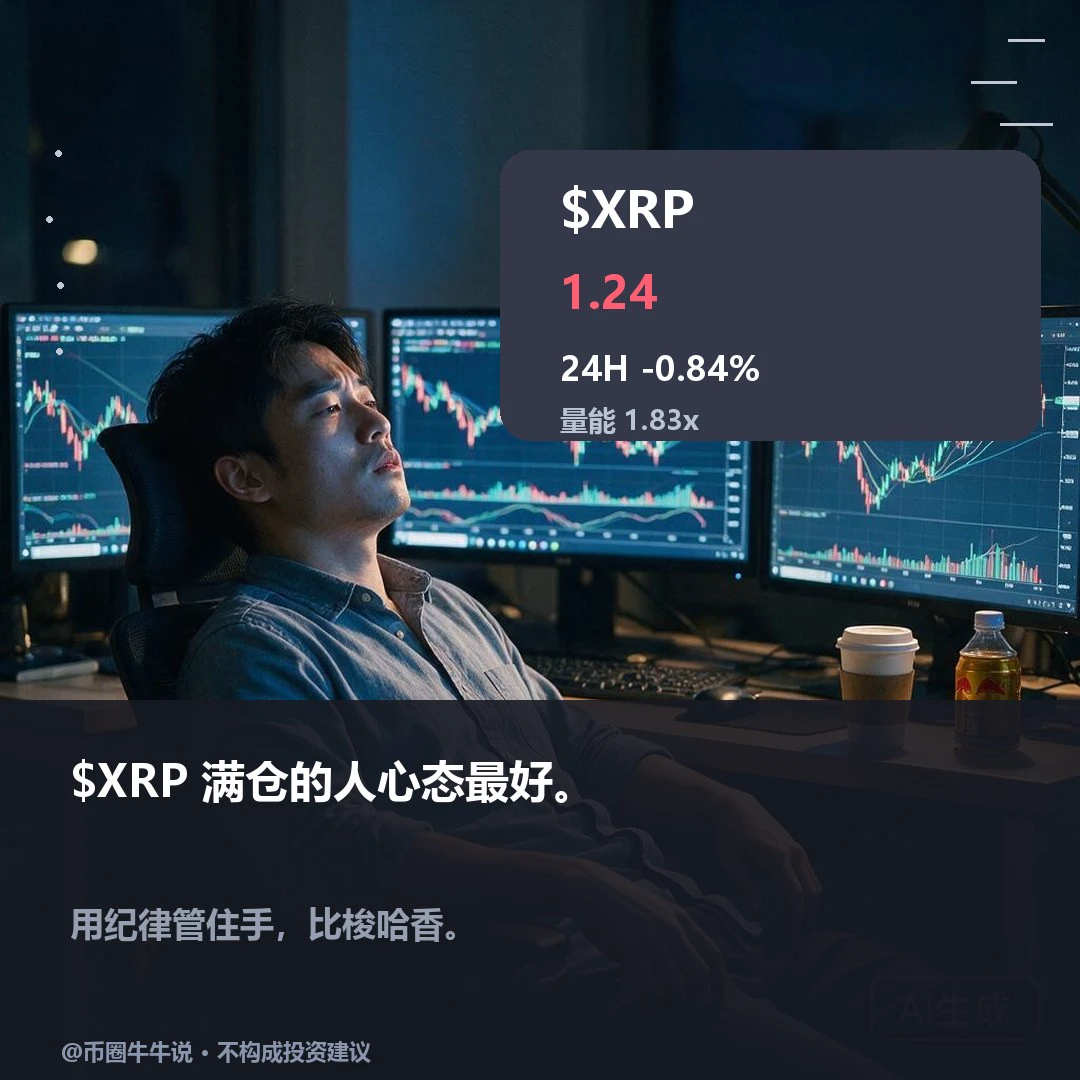
Conflicting signals: $XRP is currently at 1.2443. The one-hour and four-hour trends are both weak, but the price is not far from resistance at 1.26. Pushing above it intraday and holding there are two different things.
Trading is active, but it hasn't sent the price back above resistance, indicating bulls and bears are still locked in a tug-of-war; calling it a confirmed breakout just because it touched resistance intraday is usually premature.
Does a brief intraday push above resistance count as a confirmed breakout?
Only if the price holds above resistance for a sustained period is it worth
post-image
XRP-1.15%
market update
live-cover
LIVE2,218
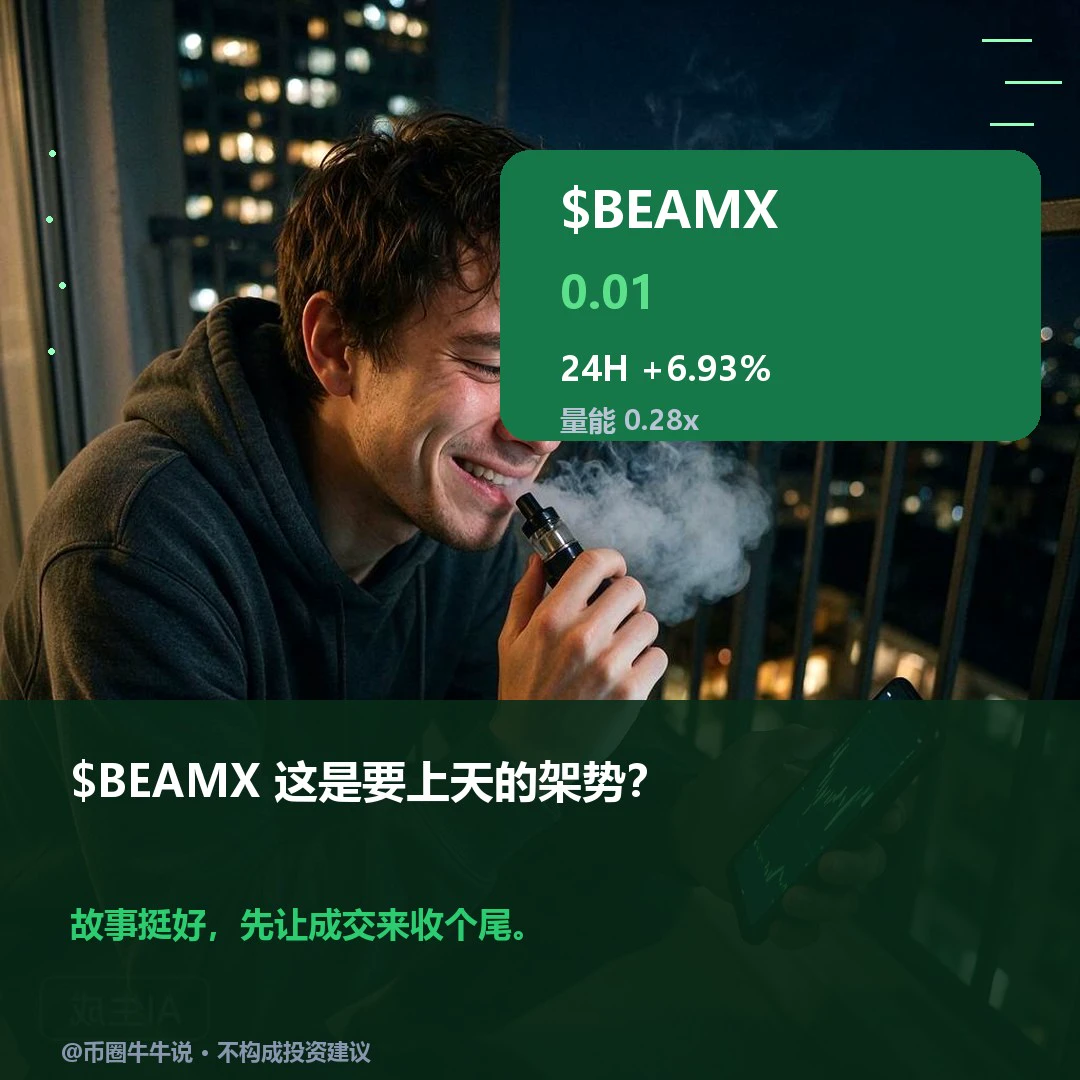
Slightly bullish, $BEAMX is currently at 0.00548, up nearly 7% in 24 hours, but hourly trading volume is less than 30% of average.
The price has already moved, but volume hasn't followed. At times like this, focusing only on the color of the candlesticks can easily lead to overestimating the move's staying power. The one-hour and four-hour trends are both slightly bullish, and the price is above both moving averages, but such low participation discounts the credibility of this move. If bulls are really taking the initiative, why is volume still below 30% of average?
Only if the price holds ste
post-image
BEAMX+5.82%
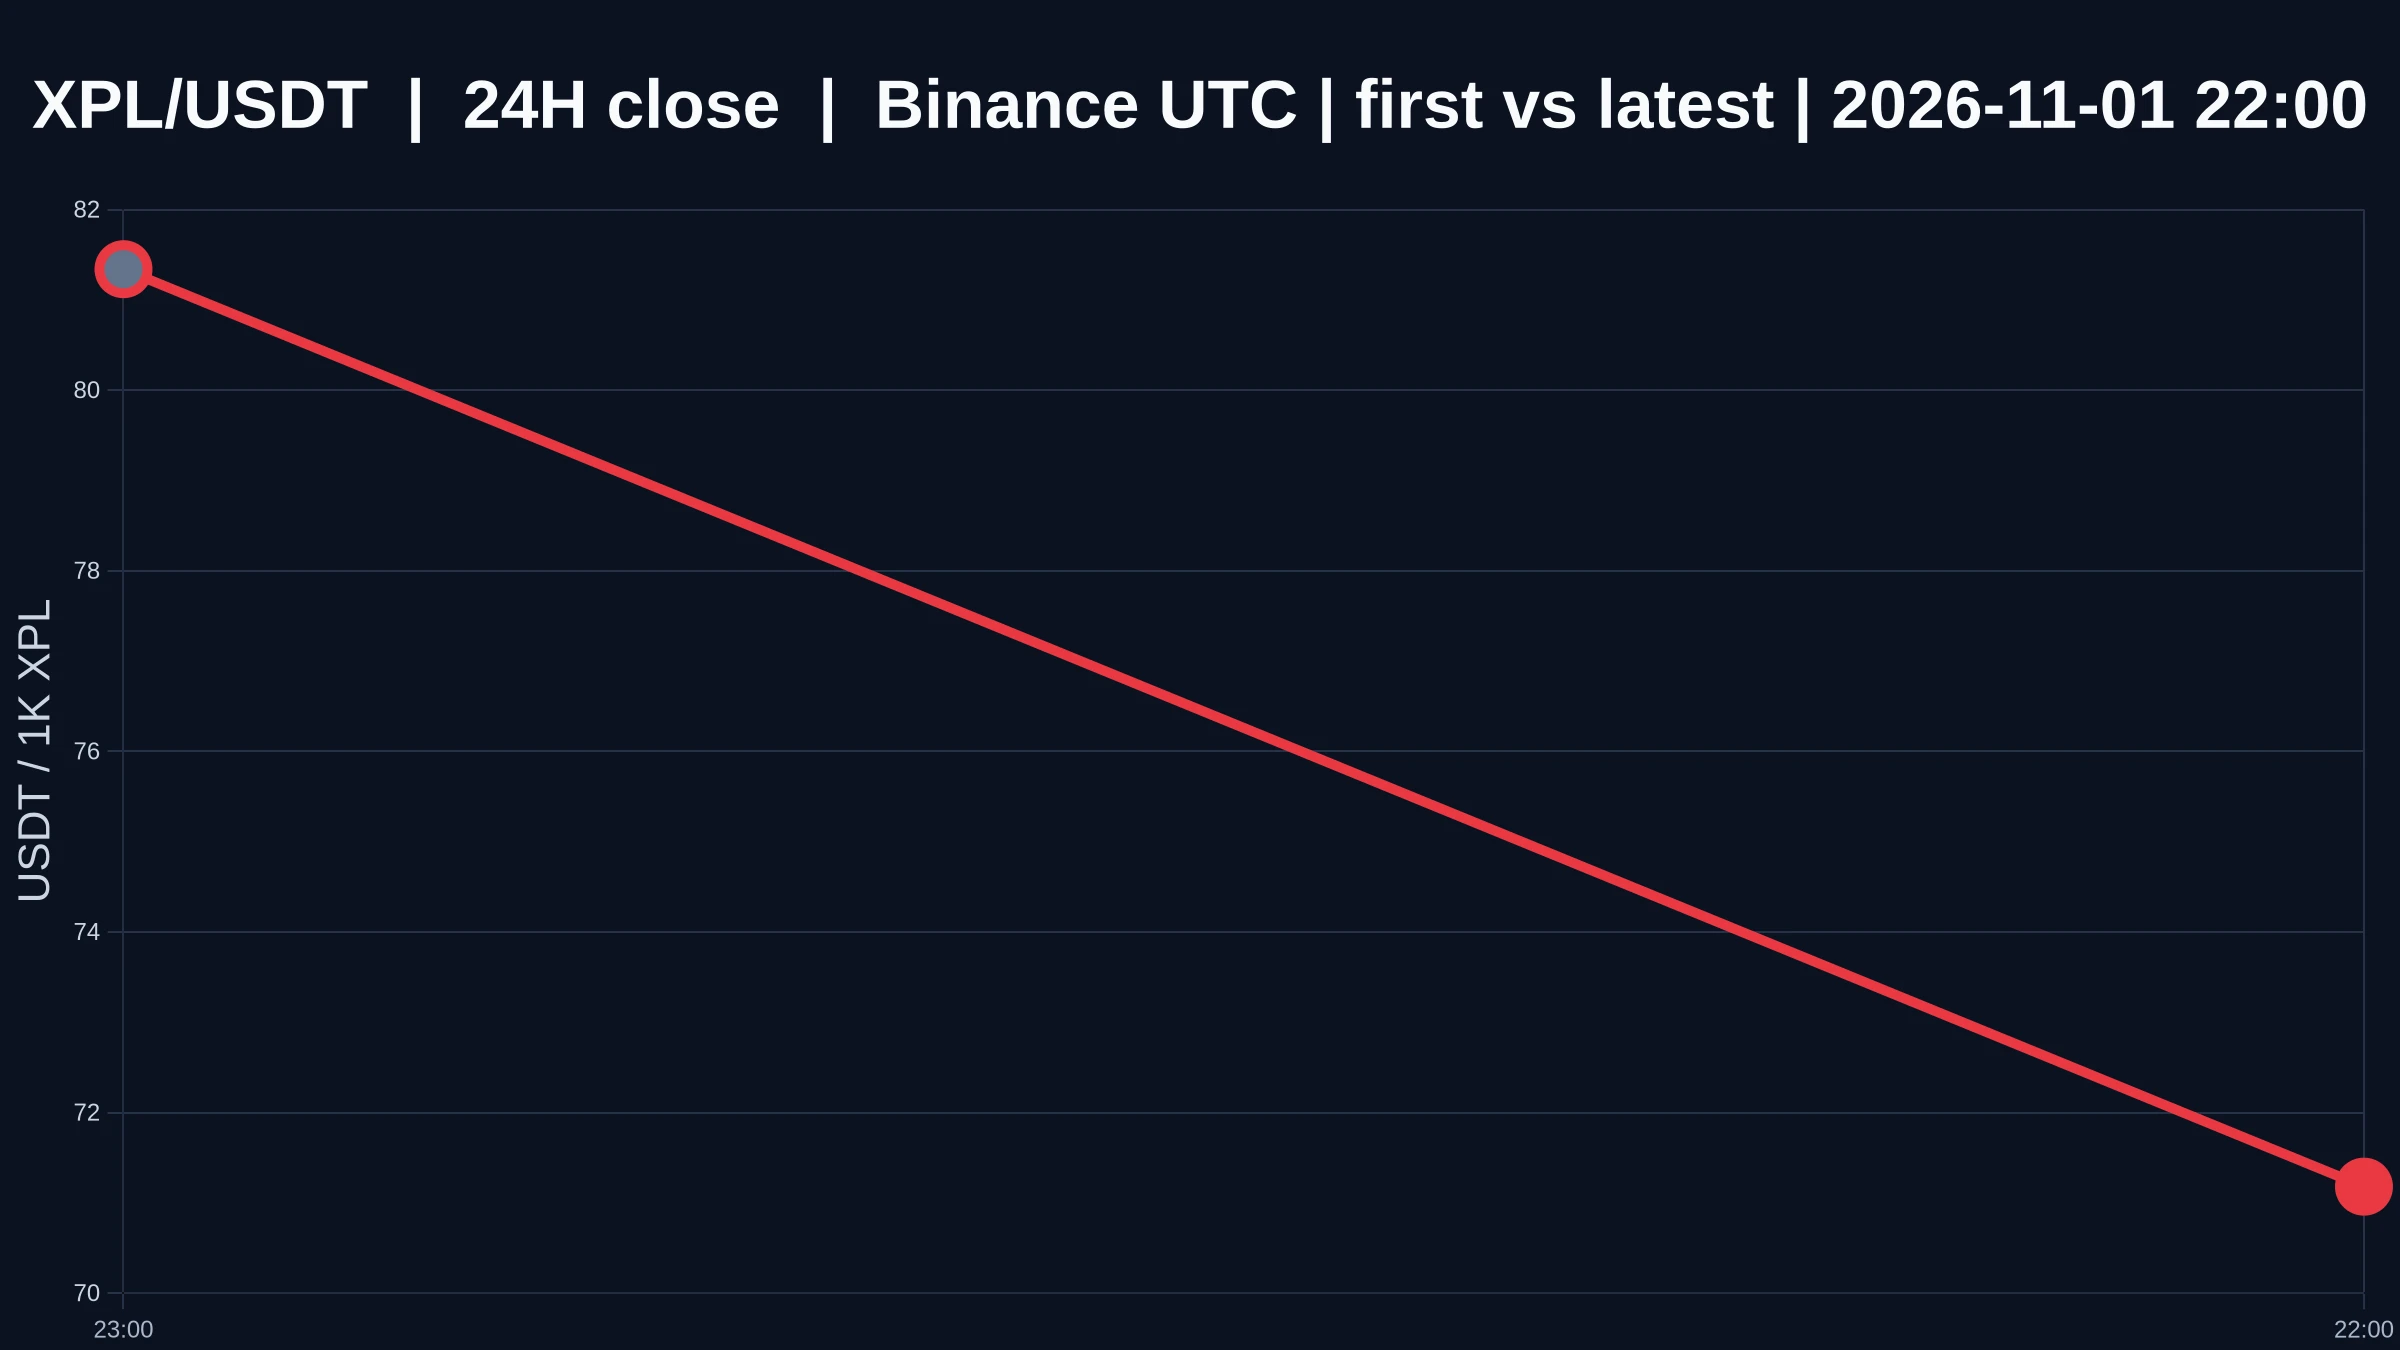
$XPL falls to 0.07117: Where is the evidence of continuation after the sharp drop?
What’s most worth watching on this $XPL chart isn’t the 12.95% drop over 24 hours itself, but that the 1-hour and 4-hour charts are both weak yet haven’t delivered the same answer.
My view is that the sharp move has already happened. The next step is to verify whether it will continue, rather than extrapolating the past 24 hours into the future.
$XPL is currently at 0.07117 USDT, down 12.95% over 24 hours, after falling from 0.08639 to 0.06903 intraday. The 1-hour and 4-hour directions are both weak, while tradi
post-image
XPL-0.60%
Load More

Join 40 M users in our growing community

⚡️ Join 40 M users in the crypto craze discussion

💬 Engage with your favorite top creators

👍 See what interests you

Trending Topics

BTC大跌

537.51k Views39.94k Discussing

$BTC briefly fell below $77,000 and remains under pressure around the $77K zone, with its 24-hour decline still above 4%. With risk appetite weakening and Fed uncertainty rising, where is the next key support after losing $80K?

IntelBeatsEarningsButStockPlunges

50.9k Views1.1k Discussing

StrategySTRCNears100ParValue

59.57k Views4.23k Discussing

View More