Square
Following
Hot
News
Notifications
Profile
Share your thoughts
placeholder
Article
Back then, there were still people to discuss watching the launch with.
Things have changed, and people are gone.
post-image
Newton could never have emerged in China
After all, if Newton had solicited a prostitute
all his laws would have to be taken down
post-image
Trenches
mihao
m
bade
b
mihao
4Cxj...pump
Market Cap
$.
Change
.
24h Vol
$.
Holders
.
FOOD
F
bade
b
FOOD
FTu5...pump
Market Cap
$.
Change
.
24h Vol
$.
Holders
.
IDOL
I
bade
b
IDOL
0x3b...ab07
Market Cap
$.
Change
.
24h Vol
$.
Holders
.
Sakura
S
bade
b
Sakura
9sFG...pump
Market Cap
$.
Change
.
24h Vol
$.
Holders
.
AGT
A
bade
b
AGT
0x5d...e274
Market Cap
$.
Change
.
24h Vol
$.
Holders
.
In BTC trading, many people see the price break through an important resistance level and immediately chase the rally, worried they’ll miss an opportunity to profit. But experienced traders often focus on another important signal after a breakout: the retest.

Why is a retest after a breakout worth paying attention to?

First, it helps verify whether the breakout is valid. After the original resistance level is broken, it may turn into new support. If the price pulls back to this area but does not break significantly below it, that may indicate the market is reconfirming this level’s role as s
BTC-0.67%
Yang Guang bit | Nov 14 ETH Shorts Continue; Short the Rebound
【Today's Strategy】
Entry timing: If the price rebounds to the 1925–1945 zone
Stop loss: 1965,
Tiered take-profit:
First target: 1895–1900
Second target: 1875–1855
【Key Takeaway】
However, risk-off capital is not flowing into the crypto market, and ETH is still priced as a high-risk asset. The weaker risk appetite gets, the more unfavorable it is for ETH. In financial markets, tech stocks remain under pressure, with the Nasdaq leading losses and risk appetite staying weak. On-chain and fund flows: BTC spot ETFs have recorded net outf
post-image
ETH-1.23%
How much further can Bitcoin fall? My view: watch $67,900 first, then decide whether to buy the dip!

Facing this latest Bitcoin downturn, I’m more inclined to remain cautious than to rush to declare either that the bull market is over or that the bottom is in.
The reason is simple: the current macro environment is not friendly. A stronger dollar, rising expectations of Fed rate hikes, and ETF outflows are all weighing heavily on Bitcoin in the short term.
On the other hand, the daily RSI has entered oversold territory, suggesting that short-term selling may be overly concentrated. If positive
NVDA-1.92%
  • 1
On the GROK web version, the former delete conversation window has been changed to an archive conversation window.
User data may be stored separately. Hey @grok, tell me, is this true.
Feeling awful 😣, up and down
At this point, I might as well have two 300-gram Chinese mitten crabs…
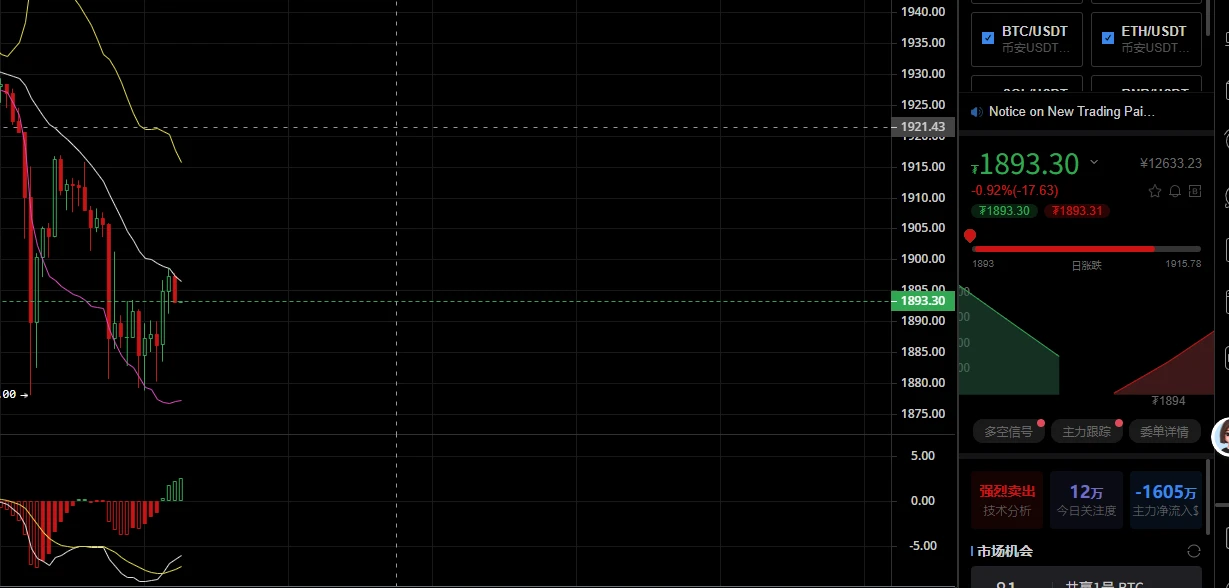
Today, ETH staged a roller-coaster move, plunging rapidly intraday to a low of 1875. After a large number of positions were flushed out, funds stepped in to absorb the selling, driving a V-shaped reversal. The current price has returned to around 1902.

On the 15-minute chart, the price rebounded after falling to the lower Bollinger Band. The MACD formed a low-level golden cross, signaling a short-term oversold recovery, while buy-side support in the order book has the short-term upper hand.
But stay clear-eyed: this is only a recovery on a lower time frame; it does not mean the downtrend is o
post-image
ETH-1.26%
is BTC Losing ita Status
live-cover
LIVE1,231
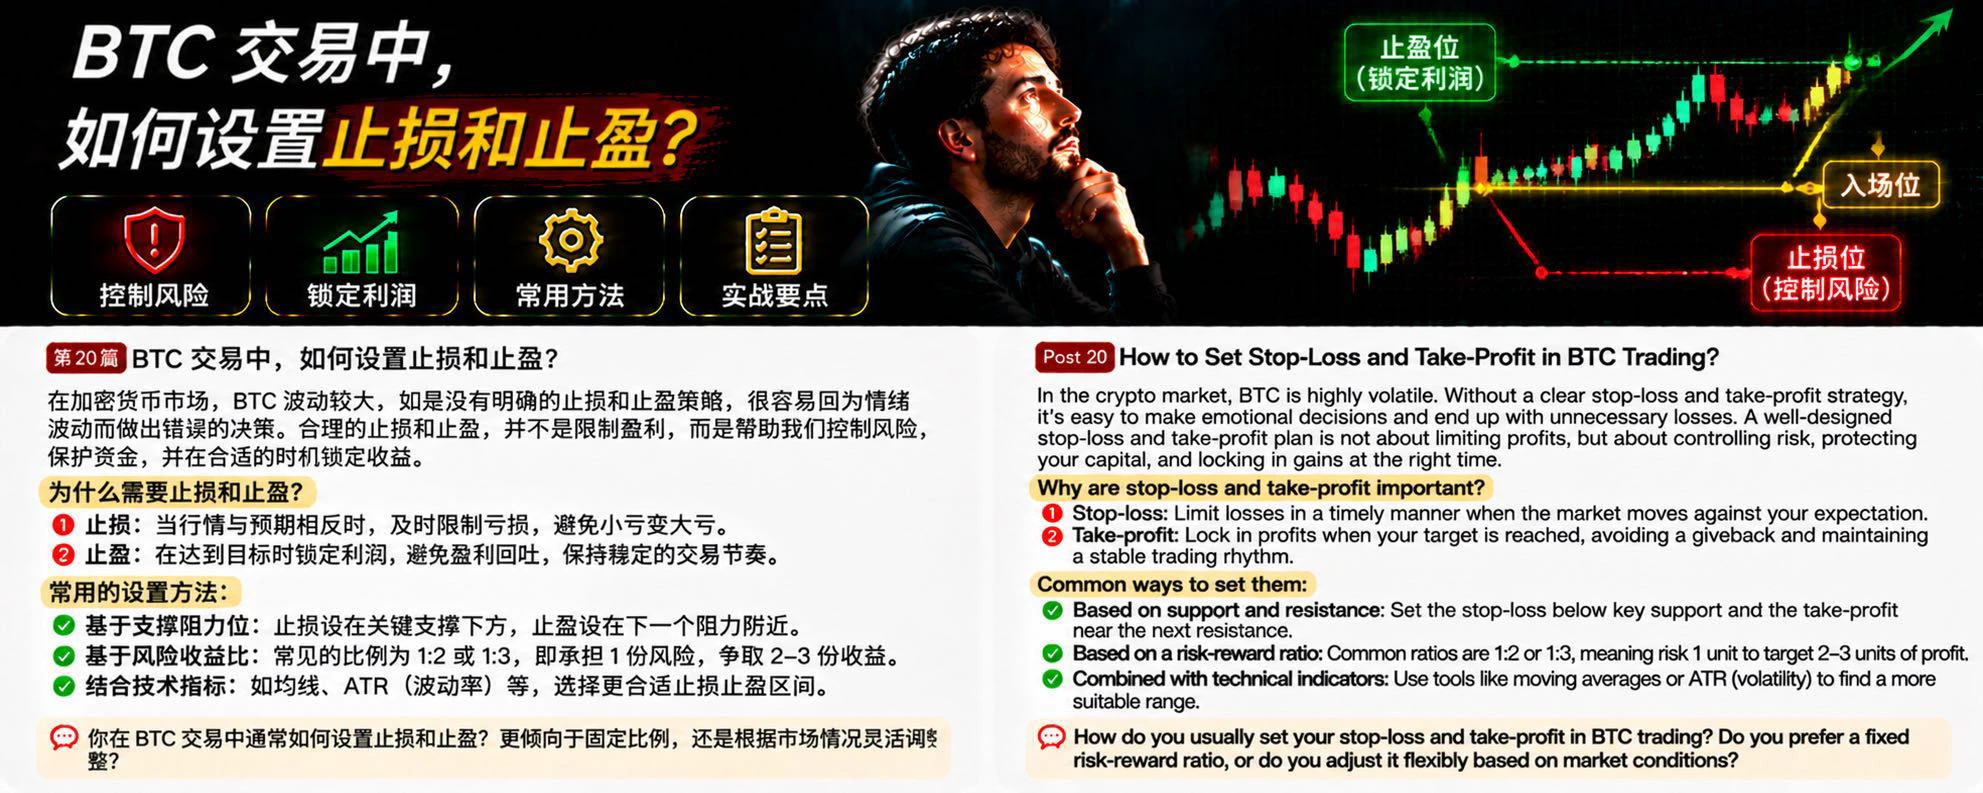
In cryptocurrency trading, many people spend a lot of time studying whether BTC will rise or fall, but overlook a more important question: even if your prediction is correct, without a sound stop-loss and take-profit plan, you may still end up making no money.

Why are stop-losses and take-profits so important?

First, stop-losses are about controlling risk. When the market moves against your view, exiting in time can prevent small losses from growing. This is especially important in futures trading, where leverage amplifies the impact of price fluctuations on your account, so it is crucial to
post-image
BTC-0.65%
When BTC shows bearish divergence, does it mean a drop is imminent?

In BTC technical analysis, bearish divergence is often seen as an early warning that an uptrend may be weakening. But many traders rush to open short positions as soon as they spot bearish divergence, only to see the price keep rising instead of falling and ultimately get caught on the wrong side of the market.

So, how should you interpret bearish divergence?

First, understand the basic principle behind bearish divergence. When the BTC price keeps making new highs, but the highs on the RSI or MACD indicator gradually declin
post-image
BTC-0.67%
11.14 ETH Trade Setup

Entry (two strategies)

- Aggressive short: 1890–1895 range, provided price fails to hold above 1900, rebounds weakly, and closes with a weak candle; abandon this short attempt if it holds above 1900.
- Conservative short (preferred): Wait for a rebound to the 1915–1921 resistance zone, then enter after signs of a stalled rally, a long upper wick, or a bearish top fractal. This offers a more favorable risk/reward ratio.

Stop-loss

- Aggressive position: Set the stop at 1925. A decisive break above this resistance invalidates the short-term bearish thesis; exit.
- Conse
post-image
ETH-1.23%
  • 1
The 5 most common mistakes in BTC trading—beginners must avoid them!

In BTC trading, many people think they lose money because they don't know how to analyze the market. But in reality, many traders still can't make consistent profits even if they understand candlesticks, MACD, and RSI. The problem often isn't a lack of technical knowledge, but repeatedly making the same mistakes while trading.

First, trading with too much or even all of your capital. Many people hope to make big profits quickly from a single trade, but overlook market volatility. If they get the direction wrong, their accou
post-image
BTC-0.67%
Many people equate “a big drop” with “the bottom is in” and rush to buy the dip as soon as RSI approaches 30—mistaking an oversold signal for a reversal signal. Oversold only indicates that short-term selling pressure has been largely released; it does not mean the trend has recovered. To assess whether the trend is healthy, look for the moving averages to first flatten out and then turn upward.

Take $FIL as an example: the current price is 0.6938, and MA5=0.69328 remains below MA20=0.715875, with the moving averages in a bearish alignment—a typical sign that the trend has yet to recover. RS
post-image
FIL-1.99%
INJ-1.67%
BERA-2.60%
Many traders’ first reaction after losing money in their accounts is to make it back as quickly as possible. But there is a very important mathematical point that is often overlooked: the percentage loss and the percentage gain required to break even are not symmetrical.

Suppose your account originally had 1000 USDT.

If you lose 10%, your account is left with just 900 USDT. To get back to 1000 USDT from 900 USDT, you need to gain 100 USDT, or about 11.11%—not 10%.

If you lose 20%, your account is left with 800 USDT, and you need a 25% gain to break even.

If you lose 30%, your account is le
post-image
How to Take Profits in a Bull Market: A Simple, Practical Strategy!

During a BTC rally, many traders face a dilemma: When should they sell? Sell too early, and they worry about missing further gains; sell too late, and they may watch their profits gradually disappear. Rather than trying to sell at the exact top, it’s better to make a plan to take profits in stages ahead of time.

First, set profit-taking targets in advance. Before opening a position, plan profit-taking levels for different stages based on your entry price, risk tolerance, and market structure. Don’t wait until the price has s
post-image
BTC-0.67%
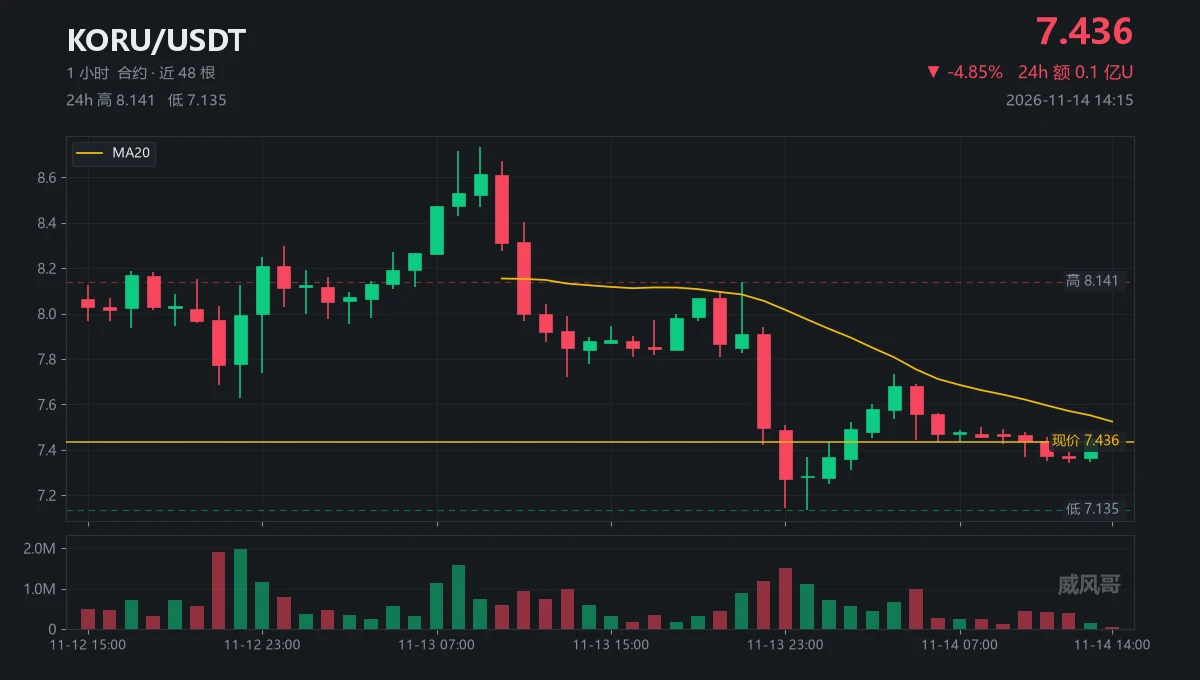
The 05:00 candle closed, and the price just lay down
$KORU 8.141 → 7.135 / happened in one night
Dumped from 21:00 to 23:00 / 2.7 million contracts
The second candle was 1.7x the first / price fell 12.3%
Bounced to 7.734 at 04:00 / on just 656k contracts
The 05:00 closing candle had 995k contracts / pushed it back down to 7.445
The next nine candles / high of 7.561 / never touched 7.6
Now 7.436 / MA20 7.524 / gap of 0.088
14:00 volume was 46k contracts / 8% of average volume
24-hour total was 9.23 million U / that's all the volume
Weekend / Seoul is closed / New York is closed too / nobody to
post-image
KORU-1.22%
  • 2
  • 1
Eat and drink well—today we're having a whole roasted lamb.
We'll deal with the market after we eat. In this life,
there's more to it than just trading.
post-image
Bitcoin on 11/14:

The weekly price fell below the middle Bollinger Band, retreating rapidly from the high near 87370. The broader trend has weakened after turning lower from an uptrend. The KDJ J value has entered negative territory, putting the weekly chart in oversold territory and leaving room for a rebound; however, K and D have yet to turn up and form a golden cross, so a trend reversal signal is not yet confirmed.

Trading recommendation:

Short at 68000-67500, target 66000-65000, stop-loss 68300

(Market conditions are volatile; for reference only!)
post-image
BTC-0.67%
Load More

Join 40 M users in our growing community

⚡️ Join 40 M users in the crypto craze discussion

💬 Engage with your favorite top creators

👍 See what interests you

Trending Topics

GateIPOAccessAnthropic

303.4K Views2.8K Discussing

Gate IPO Access Phase 3 features Anthropic (ANT), with USDT subscription interest starting from 100 USDT. Successful allocations will be delivered as real shares to Gate Stock Accounts. Indicative price: $70–$78/share Subscription: Nov 12–17 (UTC+8) Allocation is not guaranteed. Please manage risk accordingly.

Dr.HanOxfordUnionSpeech

147K Views581 Discussing

USOctoberPPIBelowExpectations

460.5K Views1.4K Discussing

View More