
Square
Following
Hot
News
Notifications
Profile
Share your thoughts
placeholder
Article
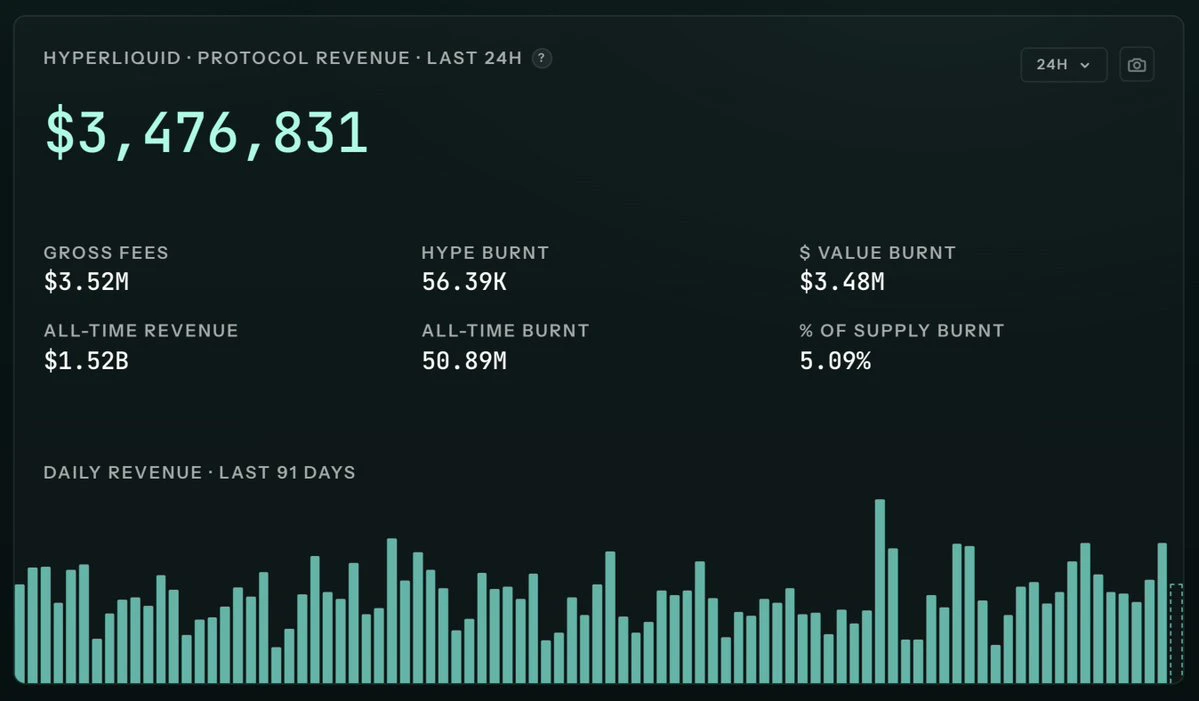
$HYPE is down 40%, but hyperliquid still makes $3M+ a day in revenue
what is zcash doing these days
post-image
HYPE+0.24%
ZEC+1.16%
[NEW STREAMER]market update
live-cover
LIVE29
BTC-0.67%
Trenches
IDOL
I
bade
b
IDOL
0x3b...ab07
Market Cap
$.
Change
.
24h Vol
$.
Holders
.
PIEVERSE
P
bade
b
PIEVERSE
0x0e...25a9
Market Cap
$.
Change
.
24h Vol
$.
Holders
.
FIONA
F
bade
b
FIONA
B34n...pump
Market Cap
$.
Change
.
24h Vol
$.
Holders
.
Singularity
S
bade
b
Singularity
7R4M...pump
Market Cap
$.
Change
.
24h Vol
$.
Holders
.
CLAUDIA
C
bade
b
CLAUDIA
2j5S...W2ZM
Market Cap
$.
Change
.
24h Vol
$.
Holders
.
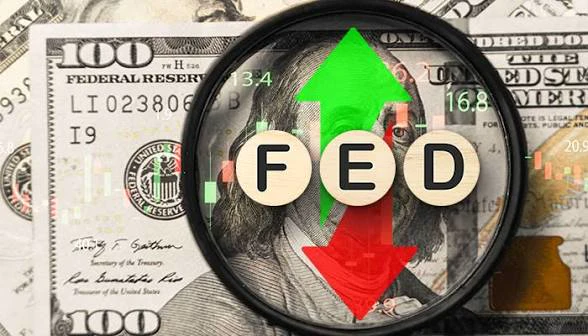
Last Friday, November 20, Fed Governor Lisa Cook delivered a clear message to the market: "I do not see sufficient evidence that inflation is returning to the target, and we do not have the luxury of waiting." Cook, who was one of two officials to vote for a rate hike at the October meeting—arguing that the 25-basis-point increase in September was insufficient—has now raised the prospect of a "more aggressive tightening cycle," going beyond the rate hike the market already considers a certainty for December.

Persistence Beyond Expectations

The most striking point in Cook’s remarks is that in
post-image
BTC-0.67%
GT-2.41%
ETH-1.26%
ZEC+1.16%
PEPE+0.97%
  • 4
  • 3
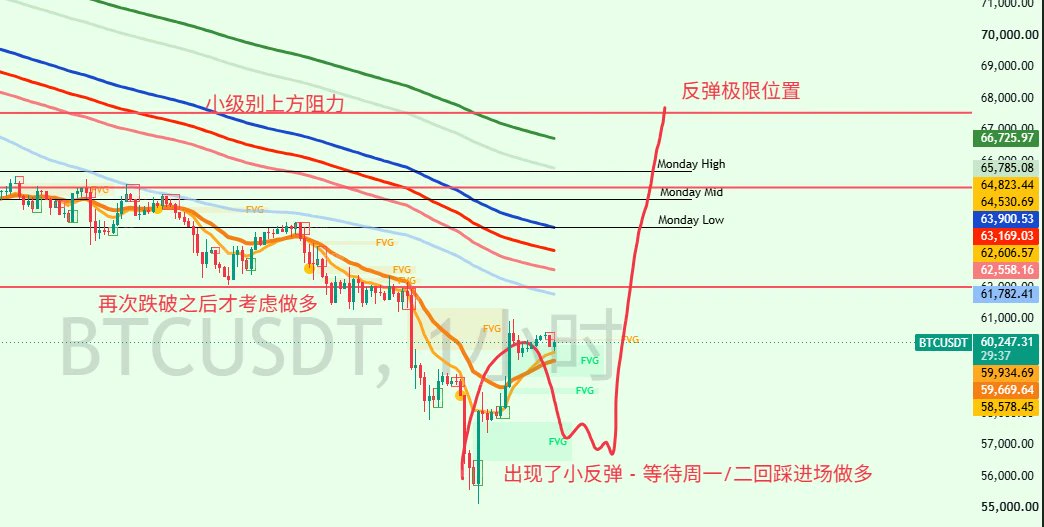
Short-term view on $BTC and U.S. stocks: Bitcoin’s realized price is at $53,000, and the long-term holder cost basis is $48,000. This crash took it from $87,000 to $55,000, a drop of $32,000 already. Even if it falls another $10,000, averaging down means you still wouldn’t be at a loss if it rebounds to $60,000. Bitcoin’s 3-day and 5-day moving averages and weekly KDJ are all already negative, so a rebound could happen at any moment. Wait for a Fibonacci retracement bounce before considering shorting. Given the current market, BTC is only one wave away from completing its seven-wave pattern o
post-image
BTC-0.67%
NAS100-0.07%
BTC Market Outlook
Wait for a Pullback to Go Long
After two weeks of waiting, we’re finally nearing a bottom, and the market has seen its first rebound of around 10%—though it was only 5,000 points, it’s still encouraging
Many believe BTC will continue falling below 48,000. I don’t rule out that possibility, but I also think the market will rebound next Monday or Tuesday. At the very least, “there’ll be a rebound to trade”
This rebound is in sync with the rebound I expect in U.S. stocks
After the VIX rose on Friday, I think U.S. stocks will continue falling until intraday Monday or before the
post-image
BTC-0.67%
  • 1
After weeks of a quiet, gradual erosion, the price of gold appears to have suddenly plunged off a cliff. A look at the charts reveals that the price has retreated to the $3,500 level, marking a weekly decline of approximately 9%—its worst performance in 34 weeks. Moreover, this drop is merely the latest chapter in a massive, roughly 37% meltdown that gold has experienced since reaching a historic peak of over $5,500 in January.

So, why has this "safe haven"—a place we typically turn to during times of chaos—let us down now? The answer lies in a much larger and more ruthless struggle currently
GVZ+2.87%
XAUT+0.30%
PAXG+0.37%
XAU+0.38%
XAUUSD-2.40%
  • 11
  • 3
$IDOL 's price action gave a very typical signal: when open interest contracts rapidly and buyers keep failing to reclaim hourly resistance, momentum is already fading. I timed this exhaustion move pretty well, taking profit at 129%, for a profit of $KakaoBank.
The parabolic rally is over, and the long squeeze is officially underway. Now is the window to short in the direction of the downtrend. $IDOL Short setup: entry range 0.038756–0.039609, targets at 0.035035 and 0.031717, with a stop-loss at 0.042299. Keep in mind that extreme volatility may trigger stop-losses before the final leg down, an
post-image
IDOL-6.71%
KakaoBank+1.16%
  • 1
#每周来晒 #Gate直通IPO第三期ANT配售92100股
Gate Direct IPO Phase 3 Allocates 92,100 ANT Shares: Another Important Step in Expanding Access to New Investment Opportunities
The latest development in Gate Direct IPO Phase 3 has attracted attention from the cryptocurrency community after the allocation of 92,100 shares of ANT. This announcement highlights the growing interest in connecting traditional financial markets with the digital asset ecosystem. Through innovative investment platforms and IPO-related services, Gate continues to explore new ways to provide users with access to emerging financial oppo
ANT-8.68%
Fear Grips Global Markets as Wall Street Approaches a Critical Point
live-cover
LIVE71
BTC-0.67%
ETH-1.26%
USDC+0.01%
XRP-1.15%
NBA & NFL best week I can remember.
Is this day and age I should start charging $999.98 a month now right?
post-image
$CRCLB The one-hour RSI is nearing 70, signaling relative strength, while the four-hour RSI has fallen to 24.73, deeply oversold. The two timeframes give completely opposite signals. It’s up 1.49% over 24 hours, but the volume ratio is only 0.11—a clear low-volume rebound. I won’t chase shorts. At the current price of 49.07, closing shorts here would just mean selling at the lows to those taking the other side. The rebound target is set at the one-hour resistance level of 49.88, with a stop-loss at the intraday low of 45.23; if it breaks below that, I’ll admit defeat. An oversold rebound on l
post-image
$TAO Short thesis update: 186 is a resistance zone on the 4-hour chart. Price has already hit my take-profit target, so I’m watching closely now. If a 4-hour candle closes above 189, I’ll abandon the bearish view.
The current 4-hour price is 185, below the EMA50 (193), and bears still control the momentum. The stop-loss distance is about 1.8%, with 2.9% room to the third target. If TP3 is reached, the risk-reward ratio would be around 1.6R.
Short entry range: 185.2–185.6. Staggered targets: 183.4 → 182.1 → 180.1. Structural invalidation: 188.7
Where would you place your stop loss? This is not
post-image
TAO+0.41%
Hot hot hot 🚨🚨🚨$NAORIS continues to surge, with steady momentum—great for a short-term long trade. $PIEVERSE sees another strong rally during its Alpha campaign, making it a good opportunity to ride the long trend for a while. $VVV is still climbing strongly, so I’m hopping aboard the long trade and riding the wave. 📈📈📈
post-image
NAORIS+0.66%
PIEVERSE+0.58%
VVV+0.37%
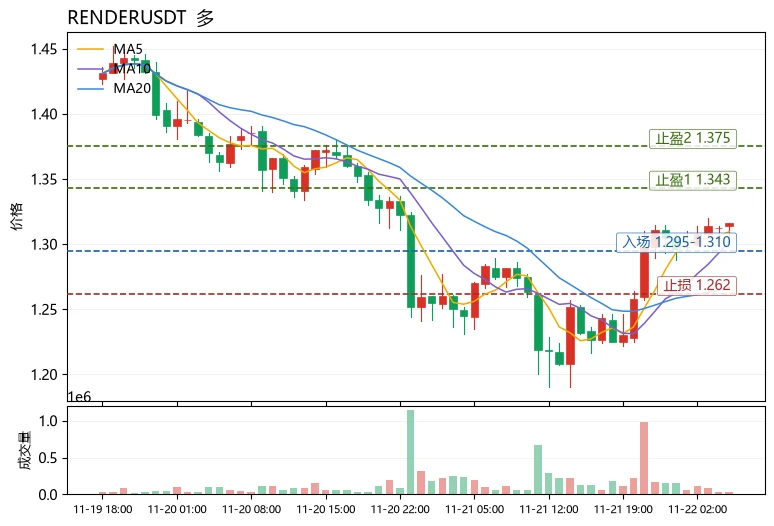
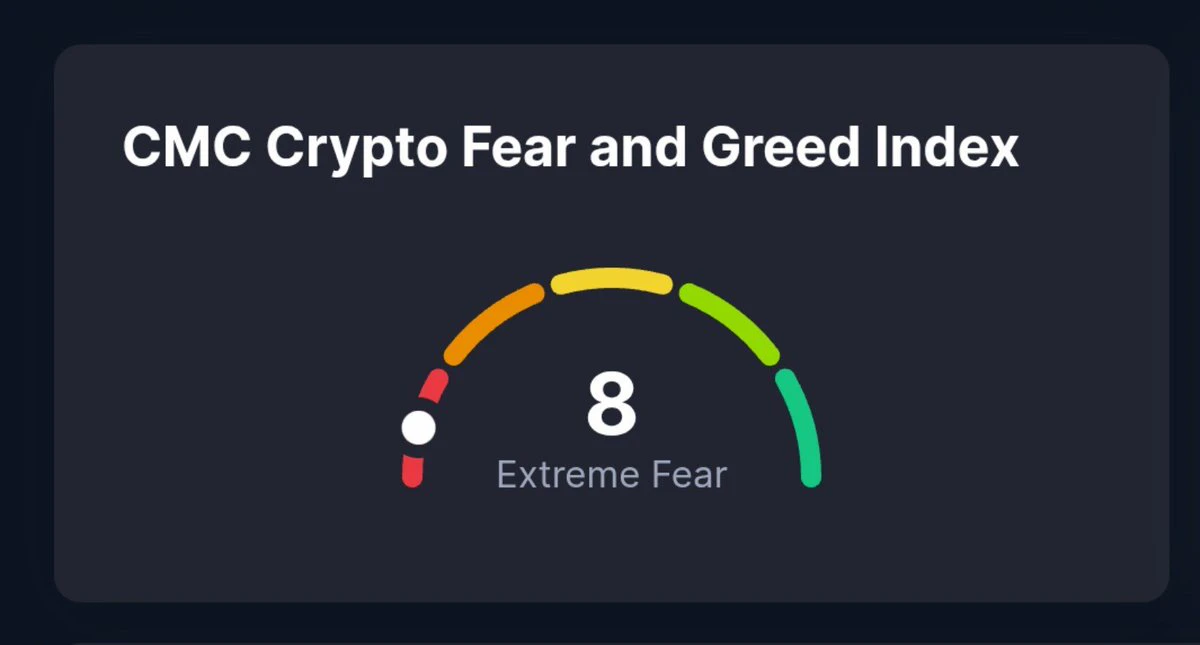
Fear and Greed Index is only 12, and the market is in the extreme fear zone, yet $RENDER bucked the trend and rose 3.62%—this divergence is the most unusual detail in today's market. Funds are not pulling out amid fear, suggesting bulls are quietly accumulating.
Technically, $RENDER is currently at 1.316, with MA5=1.3096 above MA20=1.2666, indicating a bullish short-term moving average alignment; RSI=59.0 is strong but not overbought, while the MACD histogram at +0.009781 maintains bullish momentum. The upper Bollinger Band at 1.34351 is the immediate resistance, and the price is trading near
post-image
RENDER+0.47%
DODO+11.43%
RARE-0.89%
Driven by active trading volume, price action continues to edge higher; despite limited overall market participation, resistance remains intact. The uptrend is showing initial momentum, but the indicators have yet to fully align, suggesting the move may stall. $AKE — Long entry: 0.005343 Take-profit 1: 0.005401 Take-profit 2: 0.005450 Stop-loss: 0.005129
post-image
AKE+6.07%
Madoff’s $65 billion on paper ultimately amounted to just $18 billion in actual money. He was sentenced to 150 years. A Wall Street legend and former Nasdaq chairman, he spent 30 years running a scam right in the middle of industry forums. The details hold the answer: the shinier the title, the less anyone checks the books. Next time someone cites “former chairman” as an endorsement, ask where their money is custodied. What do you think?
post-image
  • 2
  • 1
U haven't felt enough pain yet
Buckle up alt coiners
$btc
post-image
BTC-0.67%
3372.56@开户以来, that's a huge loss
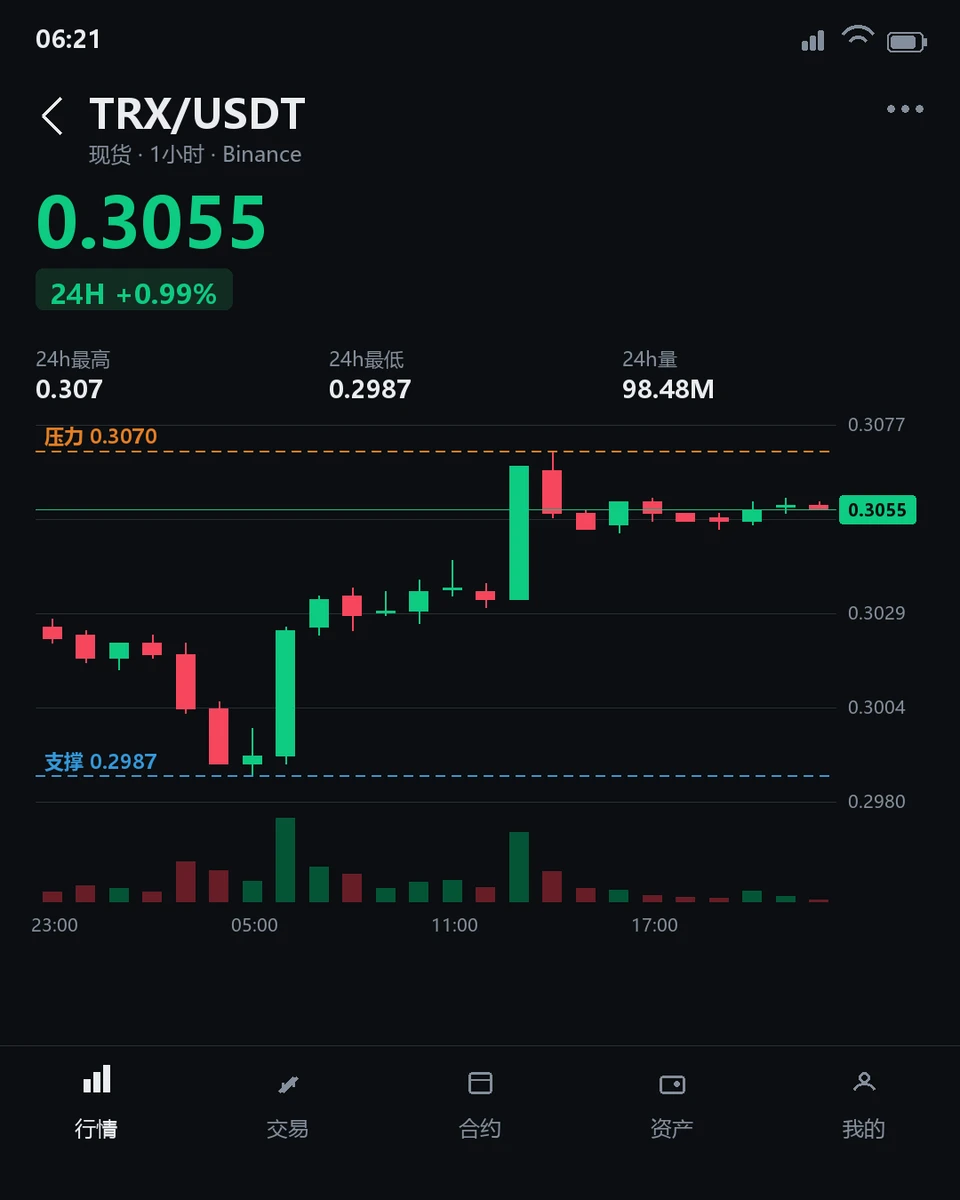
$TRX Is Strong in the Short Term but Weak on the 4-Hour Chart—Which Will Turn First?
$TRX is currently trading at 0.3055, up 0.958% over the past 24 hours, with an intraday range of 0.2987–0.307. The 1-hour chart shows strength, with the price above the EMA20 at 0.30456. The RSI14 is 67.53, in neutral-to-bullish territory, but the volume ratio is just 0.21, far below average, indicating limited participation from short-term buyers. The 4-hour chart remains weak: the price is still below the EMA20 at 0.30594, and the RSI14 at 37.21 has yet to recover from weak territory. Resistance is far above
post-image
TRX+0.42%
Load More

Join 40 M users in our growing community

⚡️ Join 40 M users in the crypto craze discussion

💬 Engage with your favorite top creators

👍 See what interests you

Trending Topics

BTCBreaksBelow60K

2.1M Views30K Discussing

BTC fell below $60,000 on November 20 for the first time since July, alongside a tech stock selloff and broader pressure on risk assets. Will $60K become resistance, or can BTC quickly reclaim it? What price or volume signals would convince you that selling pressure is easing?

GateDirectIPOPhase3ANTAllocates92100Shares

797.2K Views4.9K Discussing

NvidiaDropsNearly14Percent

333.9K Views7.6K Discussing

View More