
Square
Following
Hot
News
Profile
Share your thoughts
placeholder
Article
New users 100% win! Climb the leaderboard and split 15,000 USDT!
Limited rewards—the more & better you post, the more you earn!
3 Key Rewards:
1️⃣ First-Post Bonus: 100% win rate, up to 10 USDT Red Packets.
2️⃣ Daily Top Picks: 3 creators daily get a 100 USDT coupon + official interact.
3️⃣ Monthly Board: Share 10,000 USDT & Gate merch (T-shirts, umbrellas, mugs).$MU
post-image
GateSquare
🧧 Up to 10 USDT—Gate Square’s newcomer red packets are here today!
100% chance to claim, and get on the leaderboard to share 15,000 USDT and exclusive Gate merchandise!
Red packets are limited and available on a first-come, first-served basis—the more you post, the more you can claim!
Triple event benefits
1️⃣ First post bonus: 100% chance of winning, including 10 USDT and 3 USDT large red packets
2️⃣ Daily quality leaderboard: 3 winners selected daily, each receiving a 100 USDT trial voucher + official interaction
3️⃣ Monthly creator leaderboard: Share 10,000 USDT and Gate T-shirts/umbrellas/water bottles
✍️ Market insights, trade recaps, hot-topic opinions—create by writing whatever you think!
Post now 👉️ www.gate.com/post
Event details: https://www.gate.com/announcements/article/102256
repost-content-media
MU-5.66%
Good afternoon!
After making $44.84 million, Machi is now down $36.85 million and has been liquidated on Hyperliquid again.
On October 18, according to Lookonchain, Huang Licheng was completely liquidated again, nearly losing the 250,000 USDC he deposited two days ago.
The cruelest part of high-leverage trading is that past profits cannot protect future positions. Once the market turns against you, no matter how much you’ve made, you could give it all back through a string of losses—and even lose your principal.
Trading isn’t about who has made the most in the past; it’s about who can stay at
post-image
USDC+0.03%
Trenches
AGT
A
bade
b
AGT
0x5d...e274
Market Cap
$.
Change
.
24h Vol
$.
Holders
.
TSI
T
bade
b
TSI
0xf1...7b07
Market Cap
$
Change
.
24h Vol
$.
Holders
.
CNPY
C
bade
b
CNPY
0xc6...ddd2
Market Cap
$.
Change
.
24h Vol
$.
Holders
.
Q
Q
bade
b
Q
0xc0...0589
Market Cap
$.
Change
.
24h Vol
$.
Holders
.
Gato
G
bade
b
Gato
55A3...pump
Market Cap
$.
Change
.
24h Vol
$.
Holders
.
crypto gainers and lossers update
live-cover
LIVE1,697
Over the past few days, $ETH started from around $1,850 in the first stage, surged as high as $2,807.67, and completed a clear upward trend.
However, it failed to break through around $2,808 and then continued to retreat, falling below the EMA20 and EMA50.
The previous upward structure has been disrupted, and the short-term trend has shifted from strong to weak.
The current price is around $2,418. Although the daily chart has seen a slight rebound, MACD remains in negative territory.
Therefore, for now, this can only be viewed as a recovery during the decline, with no clear trend-reversal sig
post-image
ETH-0.12%
Q has been making large on-chain withdrawals over the past two days
It has withdrawn $5 million on-chain over the past 30 days
All of them were multiple small transactions, making the activity highly discreet
Only my bot can analyze it
It is impossible to see with the naked eye that Q is making large withdrawals
post-image
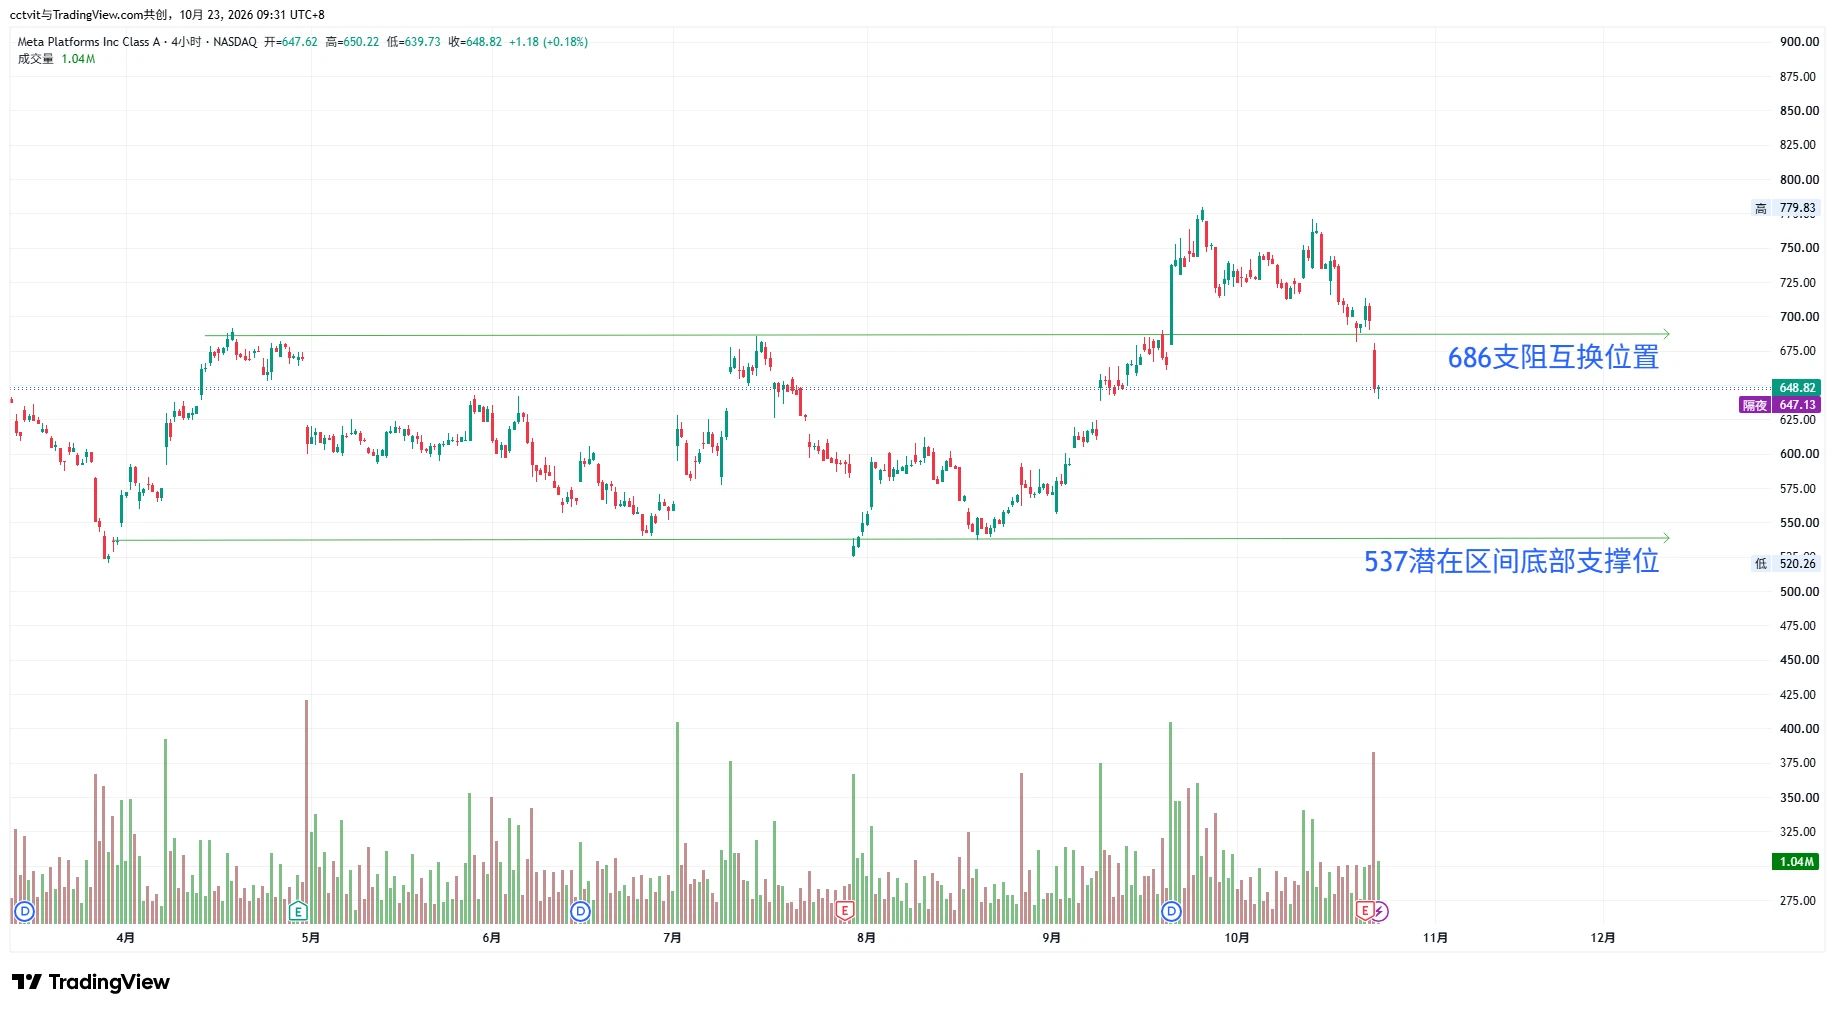
#SNXX This is so frustrating—the 8.2 limit order I placed didn't get filled; the low was 8.201. Consolation, please. Buying the dip on the other semiconductor wicks felt great
post-image
SNXX-14.10%
#美股存储板块跌幅扩大 #ShareWeekly
US Memory Stocks Extend Their Decline: Is the AI Investment Boom Facing a Reality Check?
The US stock market is drawing attention as losses in the memory chip sector continue to widen, raising questions about semiconductor valuations, the sustainability of AI-related demand, and the outlook for technology stocks.
Memory chips have become a critical component of the global technology industry. From AI data centers and cloud computing to smartphones, personal computers, and enterprise storage, modern digital infrastructure depends on efficient memory solutions. As artif
DRAM-1.37%
#BTC跌破8.2万 Technical read at $81,668: what the chart says about 81K and 80K
BTC is trading near $81,668, and the question on everyone's screen is whether 81K can hold or 80K gets tested next. Here is the technical picture, level by level, with no guesswork.
Where we came from
Early October looked bullish. BTC ran toward $87,000, then was rejected near that level on October 5, which triggered a cascade of leveraged long liquidations. The week's high was $84,323.70 on October 12, and the low was $79,841.60 on October 15, right after the hot CPI (3.7% year over year, core 2.6%). That is a 5.6% we
post-image
Falcon_Official
#BTC跌破8.2万 Bitcoin at $81,570: Has the CPI Shock Been Priced In, or Is $80,000 the Next Test?
Bitcoin’s move below $82,000 has shifted the market’s focus from the possibility of a $90,000 rally to the strength of the current support structure. Trading near $81,570, BTC is facing a combination of renewed US inflation pressure, changing Federal Reserve expectations, and uncertainty over leveraged positioning. The critical distinction is whether the market has already absorbed the inflation shock or whether another round of selling could follow.
September CPI Changed the Macro Picture
The US Bureau of Labor Statistics reported that headline CPI increased 3.7% year over year in September, accelerating from 3.4% in August. Monthly inflation reached 0.6%, compared with 0.4% previously. Core CPI, excluding food and energy, rose 2.6% annually and 0.3% monthly.
Energy was a major contributor. Gasoline prices climbed 9.1% in September, accounting for more than half of the monthly increase in headline CPI. The energy index advanced 5.2% during the month, while shelter costs increased 0.4%.
These figures complicate the outlook for monetary easing. Persistent inflation can keep interest rates restrictive for longer, potentially supporting the dollar and Treasury yields while reducing investors’ appetite for risk-sensitive assets.
However, the inflation report does not automatically guarantee another rate hike. The Fed must evaluate incoming economic data, employment conditions, and the persistence of price pressures before determining its next move.
Why BTC Fell Below $82,000
Bitcoin’s decline reflects the sensitivity of crypto valuations to macroeconomic expectations. When inflation exceeds forecasts, markets may reassess the timing of rate cuts or the possibility of further tightening. Higher expected borrowing costs can make speculative positions less attractive, particularly when leverage is elevated.
Market reporting following the CPI release showed Bitcoin falling to approximately $80,247 before trading around $80,743 in the subsequent session. BTC has since approached the $81,570 level referenced here, but a recovery from the lows alone does not confirm a trend reversal.
The key question is whether buyers are returning through sustained spot demand or whether the rebound is primarily driven by short covering. These two scenarios can produce similar price action initially but have different implications for durability.
The $81,000–$80,000 Support Test
At approximately $81,570, Bitcoin is close to an important psychological area. The $81,000 region deserves attention as a near-term reference, while $80,000 is the next major round-number level traders may monitor if selling pressure resumes.
A sustained recovery above $82,000, supported by stronger spot volume and improving market breadth, would help repair the short-term structure. If BTC repeatedly fails to reclaim that level, sellers may retain control and the market could revisit lower support.
A break below $80,000 would increase downside risk, but it would not automatically establish a prolonged bearish trend. Confirmation would require examining subsequent price acceptance, trading volume, and whether buyers defend the breakdown area.
These levels are technical reference points, not guaranteed turning points.
Liquidations and Leverage: The Hidden Risk
During sharp declines, leveraged long positions can face liquidation as collateral becomes insufficient. Forced selling can amplify downward momentum, creating a feedback loop in which falling prices trigger further position closures.
Open interest helps distinguish between different forms of selling pressure. If BTC declines while open interest contracts sharply, traders may be closing positions or being liquidated. If open interest rises during the decline, new positions may be entering the market, although the direction of those positions cannot be established from open interest alone.
Funding rates provide additional context. Persistently positive funding during weakening price action may indicate that long exposure remains crowded. A reduction in funding and leverage could help stabilize market conditions, but it would not independently confirm a bottom.
Is the CPI Shock Already Priced In?
Markets often react to the difference between expectations and actual data, not simply to whether a headline looks positive or negative. Some of the inflation risk may already be reflected in Bitcoin’s decline, but that cannot be established from price alone.
If Treasury yields stabilize, the dollar loses momentum, and BTC reclaims $82,000 with credible spot demand, the market could begin recovering from the initial shock. If inflation concerns intensify and leveraged positions continue unwinding, $80,000 may come into focus instead.
The most important signal is confirmation across macroeconomic conditions, spot activity, and derivatives positioning.
At $81,570, Bitcoin is at a decision point rather than a confirmed bottom. Preserving capital, controlling leverage, and waiting for price confirmation are more defensible approaches than assuming either an immediate rebound or an inevitable breakdown.
repost-content-media
BTC+0.45%
  • 4
  • 1
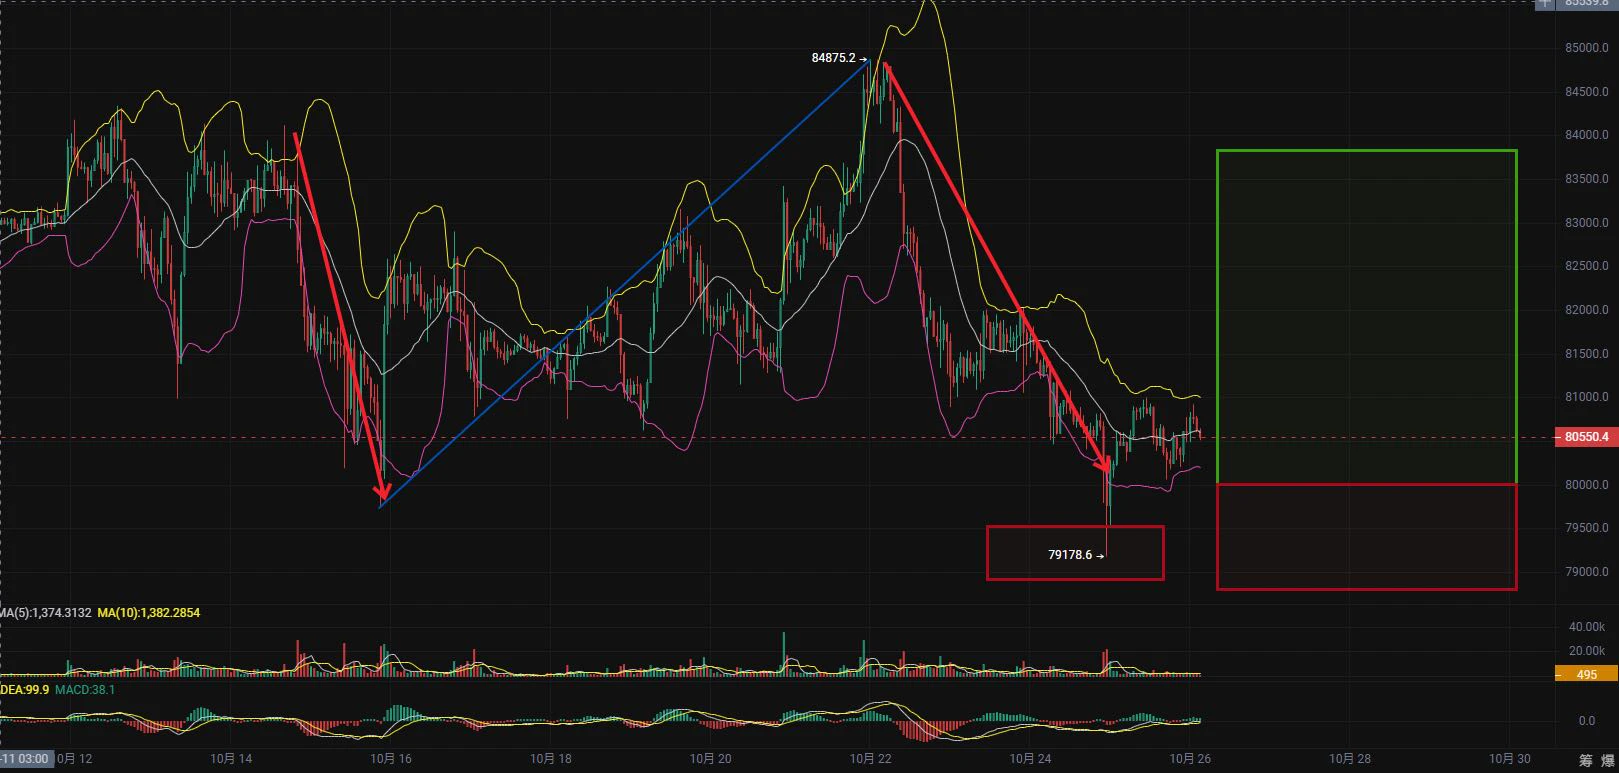
A choppy, grinding market! It’s showing clear signs of stabilizing now—pump first, then dump, the same old playbook! #比特币
post-image
BTC+0.45%
  • 1
$XMR is surging! $600 is the next major test!
Everyone, I’m watching $XMR for a potential long opportunity. Buyers are mounting a strong offensive, and momentum looks fierce! Entry: $588–594 First target: $600 Second target: $610 Third target: $625 Stop-loss: $578 If $XMR breaks above $600 and holds, it could climb further. Watch for a pullback after this sharp rally.
post-image
XMR+0.00%
#沃什IMF讲话 #ShareWeekly
Warsh’s IMF Speech: What Could It Mean for Inflation, Interest Rates, Bitcoin, and Global Markets?
Global financial markets are paying close attention to monetary policy as investors evaluate inflation risks, interest rate expectations, and the future direction of the US economy. Against this backdrop, has become an important topic for market discussion, particularly among investors following Bitcoin, technology stocks, gold, and other risk-sensitive assets.
Remarks by Kevin Warsh at an International Monetary Fund event can attract attention because markets are constantl
post-image
BTC+0.45%
XAU-0.10%
$LSK Is this rally a trend reversal or a reversion to the moving average?
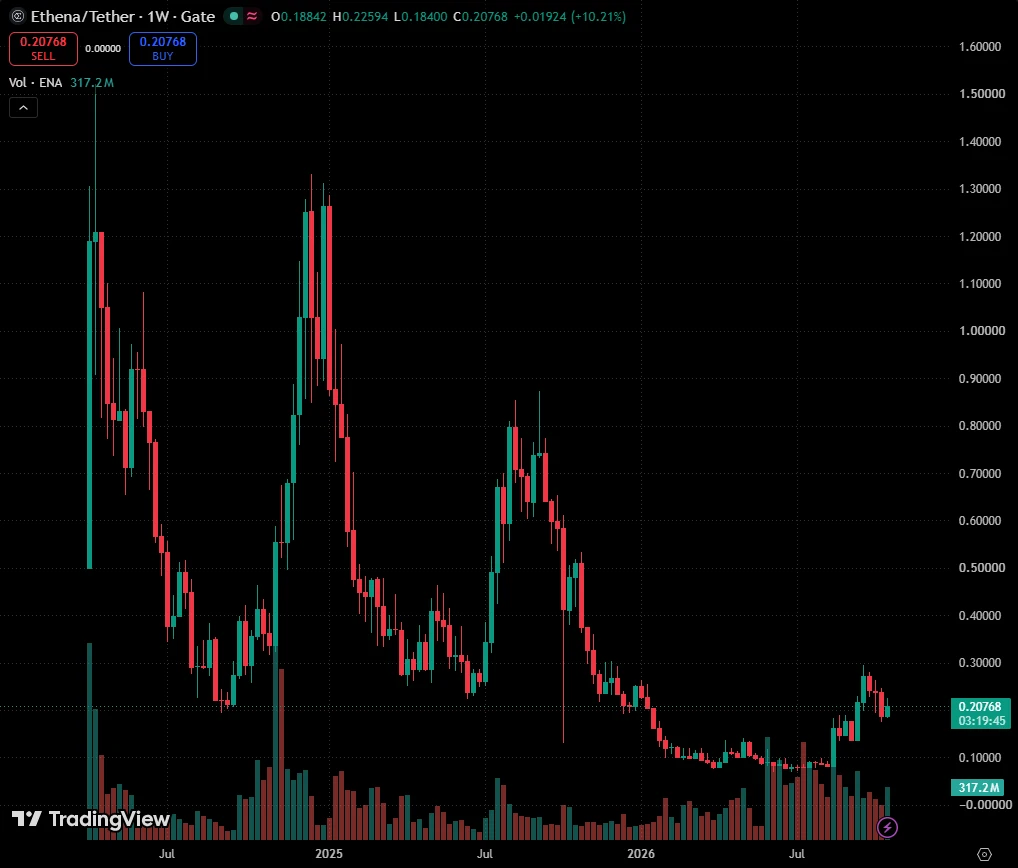
From a technical perspective, this looks more like a corrective rebound within a downtrend. $LSK The current price is 0.2081. MA5=0.21366 remains above MA20=0.2077, but the price has fallen back below MA5, and the short-term moving averages are starting to flatten as bullish momentum fades. The MACD histogram is still +2.414e-05, but the value is tiny, indicating weak bullish momentum near the zero line; RSI=52.0 is neutral, with neither overbought conditions nor divergence, and there is little momentum for a continued a
post-image
TIA-13.65%
#BTCBreaksBelow82K
🚨 Bitcoin Breaks Below $82,000: Is More Volatility Ahead?
Bitcoin has fallen below the key $82,000 level, putting market sentiment under pressure and raising concerns about further downside volatility.
📉 What Is Driving the Move?
Stronger-than-expected US inflation data has increased concerns about the Federal Reserve keeping monetary policy tighter for longer. Higher interest rate expectations can weigh on risk assets, including cryptocurrencies.
🔍 Key Levels to Watch
* $82,000: A crucial level for a potential recov
BTC+0.45%
  • 3
Sentiment Shift: Is Returning "Greed" Fueling the Next Leg Up, or Is the Market Overheating?
The Crypto Fear & Greed Index has shifted back into the Greed zone as risk appetite improves across the market. With $BTC , $ETH , and other major assets showing signs of strength, market sentiment is recovering quickly. This raises a crucial question: will this greed fuel the next leg higher, or is the market starting to overheat?
Rather than relying on emotions, let's break down the current technical picture for BTC and ETH based on recent price action.
📊 Bitcoin (BTC/USDT) Analysis
Looking at the dai
KatyPaty
Sentiment Shift: Is Returning "Greed" Fueling the Next Leg Up, or Is the Market Overheating?
The Crypto Fear & Greed Index has shifted back into the Greed zone as risk appetite improves across the market. With $BTC , $ETH , and other major assets showing signs of strength, market sentiment is recovering quickly. This raises a crucial question: will this greed fuel the next leg higher, or is the market starting to overheat?
Rather than relying on emotions, let's break down the current technical picture for BTC and ETH based on recent price action.
📊 Bitcoin (BTC/USDT) Analysis
Looking at the daily and 4-hour charts, BTC experienced a significant run-up to a local peak of 87,380, followed by a natural retracement phase.
· Current State: BTC is currently consolidating around 81,700. On the 4-hour chart, the price is essentially resting right on the Middle Bollinger Band (MB: 81,701.5).
· Key Levels: Immediate support is found at the recent local low of 79,725 and the lower Bollinger Band around 80,790. On the upside, the daily Middle Band at 83,334 serves as the first major resistance, with a marked target (TP) highlighted around 84,800.
· Indicators: The daily MACD remains in negative territory, though the 1-hour MACD is attempting a bullish cross. Volume and OBV (On-Balance Volume) are relatively flat, indicating a lack of aggressive buying pressure at this exact moment.
BTC Takeaway: Bitcoin is in a healthy consolidation phase. Holding above the $80k psychological and technical support keeps the broader uptrend intact.
📈 Ethereum (ETH/USDT) Analysis
Ethereum's chart tells a similar story of correction and consolidation, but with an interesting technical setup emerging.
· Current State: ETH is trading near 2,411. After dropping from a local high of 2,806, the asset found support near 2,314.
· Key Levels: On the daily chart, the Middle Bollinger Band at 2,558 is the key resistance to watch. The daily Lower Band sits at 2,321, aligning with recent support.
· Indicators: The 1-hour chart shows a classic Bollinger Band squeeze. The bands are tightening significantly (Upper Band: 2,447, Lower Band: 2,385). This compression typically precedes a strong volatility expansion. The 1-hour MACD is flat near the zero line, waiting for a catalyst.
ETH Takeaway: ETH is coiling up. A decisive breakout above $2,450 could trigger a move toward the daily resistance, while a breakdown could see a retest of the $2,300 zone.
🤔 So, Fuel or Overheating?
Greed is a powerful driver, but the current charts suggest the market is in a digestion and consolidation phase, not an immediate parabolic blow-off.
The shift to "Greed" reflects recovering confidence, but the relatively flat OBV and negative daily MACD show that buyers are being cautious. The market is currently testing support levels.
· If buyers step in here and push through the middle Bollinger Bands (BTC > $83K, ETH > $2.45K) with rising volume, the current "greed" will act as fuel for the next leg up.
· However, if these current support levels fail to hold, the sentiment could quickly flip, proving that the market is indeed overheated and in need of a deeper reset.
The Bottom Line: Stay objective. The market is at a decision point. Monitor the volume and the middle Bollinger Bands for clear directional confirmation.
What are your key levels for BTC and ETH right now? Let me know in the comments. 👇
#CryptoMarketTurnsGreedy #BTC #ETH #ShareWeekly
repost-content-media
BTC+0.45%
ETH-0.12%
#GateBTCAndETHFuturesVolumeRanksTop3 🚀 Gate Ranks Among the Global Top 3 for BTC and ETH Futures Trading Volume: What Does This Mean for Crypto Traders?
Introduction: Gate Strengthens Its Position in the Crypto Derivatives Market
In the rapidly evolving cryptocurrency industry, trading volume is one of the important indicators investors use to evaluate an exchange's market activity and competitiveness. Gate's achievement of ranking among the global top three platforms for Bitcoin (BTC) and Ethereum (ETH) futures trading volume highlights its presence in one of the most active segments of the
post-image
first Leopold’s situational awareness blows up now this,
the rumors circulating are that AI fund Vara (worth $26.4 billion) blew up causing the market to dump.
they owned $40 billion worth of positions across $CRWV $NBIS $BE + other infra bets. funds only been around 16 months.
but idt it’s them, it’s likely some fund of similar size.
also leopold bet heavily on corweave post-blow up.
brutal markets
post-image
CRWV-11.90%
NBIS-12.16%
BE-6.33%
🌐 ONEA NETWORK—The future of digital communities should be about more than just communication.
Today, online communities bring together people with shared interests, ideas, and goals.
But what if a community could be more than a place to chat—what if it could also serve as a gateway to services and the digital economy?
Creators could share digital services, members could support valuable projects, businesses could connect with their users, and everyone could potentially take part in broader digital economic activities.
What’s truly worth exploring is not just building bigger communities.
It’s
post-image
Machi(@machibigbrother) got fully liquidated again 4 hours ago!
He's almost wiped out the 250K USDC he deposited just 2 days ago.
A year ago, he was up $44.84M on #Hyperliquid.
Now, he's lost all those profits and is down another $36.85M.
USDC+0.03%
HYPE-0.92%
Well-known trader Killa: Bitcoin may bottom before the midterm elections; be wary of a rally after t
live-cover
LIVE1,988
Load More

Join 40 M users in our growing community

⚡️ Join 40 M users in the crypto craze discussion

💬 Engage with your favorite top creators

👍 See what interests you

Trending Topics

USSeptemberPPIBeatsExpectations

91.35k Views1.93k Discussing

US September PPI came in at 6.3% YoY, well above the 5.3% market expectation, pointing to renewed producer-side inflation pressure. Weekly jobless claims were 199K, broadly in line with forecasts. Could hotter inflation further reduce room for rate cuts, and what does it mean for $BTC, US stocks, and gold?

GateWCTCS9GlobalTradingCompetition

37.87k Views6.71k Discussing

GateBTCAndETHFuturesVolumeRanksTop3

53.8k Views1.84k Discussing

View More