







Square
Following
Hot
News
Notifications
Profile
Share your thoughts
placeholder
Article
Started following the system's idiot-proof mode,
post-image
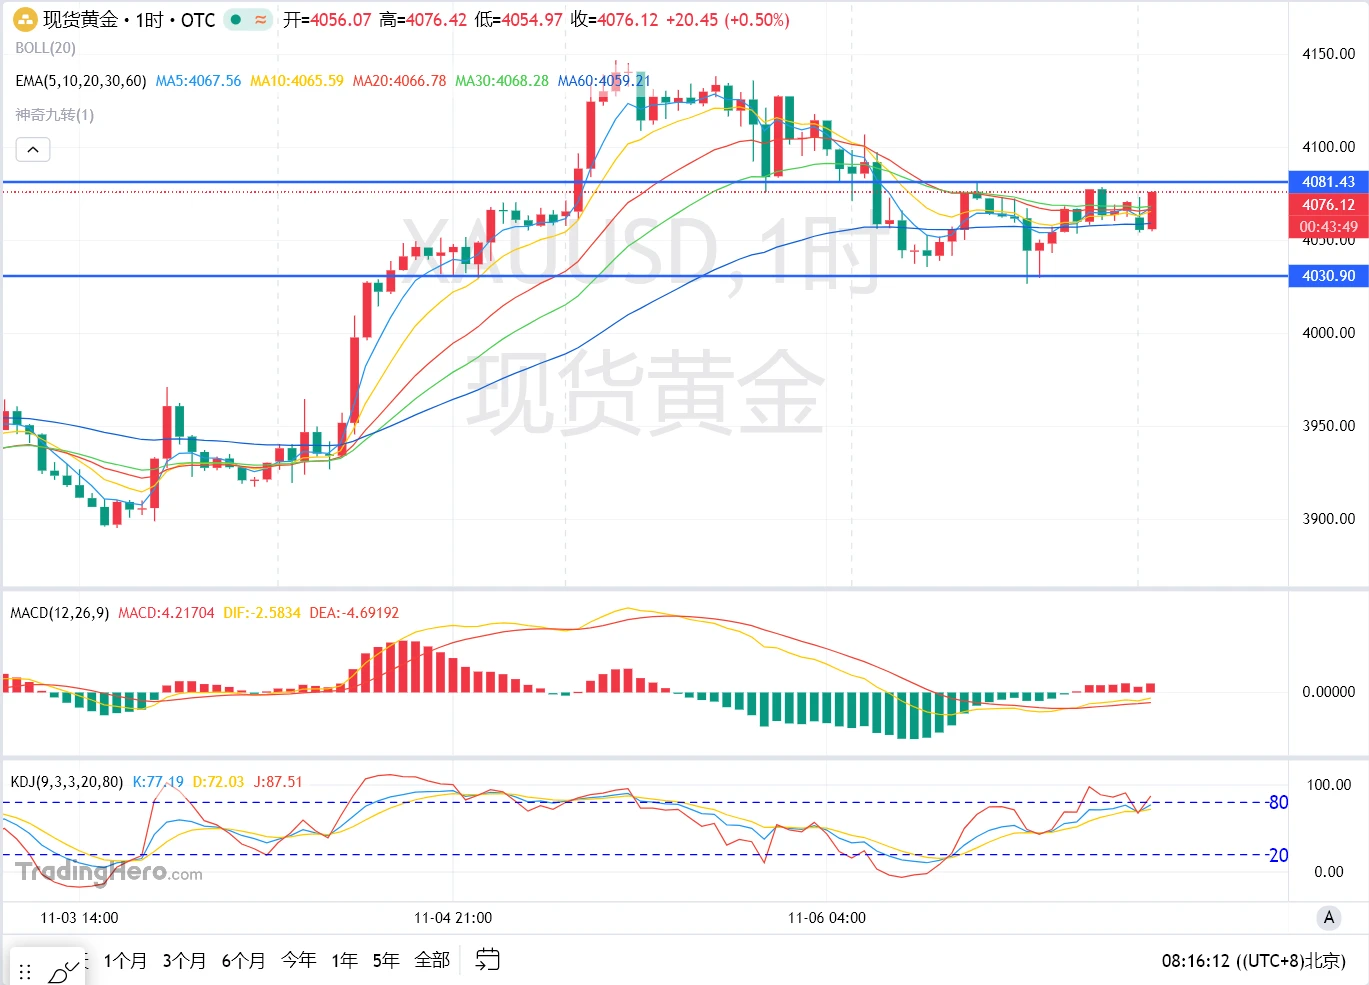
November 9 Gold Morning Brief

After last Friday’s nonfarm payroll data was released, gold prices fell rapidly from around $4,070, reaching an intraday low near $4,026. Prices then stabilized and rebounded late in the U.S. session, ultimately closing near $4,070. The daily chart formed a hammer candle with a long lower shadow.

Technically, on the four-hour chart, gold rebounded from around $4,026 and reached a high of $4,078, but late Friday it failed to continue breaking above the level where the decline began. Short-term rebound momentum has weakened somewhat. The MACD fast and slow lines f
post-image
XAUUSD+0.93%
Trenches
ZIG
Z
bade
b
ZIG
0x8c...1145
Market Cap
$.
Change
.
24h Vol
$.
Holders
.
BTC
B
bade
b
BTC
C5xp...pump
Market Cap
$
Change
.
24h Vol
$.
Holders
.
STONK
S
bade
b
STONK
6GmA...UNgx
Market Cap
$.
Change
.
24h Vol
$.
Holders
.
ANSEM
A
bade
b
ANSEM
9cRC...pump
Market Cap
$.
Change
.
24h Vol
$.
Holders
.
MAGGIE
M
bade
b
MAGGIE
8rHo...PmZV
Market Cap
$.
Change
.
24h Vol
$.
Holders
.
Layout: Bitcoin, Ethereum, Dogecoin
live-cover
LIVE880
  • 1
#Ahr999EntersBottomBuyingZone #ShareWeekly

Bitcoin’s Ahr999 Indicator Falls to 0.43: Is the Market Entering a Historic Accumulation Zone?

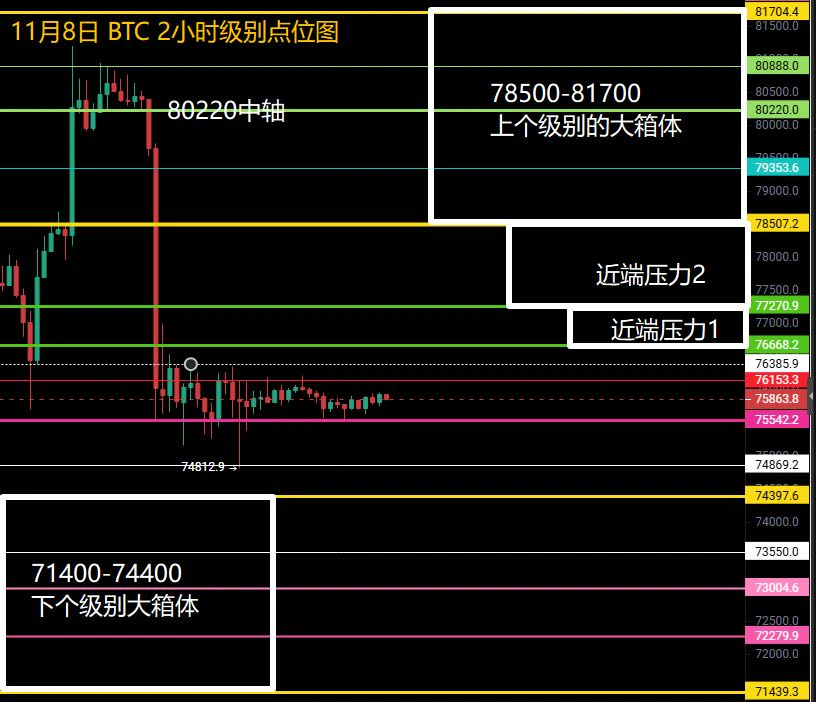
Bitcoin is approaching an important valuation point, and one indicator is attracting increasing attention from long-term market participants. With BTC trading around the $74,000–$76,000 range, the Ahr999 indicator has dropped to approximately 0.43, moving below the historically watched 0.45 threshold.

This development raises an important question: are investors witnessing another long-term accumulation opportunity, or is the market preparing for another
BTC-0.67%
SHIB Nears Oversold Territory as a Short-Term Rebound Opportunity Emerges?

Shiba Inu (SHIB) extended its recent decline on November 9, falling below the key psychological support level of $0.00000500 and dropping to $0.00000447. This has heightened market investors’ concerns about its near-term outlook. However, as the price continues to fall, technical indicators are also starting to show some noteworthy signals.
SHIB’s Relative Strength Index (RSI) is gradually approaching oversold territory. Typically, an RSI entering the oversold range indicates strong recent selling pressure, and some in
NVDA+2.80%
SHIB-1.31%
  • 27
🚀 WHICH #MEMECOIN WILL DOMINATE THE NEXT BULL RUN? 🐂🔥
The next memecoin superstar could be hiding in plain sight! 💎👀
Which project has the strongest community and potential to lead the next rally?
👇 DROP YOUR TOP PICK AND TELL US WHY YOU BELIEVE IN IT!
#Memecoins #Crypto #BullRun #Altseason
post-image
MEME-0.94%
Jensen Huang admits to cheating!
I thought he was a good husband who loved his wife?
Holders of $NVDA are taking critical hits one after another!
post-image
NVDA+2.80%
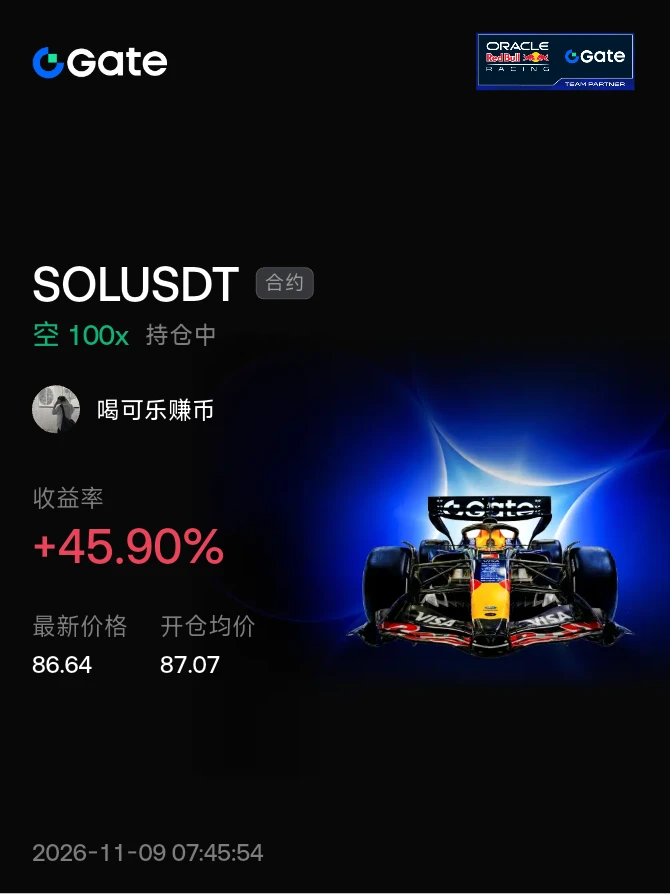
#晒出我的持仓收益 Time to short again—short, short, short your way into the palace$SOL ‌
post-image
SOL-0.74%
Before the end of the year, I must make 300k U. Just wait and see, you big shots. I must make it big in crypto, and within three years, I must become the richest person in our village #山东济宁大壮哥
See your full portfolio risk calculated instantly across MT5 & crypto exchanges in one view. 📊 WolfBot handles symbol reconciliation automatically.
Learn how:
#AlgoTrading #Crypto
post-image
$HUMA I bet it will wick down to 0.0085 within 48 hours. The wager: I’ll stop posting for three days. Current price: 0.0104, down 14.69% in 24 hours, with 19 million in trading volume—this volume can’t support the 24-hour low of 0.0103; a break below it will accelerate the decline. Strategy: don’t chase a short at the current price. Wait for a rebound to 0.0112–0.0115 to enter short, with a stop-loss at 0.0121 (above the 24-hour high), a take-profit at 0.0088, and a position size of 3%. There’s only one rule for picking coins: a daily drop of more than 12% with no contraction in volume—the re
HUMA-1.99%
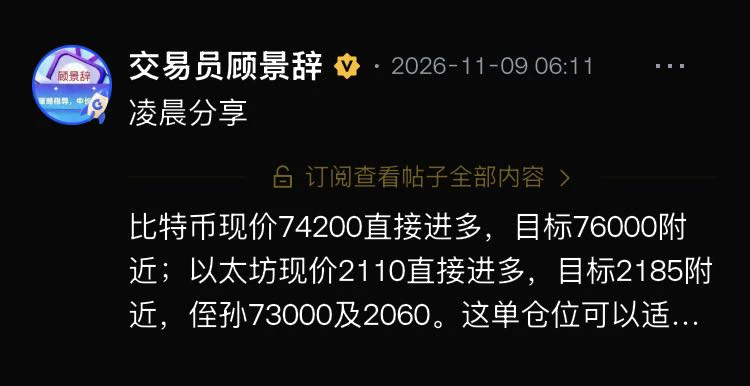
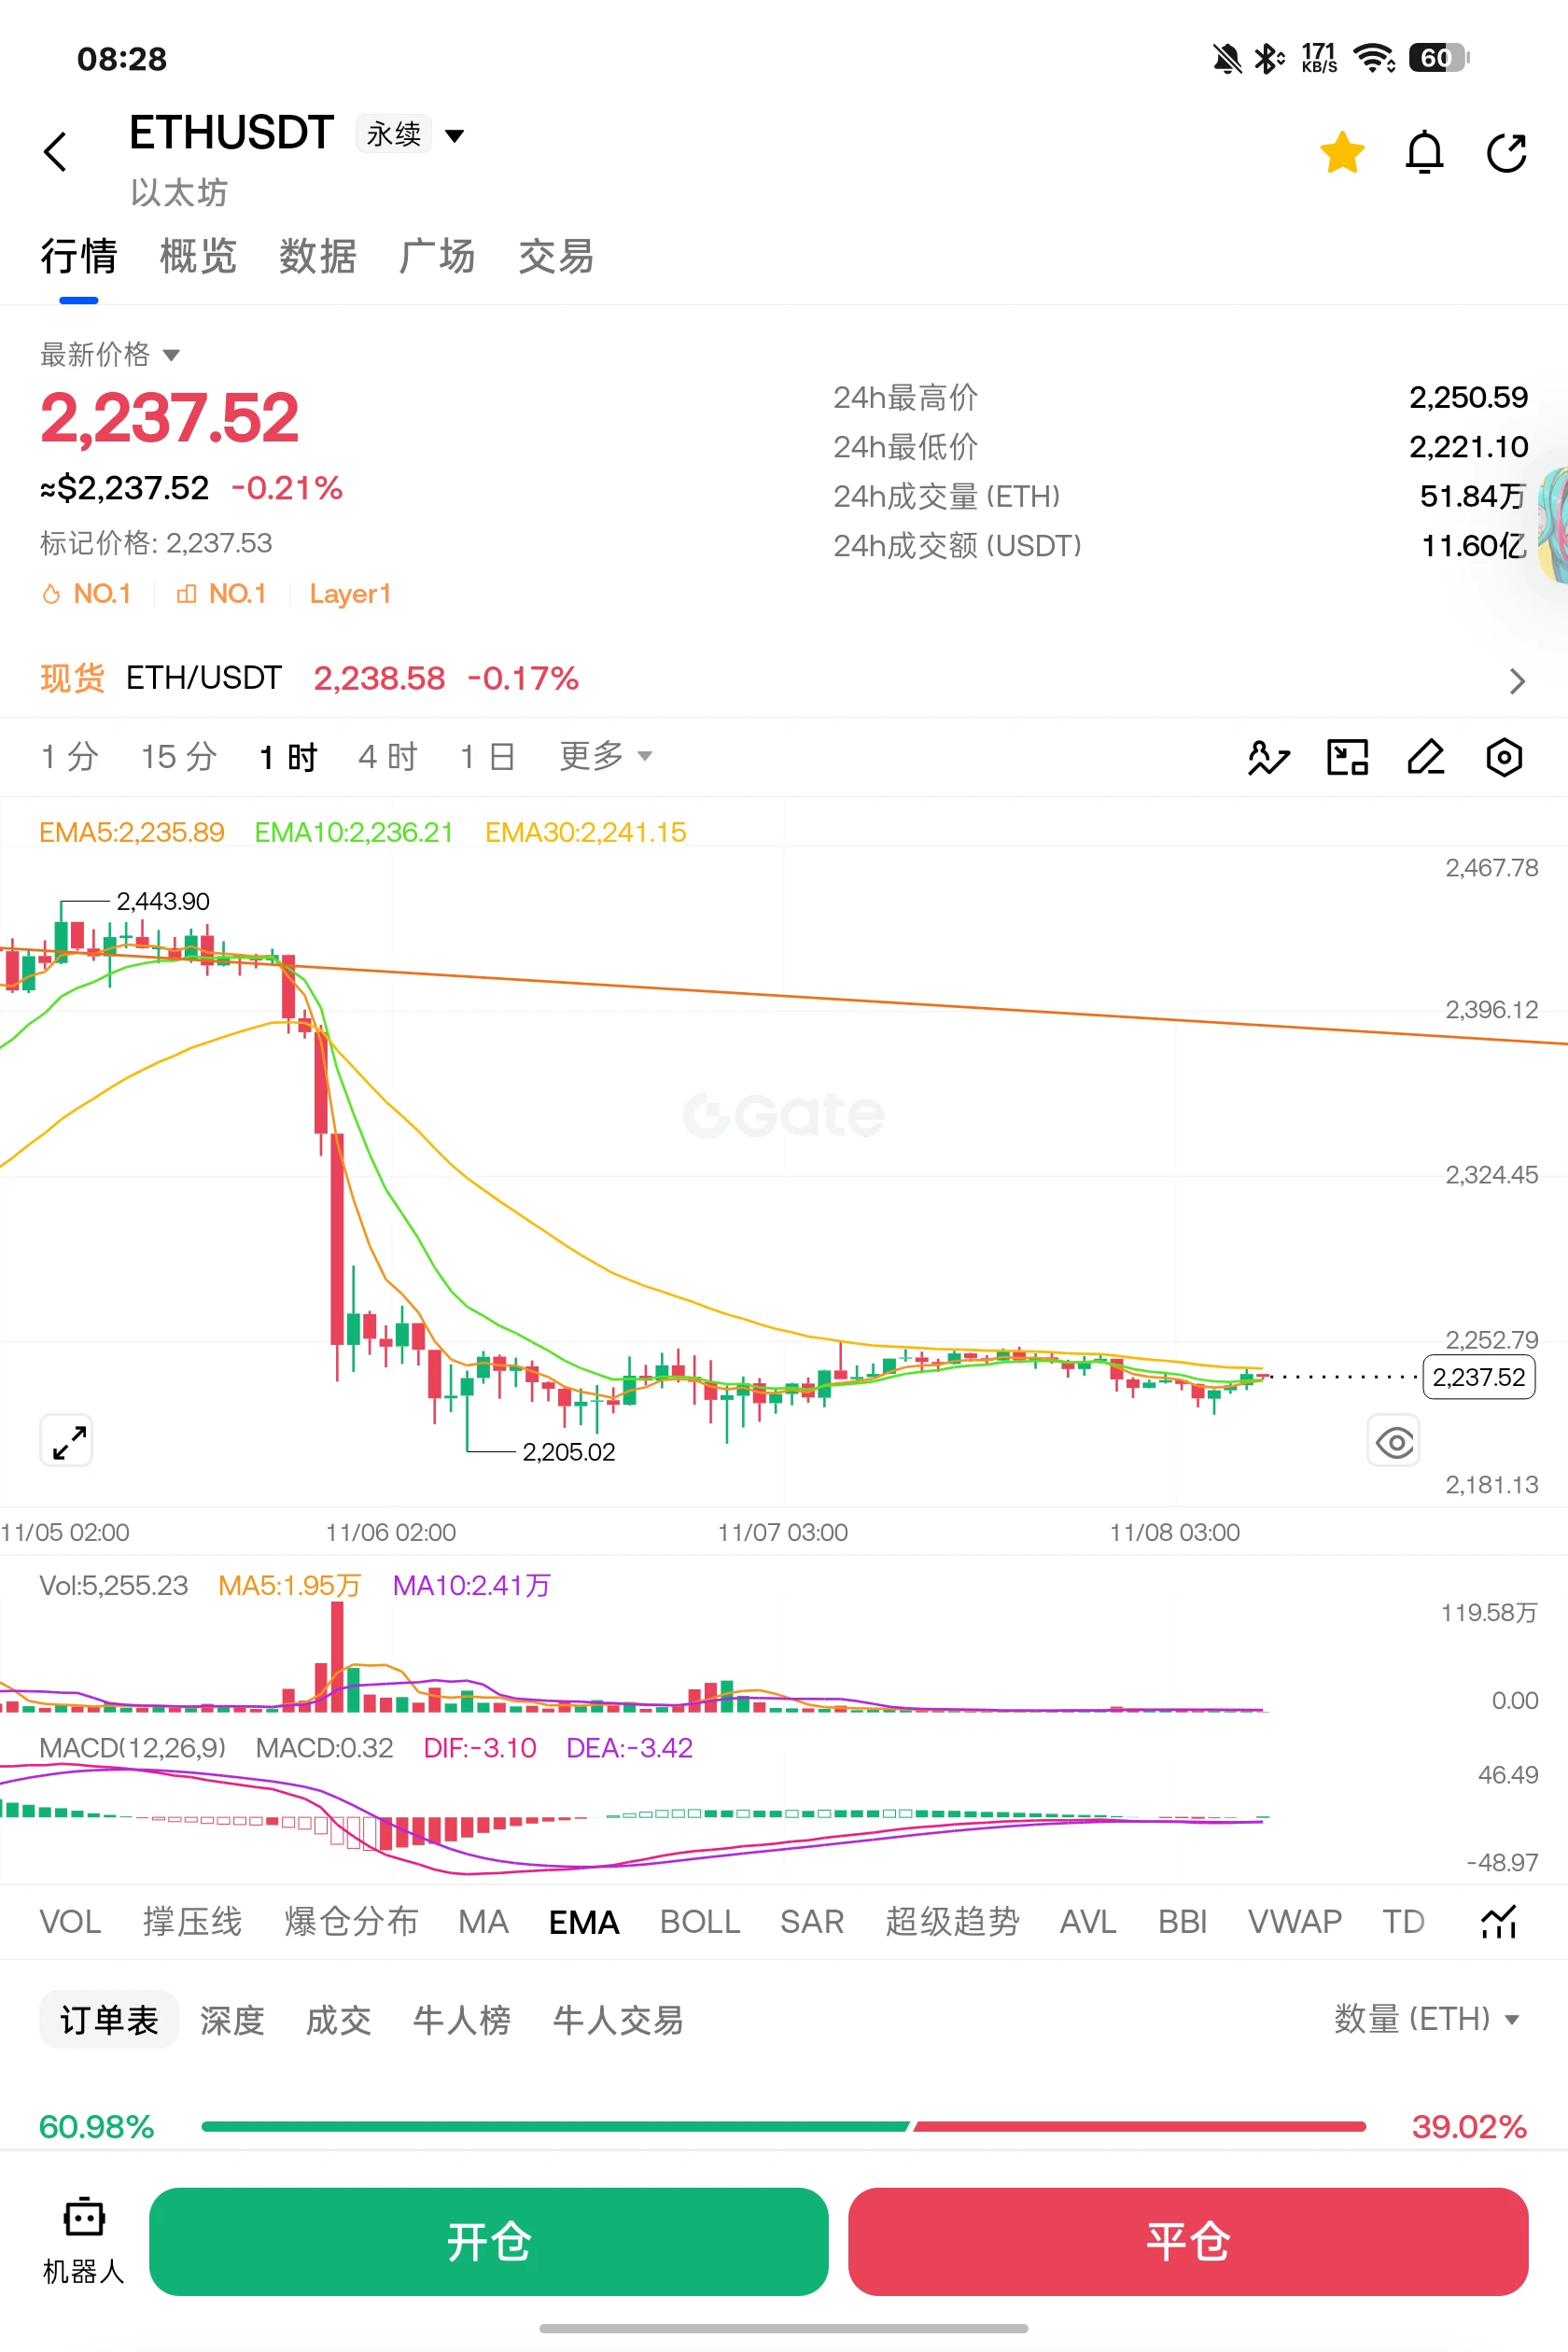
11/9 analysis: Bitcoin and Ethereum have both fallen to the expected levels. This downturn is officially over, and the bull market is about to begin,
BTC-0.67%
ETH-1.26%
Around 6 a.m., I once again opened long positions near the current prices of 74,200 and 2,110. The market bottomed out and rebounded to around 75,700 and 2,165, leaving decent room for gains.
post-image
  • 1
Three-Coin Sentiment Thermometer: Bulls, Tug-of-War, and Bearish Pressure
At the same point in time, BTC, AKE, and CORE show three distinctly different “sentiment profiles.”
🔺$BT Bulls still have a slight edge: 53.60% long positions versus 46.40% short positions, with a long-short ratio of 1.1552. Large-holder positions are also tilted bullish. However, the price has not capitalized on this to move higher, with the four-hour chart posting only a slight gain. Short-term momentum is lacking, while the longer-term trend remains in a correction, making for an overall picture of “bullish sentiment
post-image
BTC-0.67%
AKE+6.07%
CORE+1.11%
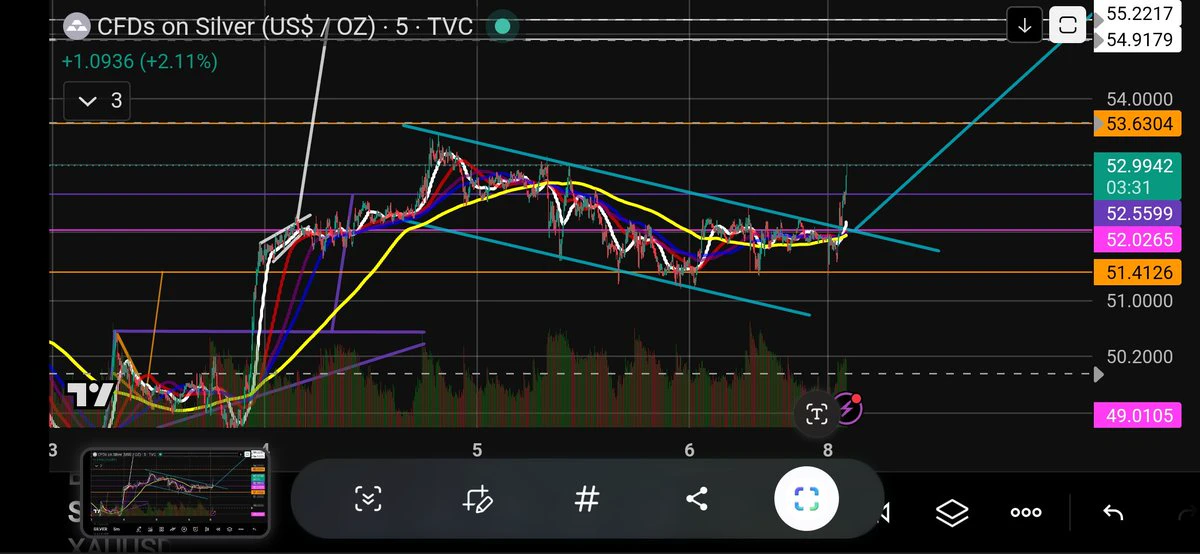
$SILVER Hits $53! 🚀
post-image
XAG+0.47%
The sharp-drop forecast played out as expected, and shorts are raking in big profits! BTC and ETH outlook for Nov. 9

Rubio said: Talks (through intermediaries) produced no results, and Iran’s demands are completely unacceptable. Iran’s demands are outrageous, and some are even ridiculous. Sometimes, resolving issues through diplomacy doesn’t work. If “there is still a chance,” a diplomatic solution will still be sought. But U.S.-Iran negotiations have gone on for too long without any breakthrough at all. So don’t get your hopes up, everyone—even if the Democrats take office, it’ll be the same
ETH-1.23%
BTC-0.65%
  • 1
The two dip-buying entry points mentioned yesterday are both getting very good feedback so far$BTC ‌
post-image
BTC-0.65%
  • 2
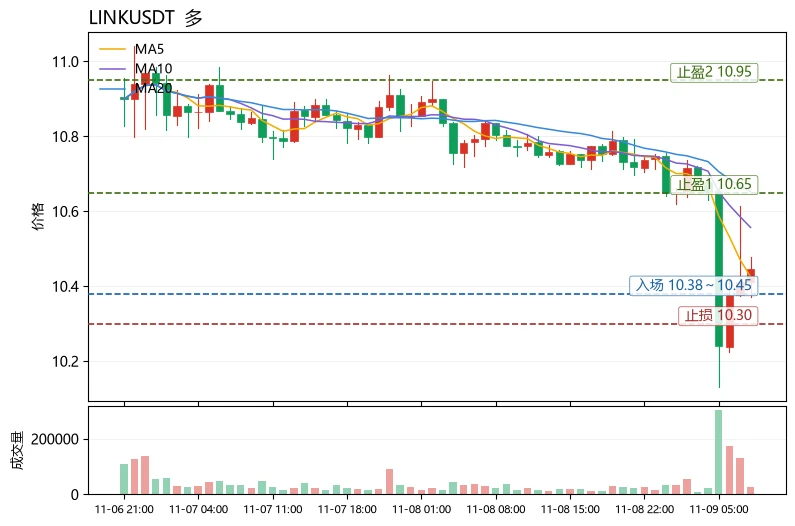
$LINK $LINK Today’s most unusual detail is not the drop, but that the funding rate has already turned to -0.0002%: the price is still consolidating above the lower Bollinger Band, while shorts are starting to pay to hold their positions, indicating that short positions are becoming crowded.
Technically, MA5=10.4252 remains below MA20=10.6524, so the medium-term structure is bearish, but the current price of 10.446 has moved back above MA5; the MACD histogram at -0.03127 is bearish, though its absolute value is small, with signs of momentum fading just emerging; RSI=37.2 is nearing the weak zone
post-image
LINK-0.18%
XPL-0.60%
LTC-0.07%
market prices updattes
live-cover
LIVE1,280
Market crash; yesterday's post had already flagged the risk#CPI数据前瞻
TradingKingGaoYuliang
Market volatility is extremely low. The crypto market has had almost no independent movement recently, following broader markets and often falling with them but not rising. US October CPI data will be released next Tuesday, and funds are expected to move early to avoid risk over the next two days. Focus mainly on shorting at resistance, with longs at key support as a secondary strategy. See subscription updates for specific entry levels #美股AI板块遭遇重挫
repost-content-media
Load More

Join 40 M users in our growing community

⚡️ Join 40 M users in the crypto craze discussion

💬 Engage with your favorite top creators

👍 See what interests you

Trending Topics

USCPIDataIncoming

18.86k Views1.69k Discussing

The U.S. October CPI report will be released on November 10 at 8:30 a.m. ET. September CPI came in at 3.7% year over year, and markets will be watching closely for signs that inflation is cooling, especially in core CPI. A softer-than-expected reading could strengthen rate-cut expectations, while hotter inflation may pressure risk assets through higher Treasury yields and a stronger dollar. How do you think this CPI print will move $BTC, U.S. stocks and gold?

USAIStocksHitHard

30.34k Views3.75k Discussing

USNonfarmPayrolls

59.7k Views4.51k Discussing

View More