






Square
Following
Hot
News
Profile
Share your thoughts
placeholder
Article
Samsung’s quarterly profit surpasses 100 trillion won, yet its stock price has fallen 25%—how should we understand the divergence between performance and share price?
Samsung Electronics released its third-quarter earnings guidance on October 8, and the figures were explosive: quarterly operating profit is expected to reach 107.4 trillion won, up 782.5% year on year and exceeding 100 trillion won for the first time in a single quarter. This marks the fourth consecutive quarter in which Samsung has set a new record for operating profit, with quarterly profit even exceeding the total for all of
$RENDER took decisive action, so the account performed better. This is a good reason to exit. Profits have been locked in. My daily watchlist: $BAT and $ETH .
post-image
RENDER+3.13%
BAT+28.99%
ETH+1.67%
BREAKING: TSMC posts a record quarter as Nvidia, Apple, Broadcom and AMD compete fiercely for its wafer capacity.
TSM-1.82%
NVDA-1.92%
AAPL-0.31%
AVGO-0.64%
AMD-1.47%
I make about $29k a month with options.
NO Day trading
NO Swing trading
NO Covered calls
NO Cash secured puts
NO BS
INSTEAD, I DO THIS:
Build base portfolio
Sell portfolio secured puts (not cash secured)
Buy LEAPS with the premium from sold puts
BUY shares with the premium from sold puts
Keep ratios in check
I can explain it to a 13 year old & I will likely outperform 95% of people that read this.
Simple wins.
post-image
Nothing says privacy like walking around with a phone with the Ledger logo on the back
post-image
$AAOI
The correction continues. If the index hadn’t made a liquidity sweep, the other path would have remained valid. Today, it pulled back to the monthly EMA21-$74. On the other hand, it has also dipped as far as the support band during previous corrections. I normally use the support band as my reference for trends anyway.
I still think it’s forming a handle here. There’s no topping structure like the one at the 2017 peak
post-image
AAOI-2.87%
INDEX-3.94%
SK Hynix Plunges 11%, but Gate’s Open Interest Accounts for 15.8% of the Total Market, Ranking Second—What Are Traders Thinking?

SK Hynix closed down 11.06% yesterday, hitting a new low since April this year and retreating 57% from its June high. Interestingly, the more volatile the market, the higher the trading attention related assets are receiving.

According to Odaily, CoinGlass data shows that open interest in SK Hynix contracts on Gate reached 147,300, accounting for 15.8% of the market and ranking second across the entire market. What does this mean? It means that amid the sharp dec
SNDK-0.56%
$AGT Square has scored a resounding victory for the fifth consecutive month. The more people try to suppress us, the more we stand out; the more people try to suppress us, the better we perform; the more people try to suppress us, the stronger people's trust in us becomes.
1,200 traders, 1,200 qualified individuals. Thank you to each and every one of you. $ZE
$ETH
post-image
ETH+1.67%
9 more stocks just got registered on @base.
Jack in the Box $JACK
Simply Good Foods $SMPL
ImmunityBio $IBRX
Under Armour $UAA
BlackSky $BKSY
Enphase $ENPH
The Trade Desk $TTD
LifeMD $LFMD
Molson Coors $TAP
beer, burgers and satellites. all coming onchain.
post-image
IBRX+1.16%
UAA+1.98%
BKSY+4.53%
ENPH+5.04%
TTD+8.24%
If I could leave just one note for $FIL today, it would be: don’t let +7.87% make the decision for you.
What’s really worth discussing is that $FIL remains strong, while the crowded trade is already out in the open. $FIL is currently at 1.172, up +7.87% over 24 hours. The 1-hour support is 0.9999, resistance is 1.1774, and current volume is 0.61 times the average volume of nearly 20 bars.
The 1-hour trend is strong, with RSI at 78; the 4-hour trend is strong, with RSI at 56. This combination makes me temporarily accept the following interpretation: I acknowledge that the trend is strong, but
post-image
FIL+8.74%
Bitcoin’s Long Term Cycle Chart Points to a Bigger Question: Are We in Another Accumulation Zone? 🙄
Bitcoin’s historical price cycles show a recurring pattern: major rallies, deep corrections, and long recovery periods.
The chart highlights previous peaks near $19,700 in 2017, $69,000 in 2021, and $126,000 in 2025, alongside earlier areas that some traders viewed as accumulation zones.
Now, the key question is whether the current price structure represents another opportunity to accumulate or whether the cycle is changing.
I think that the Historical patterns can offer useful context, but the
post-image
BTC+0.94%
If you had put $10,000 into Richard Heart’s Hex token at the 2021 all time high you would only have $11 left and be down over -99.9%.
post-image
BlackRock, with $15.5 trillion in assets under management, developed the strategies behind three of Ondo's seven tokenized model portfolios. Each is one token holding tokenized stocks, bonds and ETFs, rebalanced by smart contract.
@Ondo
BLK+4.47%
ONDO+4.80%
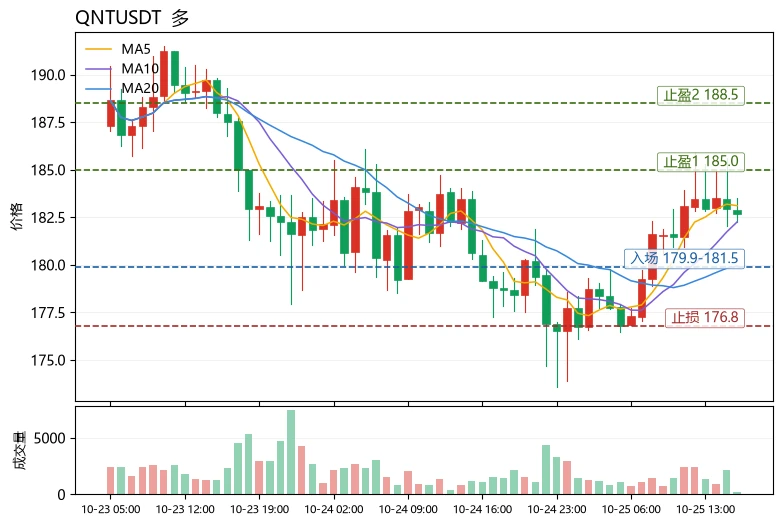
$BTW Long plan: 4-hour chart support at 1.908–1.925
Buyers must hold this area to maintain dominance. I will watch whether they can defend it here and avoid chasing the price. Why focus on this level: - The 4-hour price is 1.92, above the EMA50 at 1.81, favoring buyers - The stop-loss risk is 6.4%, while the potential TP3 gain is 10.3%, giving a favorable risk-reward ratio - BTC's short-term trend is bullish, providing support🟢 Long · Entry 1.908–1.925 · Take profit 1.990 / 2.039 / 2.113 · Stop loss 1.794
Not investment advice · Do your own research
post-image
BTW-20.28%
BTC+0.94%
$BERA Current price 0.2275, 24h -5.88%, trading volume only 5.6M USDT, MA5 at 0.23092 has crossed below MA20 at 0.23155, RSI at 46.6 is weak, the MACD histogram at -2.941e-05 remains bearish, and the Bollinger Bands are [0.214696, 0.248404], with the 30-candle amplitude at approximately 17.58%. The funding rate is -0.0001%, with bears slightly dominant but not at an extreme, and the Fear & Greed Index is neutral at 53—this is a typical low-volume, gradual decline structure rather than panic selling, meaning downside may open slowly instead of being released all at once.
Directional view: Beari
post-image
EPIC-13.85%
Gm everyone ☀️
post-image
10.16 Gold $XAU Recent Strategy Gold has been moving sideways within this range since falling at the end of September, with 4220 on the upside and 4110 on the downside. We have gradually sold high and bought low several times here.
Here is what we are doing now: 1. Short-term strategy: go long at 4100, exit around 4200, with a hard stop-loss at 4020. 2. After playing a few short-term rounds, switch to a long-term position (you can choose PXAG due to the high weekend fees). The unchanged point for both long-term and short-term trades is going long at 4100 with a stop-loss at 4020; the only dif
post-image
XAU+1.52%
  • 3
$CORE Everyone, do you think it will reach 2u?
post-image
CORE+0.24%
Zero Hunters Crypto Lounge 🎯 | Historical Bangla Adda
live-cover
LIVE755
Load More

Join 40 M users in our growing community

⚡️ Join 40 M users in the crypto craze discussion

💬 Engage with your favorite top creators

👍 See what interests you

Trending Topics

USSeptemberPPIBeatsExpectations

91.35k Views1.88k Discussing

US September PPI came in at 6.3% YoY, well above the 5.3% market expectation, pointing to renewed producer-side inflation pressure. Weekly jobless claims were 199K, broadly in line with forecasts. Could hotter inflation further reduce room for rate cuts, and what does it mean for $BTC, US stocks, and gold?

DrLinHanSpeaksAtOxfordUnion

135.63k Views1.86k Discussing

JapanAndKoreaStocksPlunge

47.27k Views1.76k Discussing

View More