

Square
Following
Hot
News
Notifications
Profile
Share your thoughts
placeholder
Article
$ETH
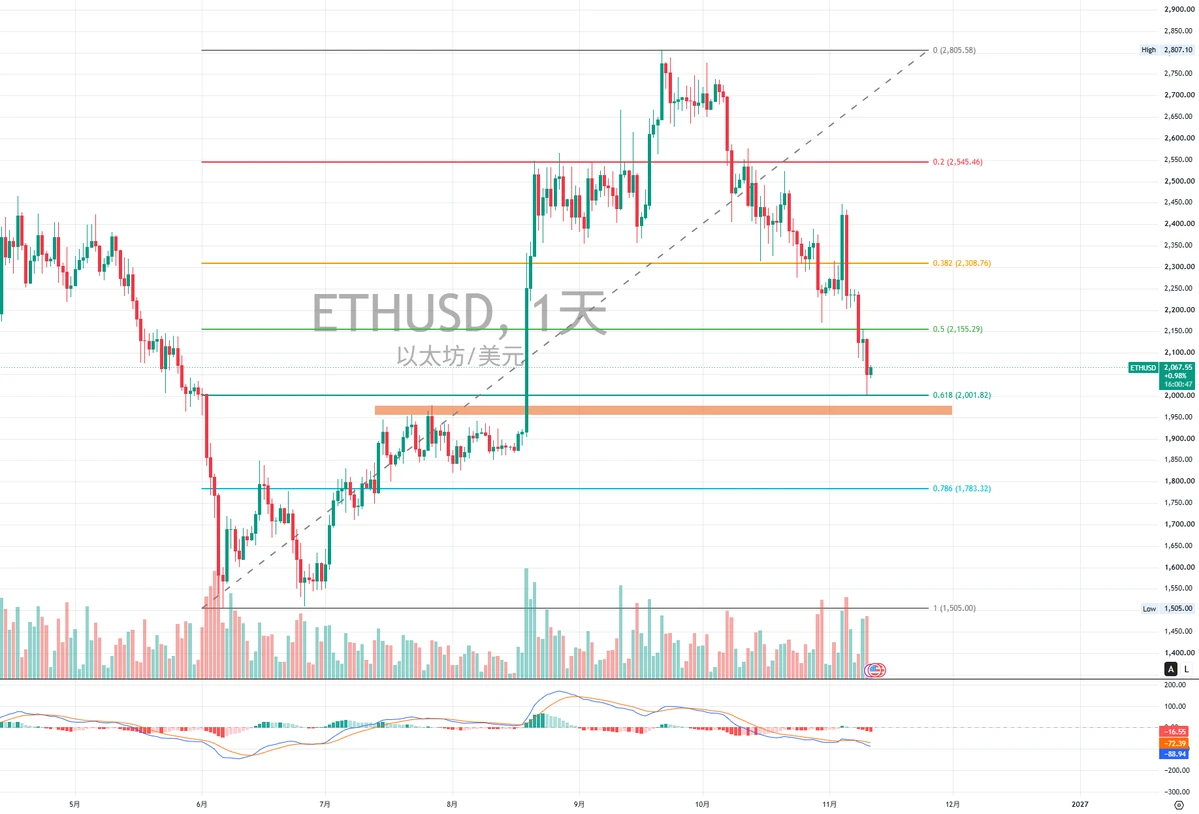
ETH Outlook Update:
Ethereum followed Bitcoin lower but found support at the $2,000 round-number level and began to rebound.
Switching to the daily chart, the low landed exactly at the 0.618 Fibonacci retracement level. Can it mount a strong rebound?
post-image
ETH-1.26%
BTC-0.67%
These nine lessons are for bros who are still losing money
1. The smaller your bankroll, the less greedy you should be. Catching one market move you understand each day is enough. Don’t go all in or expect to turn your life around overnight.
2. When good news is priced in, don’t rush to chase. Prices may have already risen before the news comes out. Be especially careful of profit-taking when prices surge.
3. Reduce your position before major news. Nonfarm payrolls, CPI, Fed rate decisions—if you can’t tell which way things will go, stay out.
4. Always keep your position small for the medium t
BTC-0.65%
ETH-1.23%
ZEC+1.29%
Trenches
mihao
m
bade
b
mihao
4Cxj...pump
Market Cap
$.
Change
.
24h Vol
$.
Holders
.
PIEVERSE
P
bade
b
PIEVERSE
0x0e...25a9
Market Cap
$.
Change
.
24h Vol
$.
Holders
.
HOLD
H
bade
b
HOLD
4iJ7...pump
Market Cap
$.
Change
.
24h Vol
$.
Holders
.
X
X
bade
b
X
9VZe...pump
Market Cap
$.
Change
.
24h Vol
$.
Holders
.
DacityCoin
D
bade
b
DacityCoin
DKYc...pump
Market Cap
$.
Change
.
24h Vol
$.
Holders
.
UsDC market update
live-cover
LIVE1,999
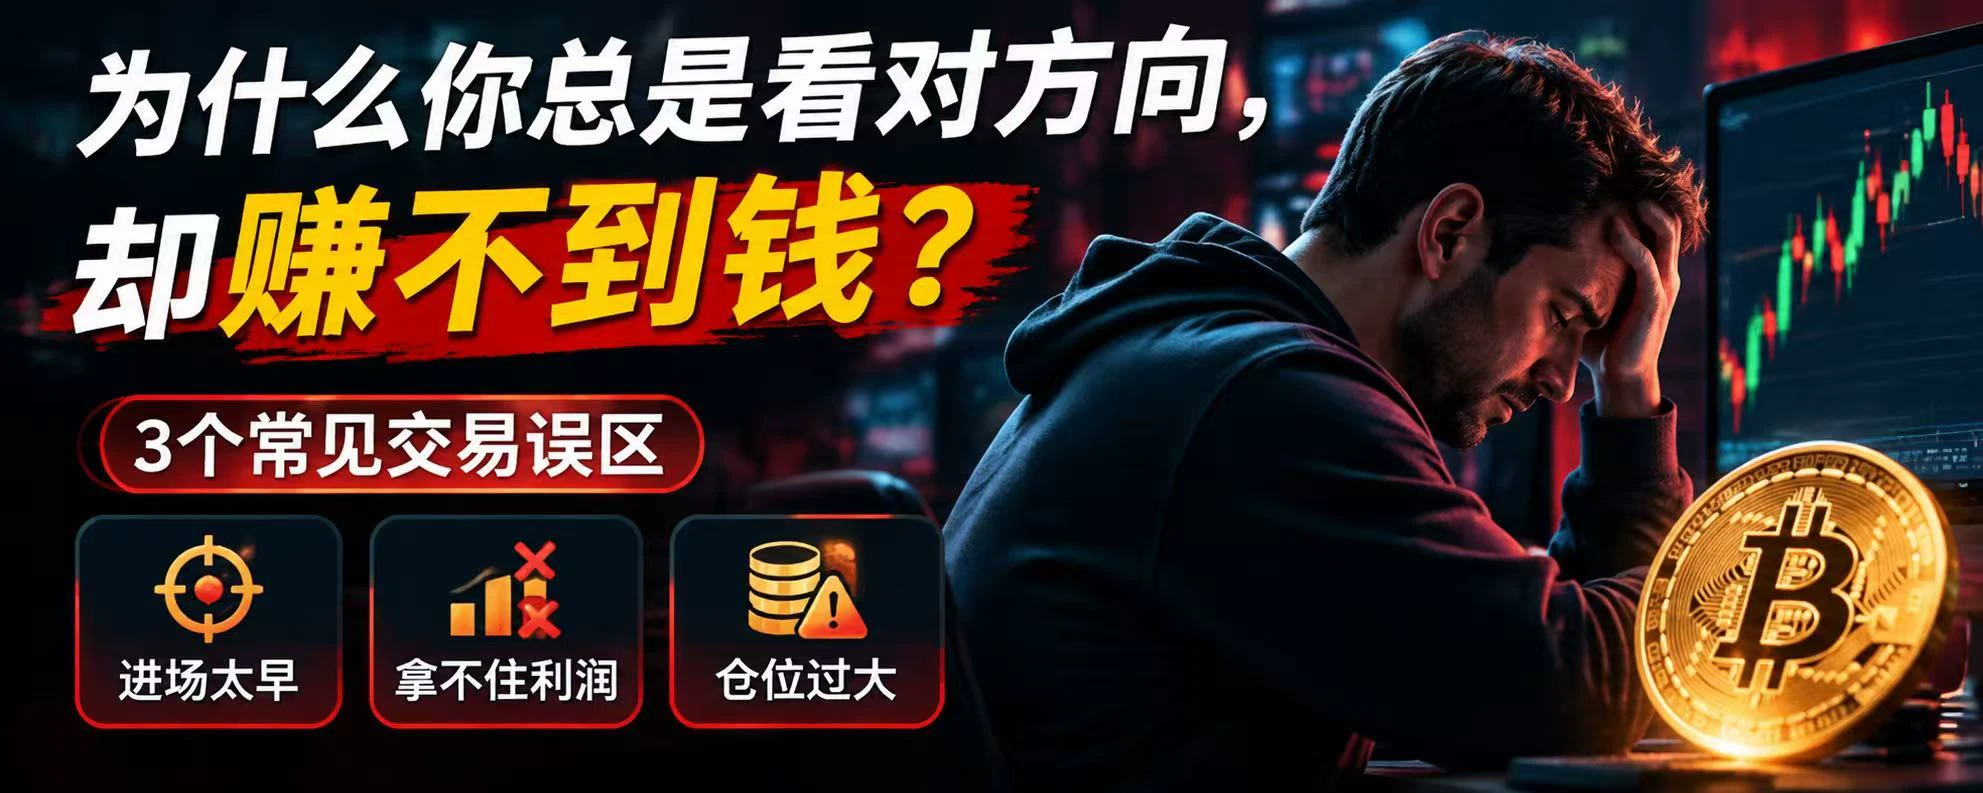
Why Do You Always Get the Direction Right but Still Fail to Make Money?

In crypto trading, there is a particularly frustrating situation:

You correctly predict that BTC will rise, but still make no money; you spot a downtrend in advance, yet your account still ends up in the red.

Why do you still fail to make money even when you get the direction right?

In fact, predicting the direction is only one part of trading. What really determines the outcome also includes entry points, position size, stop-loss settings, and execution discipline.

First, timing your entry is crucial. Suppose BTC ris
post-image
BTC-0.65%
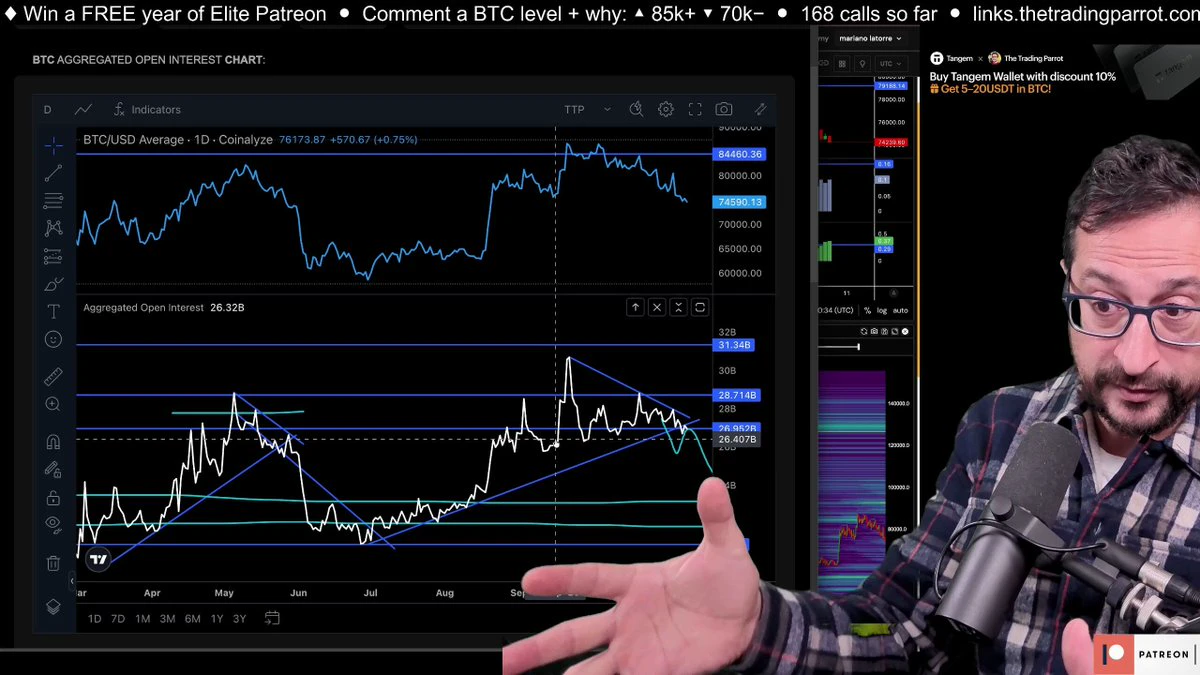
📉 Open interest is showing a critical rejection that looks EXACTLY like the 28th of May — right before acceleration to the downside. But here's the difference: longs are at 74-77 now vs 40-50 back then. This means if it pukes, it shouldn't be as big. At 11:48 in today's video I break down the data.
#Bitcoin #BTC #OpenInterest #Crypto #Data
post-image
BTC-0.65%
  • 1
In BTC trading, many people see a long upper wick on a candlestick and assume the price is about to fall. But does a long upper wick really mean a trend reversal?

Not necessarily.

A long upper wick usually indicates that the price encountered selling pressure as it rose. Buyers tried to push the price higher, but faced selling at higher levels, and the price eventually pulled back from its peak.

There are three key aspects to consider when assessing a long upper wick.

First, where it appears. If a long upper wick appears near a significant previous resistance level, it may indicate strong
post-image
BTC-0.67%
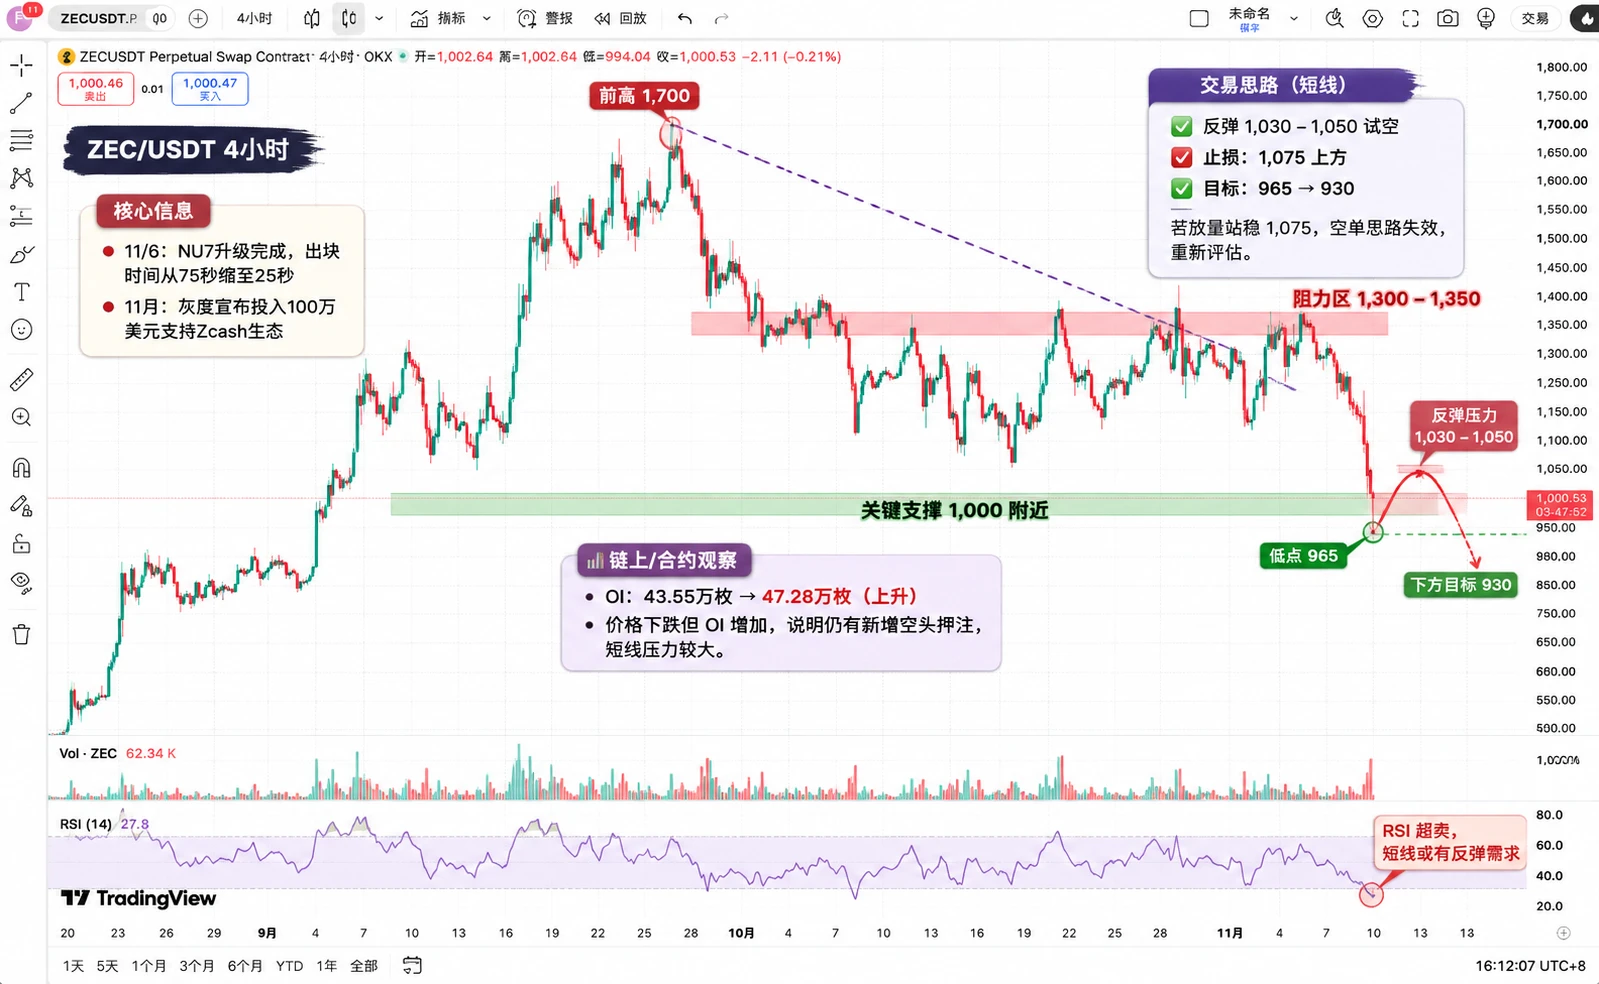
ZEC, we positioned high-level shorts around 1250. The market fell all the way to a low of 976, capturing a 270-point move. The bearish momentum played out perfectly, and we locked in the direction early!

Looking at the current chart, the daily candle has plunged below the lower Bollinger Band, which is widening downward. MACD has expanded sharply, and bearish momentum has been fully unleashed. The trend has entered an accelerated decline.
The 4-hour candles continue to track along the lower Bollinger Band, with all moving averages above the price. Every minor rebound fails to break through, a
post-image
ZEC+1.29%
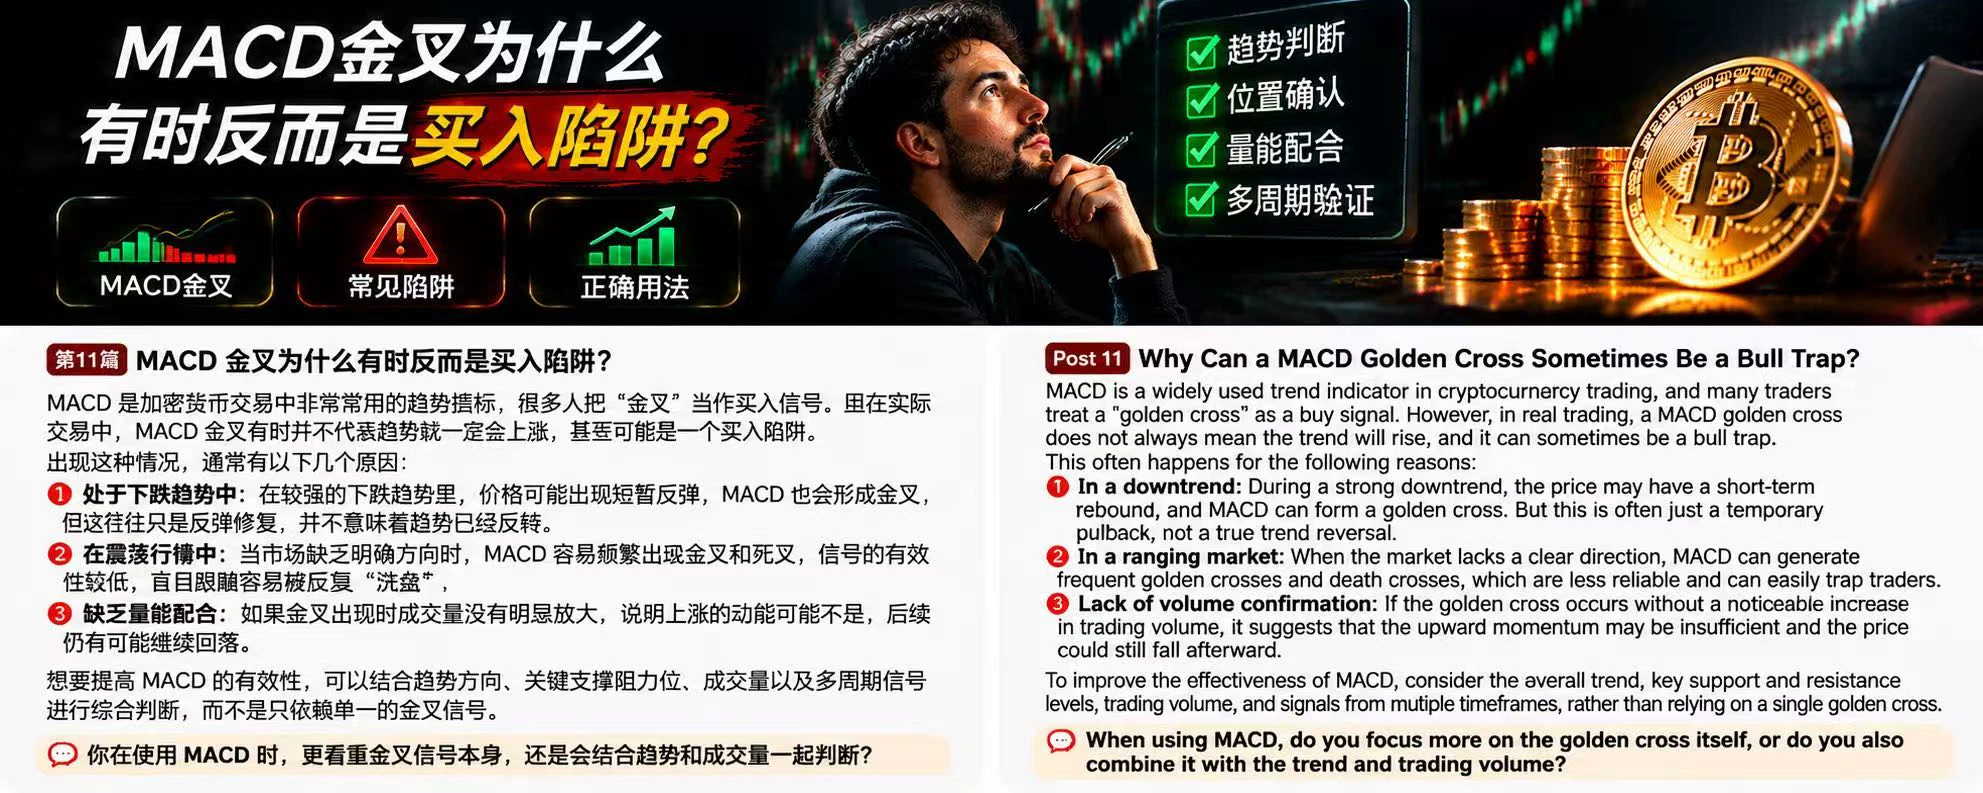
MACD is a widely used trend indicator in cryptocurrency trading, and many people treat a golden cross as a buy signal. But in actual trading, a MACD golden cross does not always mean the trend will rise; it may even be a buy trap.

This usually happens for the following reasons:

First, during a downtrend. In a strong downtrend, prices may see a brief rebound and MACD may form a golden cross, but this is often just a corrective bounce and does not mean the trend has reversed.

Second, in a ranging market. When the market lacks a clear direction, MACD can produce golden crosses and death crosse
post-image
$ARIA Definitely getting cut in half today, everyone start selling
post-image
ARIA+22.03%
#WCTCS9 $ZEC Drops Below $1,000! Upgrade Tailwinds and Institutional Support—So Why Does It Keep Falling?

1. First, the market. ZEC hit a low of $965 in the past 24 hours, down nearly 13%. Just a few days ago, it was hovering around $1,300, and now it can barely hold $1,000. Those who bought the dip are probably trapped again!
2. The news isn't actually bad. The NU7 upgrade was completed on November 6, shortening the target block time from 75 seconds to 25 seconds. Yesterday, Grayscale also announced a $1 million investment to support the Zcash ecosystem. So what happened? Good news keeps c
post-image
ZEC price action
$1,000 is an opportunity
A midway stop in the next downturn
1 Participants
Ends In 22 Hour
ZEC+1.29%
  • 1
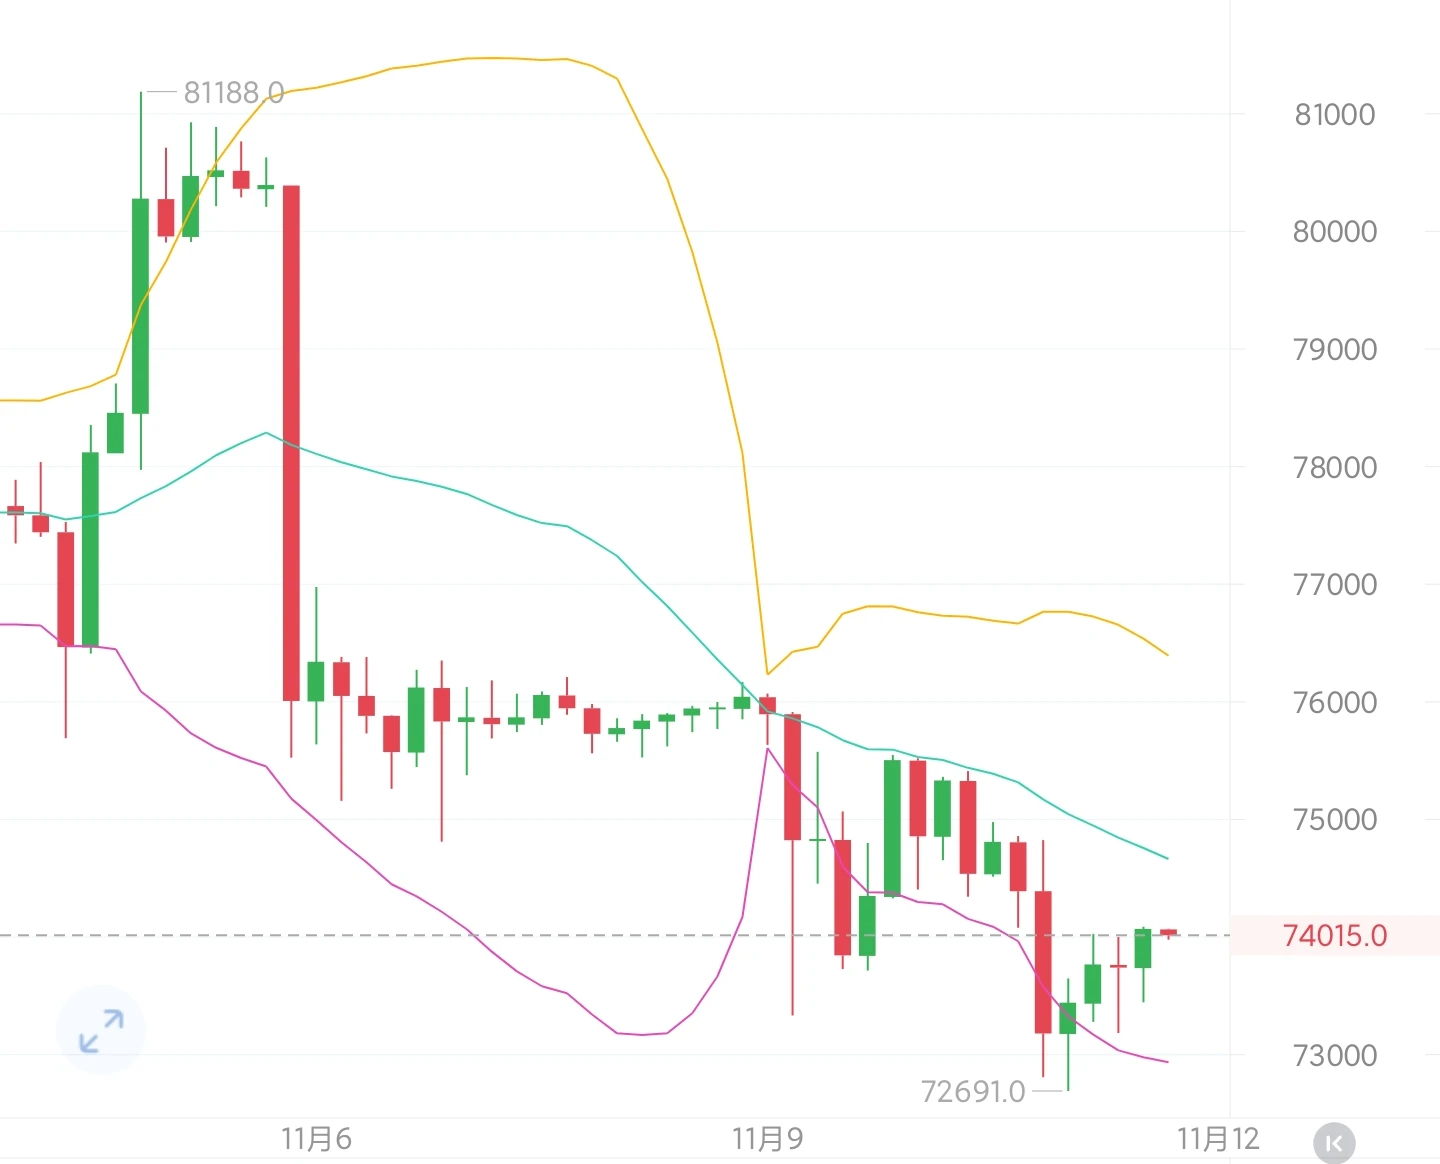
BTC’s larger chart structure remains bearish on the daily timeframe. The Bollinger Bands are opening downward, bearish MACD momentum continues to build, and price is clearly under pressure.

On the 4-hour chart, price continues to trade below the Bollinger midline, with every rebound met by selling pressure—a typical bearish continuation pattern.

The 1-hour chart shows only a slight indicator recovery, with KDJ edging up. This is merely a brief relief bounce within a downtrend; volume is not following through, there is no basis for a reversal, and upside is limited.

BTC may face resistance n
post-image
BTC-0.67%
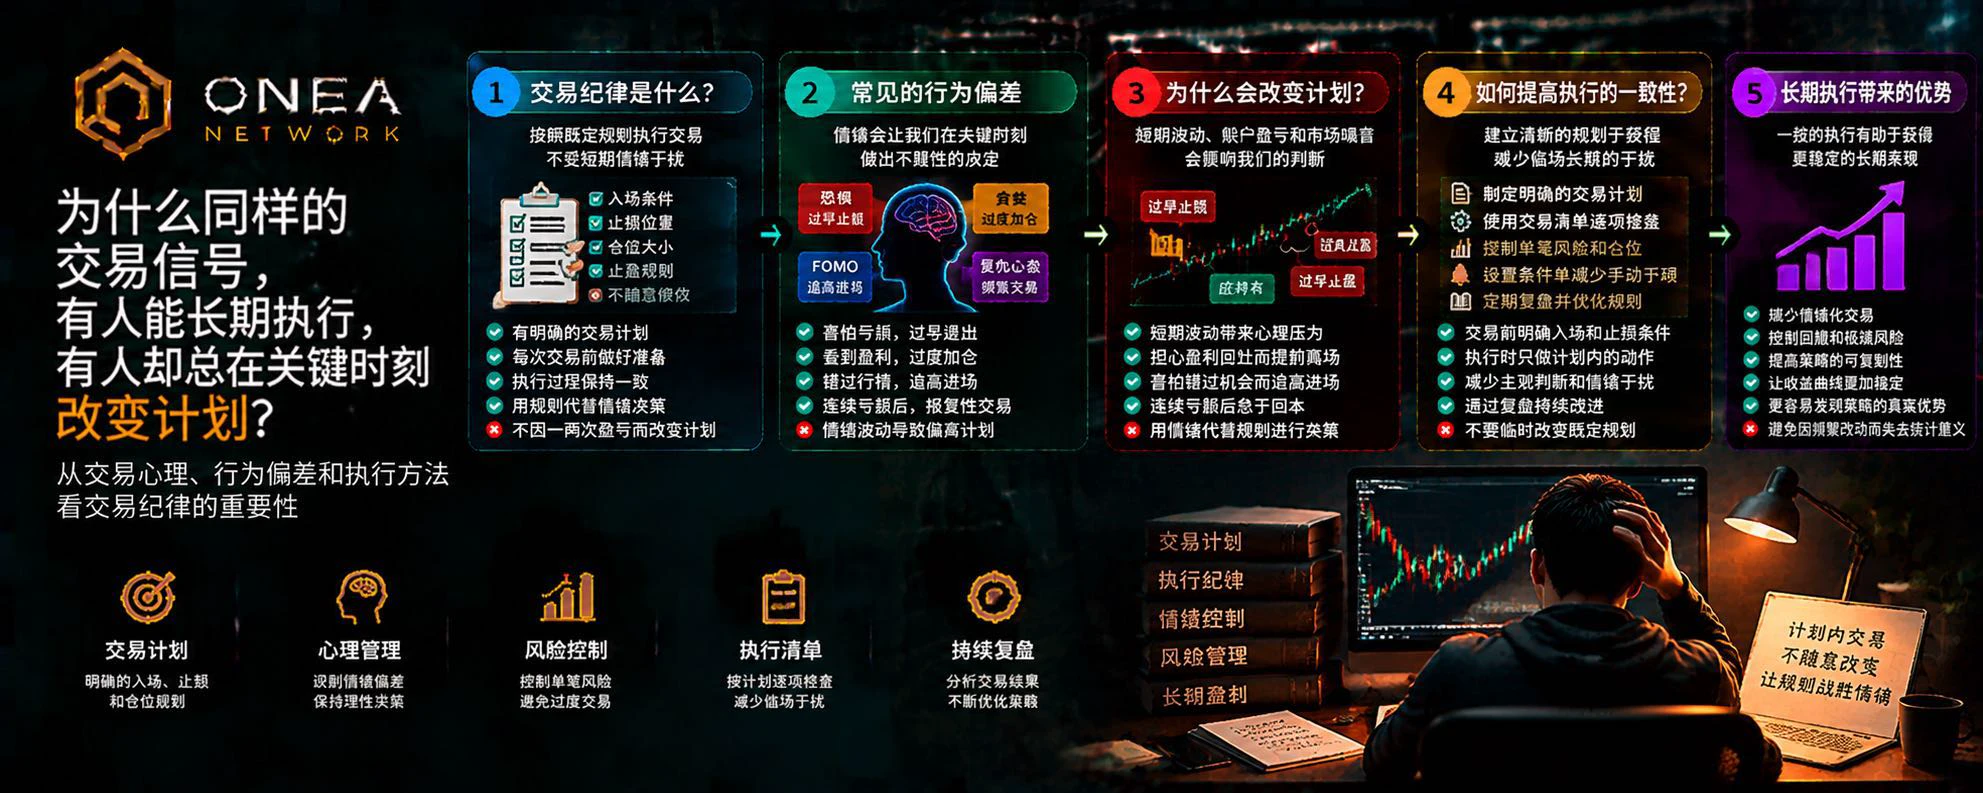
Why can some people consistently follow the same trading signals over the long term, while others keep changing their plans at critical moments?

Many traders are not short on indicators or trading strategies.

They know where to enter, where to set stop-losses, and how to manage position sizes.

But once they enter the market, everything changes.

When in profit, they worry about giving back their gains and close positions early.

When facing a loss, they refuse to admit they were wrong and widen their stop-losses without authorization.

When the market rises, they fear missing out and chase
post-image
Profitable in backtests, losing in live trading: How can you tell whether it’s an execution problem or the strategy has stopped working?

Why does a strategy perform well on historical data, yet produce completely different results once real capital is put to work?

After taking losses, many traders’ first instinct is to change parameters, add indicators, or even scrap the entire strategy.

But the problem may lie at different points in the process. Making changes blindly without identifying the cause may only make the strategy more complicated.

I. First: Compare key backtest and live-trading
post-image
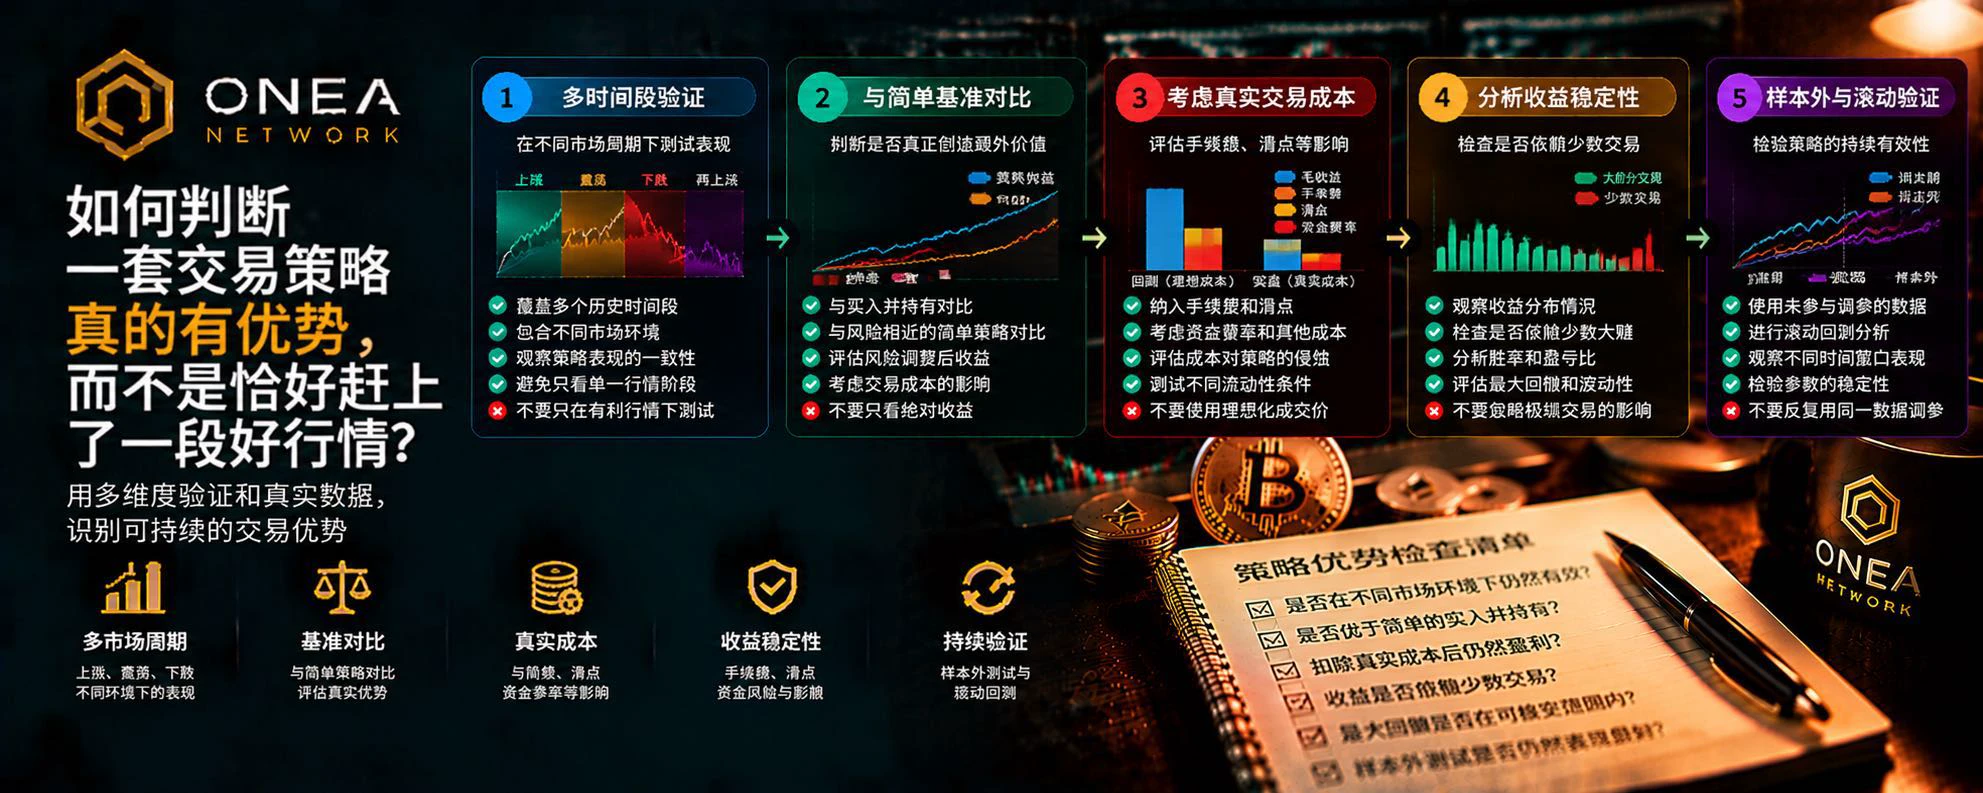
How can you tell whether a trading strategy truly has an edge, rather than simply benefiting from a favorable market period?

If a trading strategy has made money consistently over the past few months, does that mean it has a genuine edge?

Not necessarily.

It may have identified a real market pattern, or it may simply be suited to a particular market phase. It may have genuine profit potential, or its backtest parameters may be overfitted to historical data.

The real challenge is not finding a great-looking equity curve, but determining whether the edge behind it can stand up to scrutiny.

post-image
#RedBullDoublePodiumInBrazil $MU
From an Incredible F1 Comeback to the Future of Finance: Gate × Red Bull Racing

Some victories are remembered for speed, while others demonstrate what determination, preparation, and teamwork can achieve. The 2026 São Paulo Grand Prix delivered exactly that kind of moment for Oracle Red Bull Racing.

Max Verstappen produced an extraordinary performance, starting from P21 and fighting his way to P2. His remarkable recovery demonstrated exceptional racecraft, adaptability, and determination. His teammate Isack Hadjar also delivered an impressive performance, se
MU-1.20%
Mihao
The billion dollar prophecy has begun
post-image
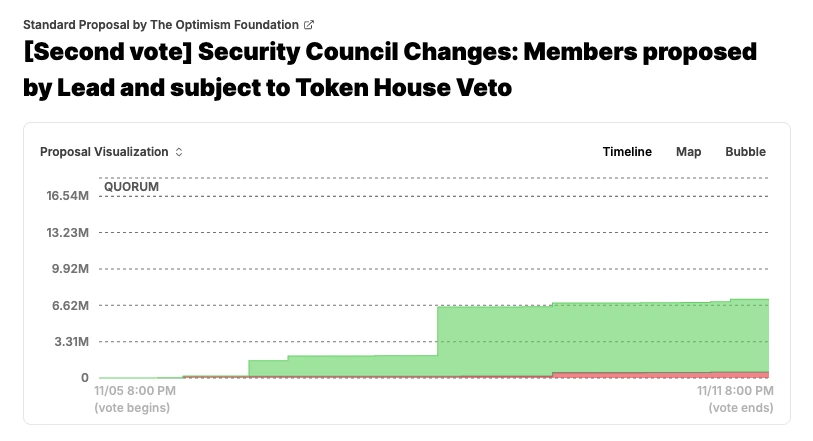
Shouldn't the @Optimism community have more say over who holds emergency powers?
It is considering a change where one elected lead picks its Security Council members.
To block a nominee, holders would need 20% of votable $OP supply.
That's a lot of influence over a council with emergency powers.
post-image
OP-1.33%
Boost Your Rewards With Futures Trading, Hold GT to Share 3,000 GT https://www.gate.com/campaigns/6932?ch=9548&ref=VLARBF1YAG&ref_type=132
post-image
GT-2.41%
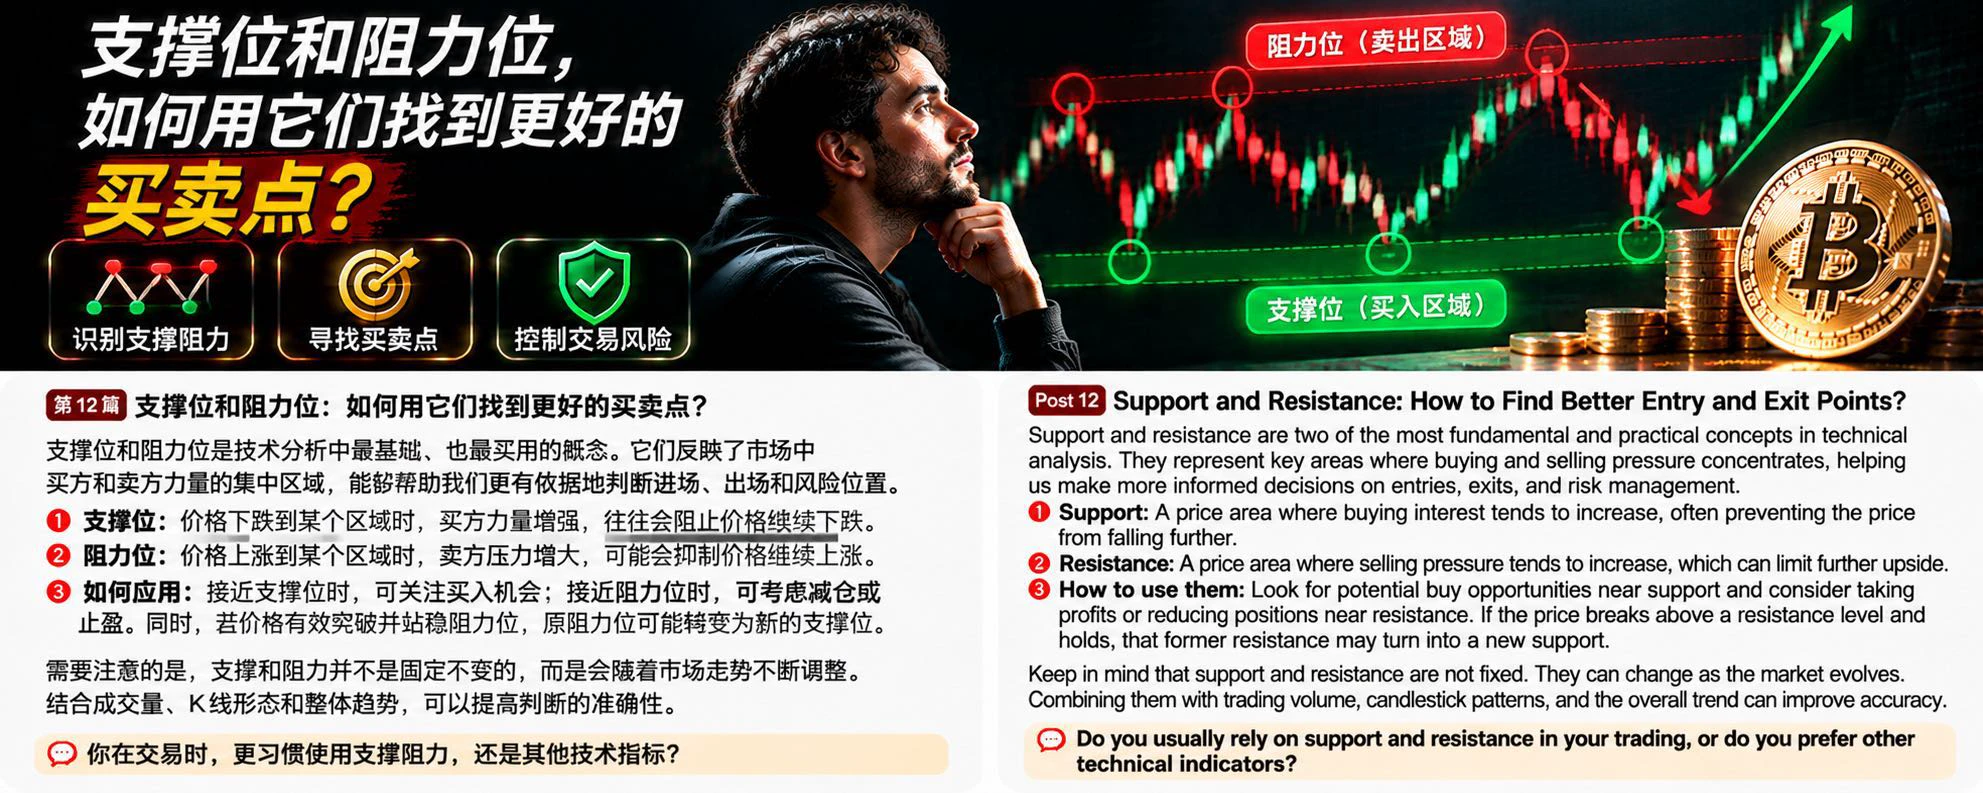
Support and resistance are the most fundamental and practical concepts in technical analysis. Many traders study candlesticks and indicators every day, yet overlook an important question: at which price levels are buying and selling forces likely to shift?

First, support is an area where buying pressure may increase as prices fall. When the price approaches this level, some buyers may start entering the market, slowing the decline. But support does not mean the price definitely won't break below it.

Second, resistance is an area where selling pressure may increase as prices rise. When the pr
post-image
BTC-0.67%
BTC breaks below 71000 with 600 million in long possition
live-cover
LIVE2,180
Load More

Join 40 M users in our growing community

⚡️ Join 40 M users in the crypto craze discussion

💬 Engage with your favorite top creators

👍 See what interests you

Trending Topics

GateGlobalComplianceExpansion

15.89k Views351 Discussing

Gate continues to expand its global compliance footprint, now covering 81 regulated jurisdictions across Europe, North America, Asia, and Oceania. From MiCA and U.S. state-level MTLs to Japan’s FSA, Dubai, and Australia-related regulatory approvals, global exchanges are entering a new stage of compliance competition. Do you think regulatory strength will become as important as products and liquidity for exchanges in the future?

USOctoberCPIBeatsExpectations

87.04k Views2.64k Discussing

AnthropicIPOValuationCouldReach1.4T

12.22k Views1.61k Discussing

View More