Square
Following
Hot
News
Profile
Share your thoughts
placeholder
Article
Short around $ETH 2490, take profit at 2460–2410, stop loss at 2505. Follow me for precise strategies shared daily.
post-image
ETH-2.68%
$SUI After breaking below the moving averages, can it still hold up in the short term?
Conclusion first: The technical picture has weakened; the rebound favors shorts rather than longs, and 1.0561 looks more like a continuation point in the decline than a bottom.
$SUI The current price is 1.0561, down 7.06% over 24h, with a trading volume of 112.7M USDT, indicating a high-volume sell-off. In terms of the moving-average structure, the price has fallen below MA5 and MA10, with MA5 beginning to cross below MA10 to form a short-term death cross. MA20 has turned downward after flattening, breaking
post-image
SUI-6.02%
ME-2.48%
$XAU
Looking at gold’s trend, you can really laugh out loud😅 A shake on the four-hour chart is tough enough for one day; after a month, you start questioning your life🙃 Once this wave gets me back to break-even, I’ll switch up my approach on MT4 and see how many more days it can keep bouncing around🤡
post-image
XAU+1.07%
CRYPTO MARKET UPDATE
live-cover
LIVE1,545
New Market update
live-cover
LIVE2,324
BTC/USDT MARKET UPDATE: IS BITCOIN PREPARING FOR A STRONG BOUNCE?
Bitcoin is showing an interesting price movement on the 4-hour chart! At the time of this snapshot, BTC is trading around $82,513, after experiencing a sharp decline from the $85,000–$86,000 region toward a recent low of approximately $80,397.
📊 Key Technical Levels to Watch
🔹 Current Price: $82,513
🔹 Immediate Resistance: $82,881
🔹 Major Resistance: $83,816
🔹 Strong Resistance Zone: $85,868–$87,513
🔹 Immediate Support: $81,875
🔹 Major Support: $80,397–$80,935
📉 What Is the Chart Telling Us?
Bitcoin recently faced stron
post-image
BTC-0.23%
$OGN The most dangerous misconception right now is equating “strong momentum” directly with “it is safe to keep chasing.”
This time, let’s ignore the gainers and losers rankings and only look at the price position. The current price is 0.04249, approximately 47.21% above the 1-hour support at 0.02243 and 25.79% below the resistance at 0.05345.
My criteria are simple: only a breakout above 0.05345 followed by continuation counts as an upside continuation; a break below 0.02243 invalidates the previous assessment. The 1-hour and 4-hour trends are relatively strong, with RSI at 49 and 77, respect
post-image
OGN+100.39%
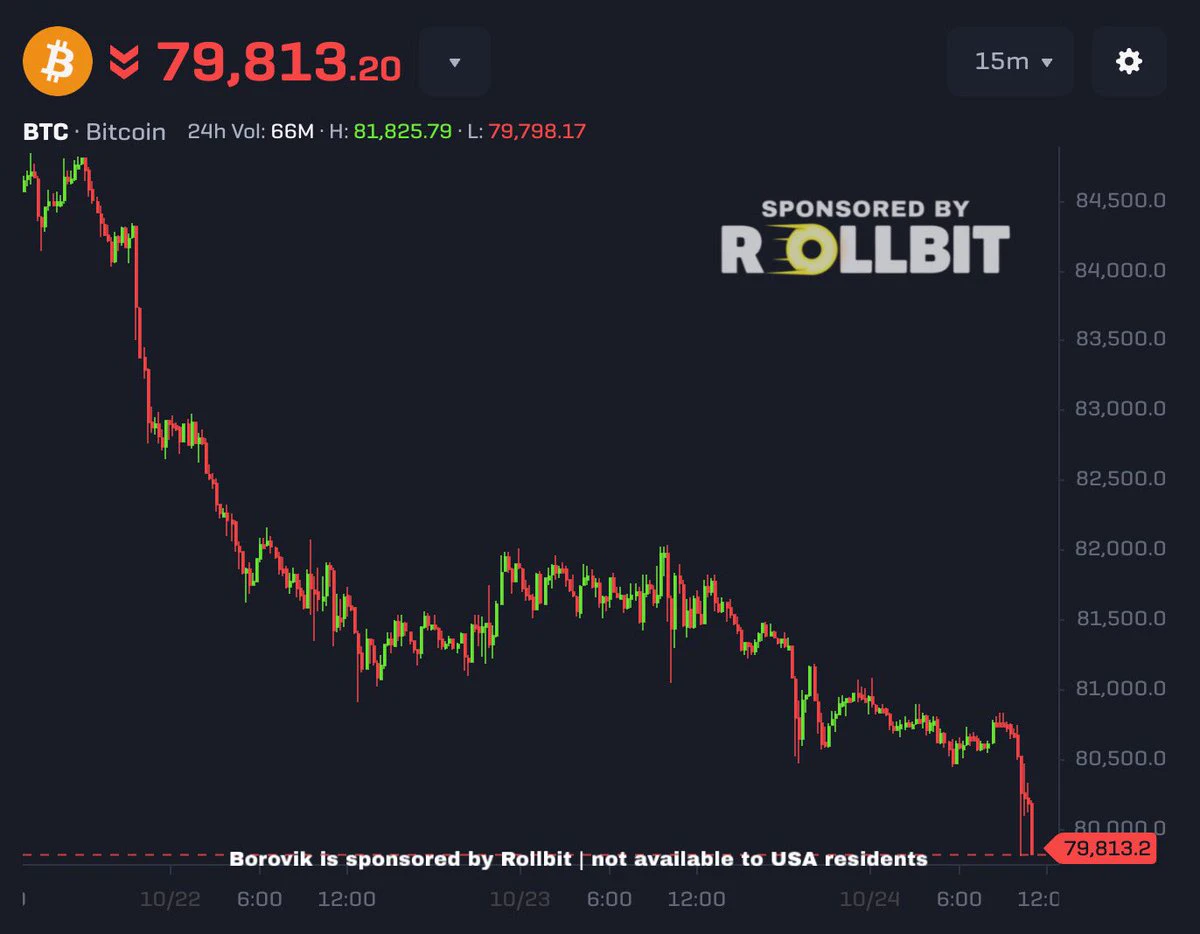
#BTC回调触及81000美元 A corpse lies at the bottom of the $81,000 pit: $429 million in liquidations has just been buried—dare you sleep in it?💀

BTC crashed to $81,125 yesterday, erasing half of September’s gains, then bounced back to $82K today. But don’t rush to mistake the “pit” for a “bed”—the $429 million in liquidation casualties at the bottom of this pit were just buried, with long liquidations accounting for 87.5%. Is $81K an “oversold bounce” or a “continuation of the decline”? Don’t look at the candlesticks—watch three things: the 10/14 CPI, whether ETF buying returns, and whether Treasur
post-image
BTC-0.23%
$BTC
The script twists again: Bitcoin had just touched $87,000 before tumbling back to the $80k mark. ETF funds have switched sides, flowing in yesterday and out today. A single-day outflow does not mean institutions are fleeing; keep a close eye on $80k. Reclaiming $83,000 means there’s still hope; if it can’t hold, altcoins are in for pain 😅
post-image
BTC-0.23%
I’ll say it first
Argonauts will flip Pudgy Penguins within the next few weeks
Flippening will happen around 1.68e
Argo coded
ack coded
post-image
PENGU-5.48%
Many people rush to buy the dip as soon as they see the price fall 2%, yet never check whether the moving-average alignment is healthy—this is the most common source of losses. Today, using $ETH , I’ll explain a reusable assessment method: moving-average entanglement.
Currently, $ETH ’s price is 2495.71, with MA5=2487.89 and MA20=2488.41 almost completely overlapping, differing by only 0.5 points. This indicates that long and short cost bases are highly overlapped, and that the trend is in a compressed state before choosing a direction rather than a healthy one-way trend. RSI=45.6 is in the ne
post-image
ETH-2.68%
DOT+5.69%
AMP+19.16%
#每周来晒 #美联储9月纪要偏鹰
Probability of an October Rate Hike
A Federal Reserve rate hike at the upcoming October 27–28 meeting is unlikely.
Although the September meeting minutes showed unanimous agreement on raising the federal funds rate to 3.75%–4.00% and left open the possibility of further tightening before year-end, several factors favor a pause in October:
Stale Sentiment in September Minutes: The September meeting took place prior to key labor market and price data. Sub-30,000 job additions in September (+29,000) and cooler wage growth signaled cooling economic momentum.
Lagged Tran
post-image
BTC-0.23%
MU-4.83%
NVDA-2.86%
NDAQ+0.51%
☀️ GM! The market is a bit bumpy—have you fastened your seatbelt? 🎢
The market could shift gears at any moment. Is your trading plan keeping up?
📌 Today's featured topic: Facing market volatility, what is your “seatbelt”?
🛡️ How do you manage your positions?
👀 What risk signals are you watching most closely right now?
📝 Have you made any trades recently that are worth reviewing?
Seize opportunities, but manage risks too.
Come to Gate Square to share your trading strategies and reviews. High-quality content may receive featured recommendations and additional traffic support.
👇 Share your
post-image
Universe, I dropped it here.
Feel free to call me a madman
$BTC Long
Entry: $35k
Sl: $26k
TP: Valhalla
You can thank me later 😉
post-image
BTC-0.23%
In October, market sentiment toward Ethereum is bearish, with the vast majority of participants believing ETH has momentum to test below 2400.
Breaking below 2400 is the baseline expectation; a further decline to 2300 or 2200 would be an unexpected downside move with a significant odds advantage.
Overall, short-term downside expectations are strong, but the probability of an extreme plunge is limited, with the main strategy focused on trading range-bound bottom-finding.
post-image
ETH-2.68%
$ETH ETH is currently priced at 2490. Its intraday trend has weakened in sync with BTC, with greater elasticity and a relatively sharper pullback. The bulls lack sufficient rebound strength, and every minor rebound encounters selling pressure. On the four-hour chart, short-term moving averages continue to exert downward pressure. The primary resistance is near 2550; only a high-volume breakout and stabilization above this level would create an opportunity for a recovery, otherwise prices will remain in weak consolidation. The first support below is around 2440. If this support is decisively br
post-image
ETH-2.68%
$ORCA Current price 2.492, down 14.42% over 24h, with a trading volume of 9.4M USDT, making it the only declining token among the three candidates; however, MA5=2.411 remains below MA20=2.47265, RSI 47.8 is neutral to weak, the MACD histogram at +0.01795 maintains bullish momentum, the price is near the Bollinger middle band within the 2.1652–2.7801 range, the amplitude over 30 candles is approximately 33.11%, and the funding rate of -0.0578% indicates a structure where shorts pay longs. Compared with $RLC
, which rose 38.09%, and $CTSI , which rose 17.71% over the same period, both have MA5
post-image
CTSI+16.03%
Envy King Zhou, become King Zhou, surpass King Zhou
In China, as long as they don’t cross political red lines, wealthy people should genuinely be able to live like ancient emperors.
post-image
Another day of getting our faces washed by a waterfall.
According to CoinGlass, liquidations totaled $1.204 billion over the past 24 hours, including $1.053 billion in long positions and $150 million in short positions. A total of 194486 people were liquidated.
The largest single liquidation occurred on Hyperliquid - ETH, valued at $19.9817 million.
Another victory for the bears. The bulls really are having a difficult journey, with so many forks in the road!
post-image
HYPE-1.93%
ETH-2.73%
  • 4
  • 2
#BTC回调触及81000美元 Can Bitcoin withstand $80k? These data points are worth a look
Yesterday, Bitcoin briefly fell below $81k, nearly breaching the $80k round-number threshold. Derivatives market liquidations exceeded $1.16 billion over 24 hours, with $1 billion coming from longs.
Glassnode said in an October 7 report that the ratio of open interest to market capitalization for large-cap altcoins has reached its highest level since before the October 2025 crash. Leverage has piled up too heavily, so any price drop triggers cascading liquidations.
CryptoQuant data shows that short-term holders tran
post-image
BTC-0.23%
Load More

Join 40 M users in our growing community

⚡️ Join 40 M users in the crypto craze discussion

💬 Engage with your favorite top creators

👍 See what interests you

Trending Topics

GateAtTOKEN2049

35.2k Views20.77k Discussing

Gate brought a series of major events to TOKEN2049 Singapore! From the official launch of Gate Money to the F1 Red Bull driver meet-and-greet and the Gate Gala, we witnessed a new chapter of "One Gate, Borderless Finance." Which moment from TOKEN2049 stood out most to you?

BTC Pulls Back to 81000

25.41k Views35.68k Discussing

AIStocksFallALABDropsOver9%

24.61k Views550 Discussing

View More