Square
Following
Hot
News
Notifications
Profile
Share your thoughts
placeholder
Article
$ARIA I nearly paid tuition again on this move—just last week, I cut my losses and got out down 3,700U, with only 2,100 left in my account at its lowest. Then today it shot straight up to 0.2529, gaining 28.5% in 24h, with trading value hitting 86.4M. I stared at the candlestick chart and slapped myself twice.
Reviewing my terrible trades: I chased in around 0.1980 and didn’t sell when it rose to 0.2150, dreaming it would break above 0.25. Then it pulled back to 0.19, I panicked, and sold everything at 0.1920. Right after I sold, it took off for a second time, reaching a high of 0.2720. A clas
ARIA+22.03%
  • 2
A whale adds to long positons whenever ZEC falls
live-cover
LIVE1,899
Trenches
mihao
m
bade
b
mihao
4Cxj...pump
Market Cap
$.
Change
.
24h Vol
$.
Holders
.
bill
b
bade
b
bill
85Rh...pump
Market Cap
$.
Change
.
24h Vol
$.
Holders
.
rockstar
r
bade
b
rockstar
9HFU...pump
Market Cap
$.
Change
.
24h Vol
$.
Holders
.
PIEVERSE
P
bade
b
PIEVERSE
0x0e...25a9
Market Cap
$.
Change
.
24h Vol
$.
Holders
.
AGT
A
bade
b
AGT
0x5d...e274
Market Cap
$.
Change
.
24h Vol
$.
Holders
.
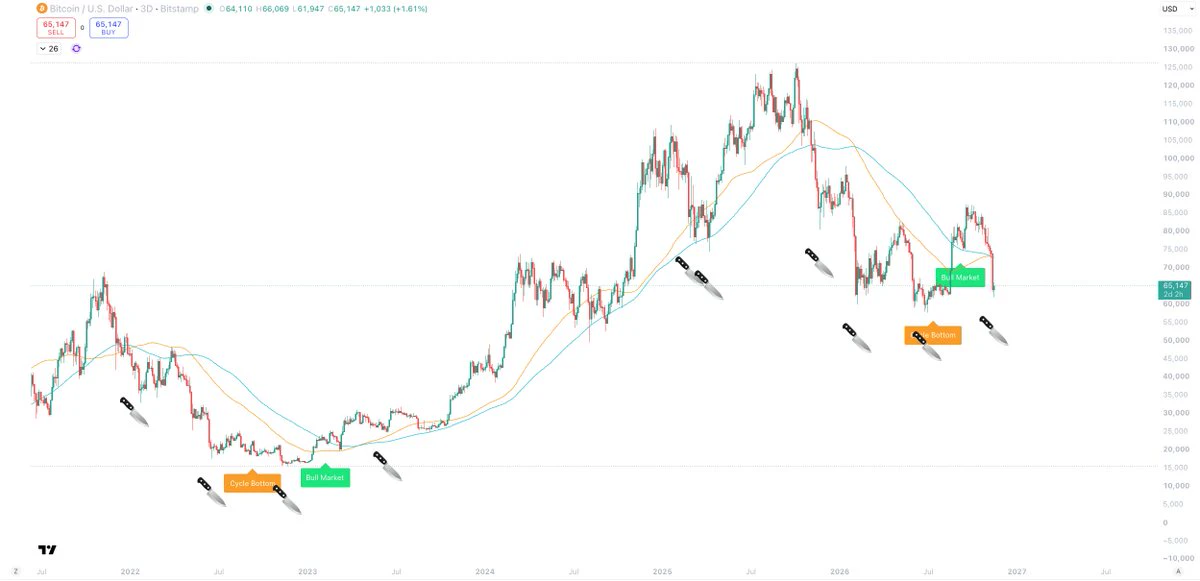
This signal has been 100% correct over the past 5 years.
It just fired again at $62,000.
This signal has confirmed each major low that it has fired for.
It fired for each major low since the October top, confirming the low to the day.
No signal is perfect, but this is one I watch very closely.
It does not make mistakes.
Again, there is always a first for everything, but this is programmed to signal these types of lows, as they all exhibit the same behaviour.
This firing is a positive sign.
Twice in the last 5 years the price has gone slightly lower after, but then another signal has fired.
Ult
post-image
??
making back the $6b
▓▓▓▓░░░░░░░░░░░░░░░░░░░░░ 1%
post-image
whales Moves in sync!
live-cover
LIVE684
I thought you still had more in the tank, $EVAA . Everyone was getting ready for another leg up, but you hit the ceiling and decided to take a long nap. You made us chase the top like idiots. Take profit: 2.3481 Stop loss: 3.1119 Market watch: $SPACE : Current price 0.003035 - 24-hour change: +14.74%$XRP : Current price 0.9754 - 24-hour change: +8.61%
post-image
EVAA-0.49%
SPACE-1.66%
XRP-1.15%
$SPY, despite what most of the timeline has been saying. We are still in a good spot here.
We got a nice wick into the monthly OB.
We are still respecting the weekly OB.
If we close above $7,720. I think we rip back to all-time highs.
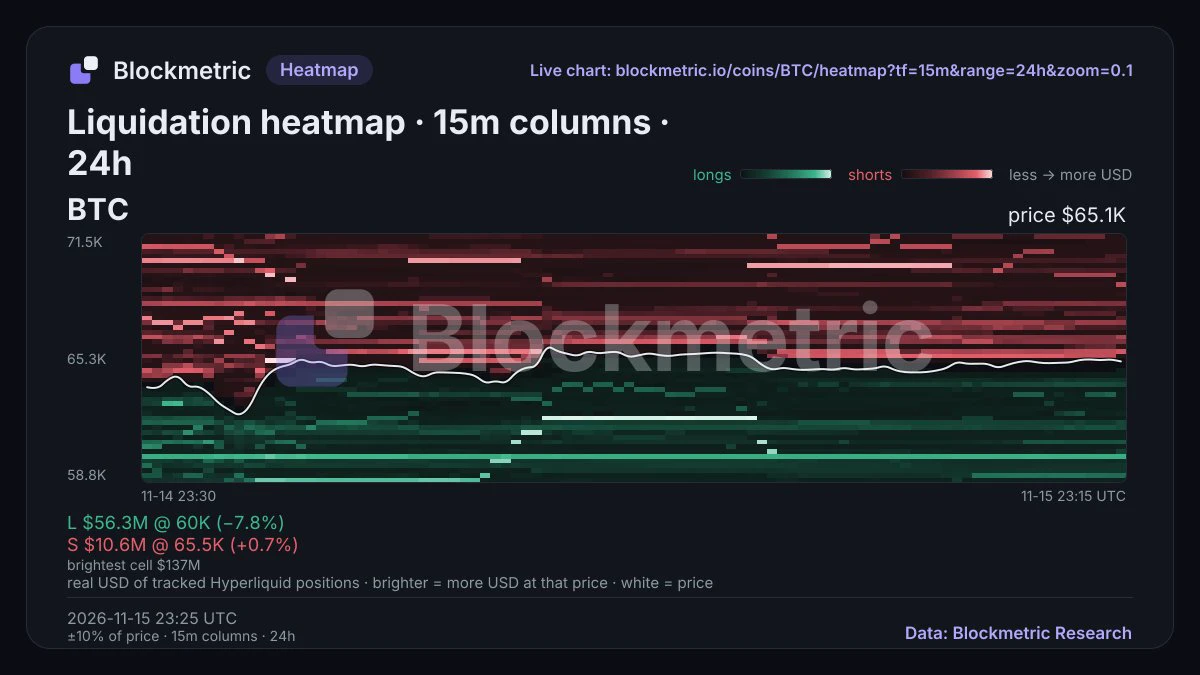
🚨 Guys, yesterday’s BTC wick was fucking brutal!
It plunged straight to a low of $61,956!
Then, within a few hours, it climbed back to around $65,000.
A lot of people are already starting to say:
“The bottom is in!”
I’d tell everyone not to rush to that conclusion.
I went back over the daily chart, liquidation map, and the entire structure of this downtrend.
There are a few levels I’m laying out in advance today.
First, why did BTC suddenly bounce near $61,900 yesterday?
In the previous leg, BTC rose from around $57,500 to $87,300.
A deep retracement of that entire uptrend:
Put $61,300 near a
post-image
BTC-0.67%
$FET Bullish signals are emerging—the pullback is nearing its end, bulls have reclaimed the short-term moving averages, and the next step is to challenge the previous high.
Trading plan ($FET buy the dip): Entry zone: 0.1308 – 0.1325 Take-profit targets: 0.1375 – 0.1422 Stop-loss: 0.1269
One reminder: The 1-hour MA99 is just overhead and may act as resistance, so don’t expect a clean breakout in one go. Also, don’t get carried away and go all-in; your position size must match your account size.
Risk warning: The above is only a personal trading idea and does not constitute investment advice.
post-image
FET-1.52%
CPI puts rate hikes back on the table, and interest rates are carrying more weight in BTC’s pricing framework

The U.S. October CPI released on November 10 rose 0.4% month over month, above expectations of 0.3%; core CPI rose 0.3% month over month, also above expectations of 0.2%. Core CPI has now held at a 0.3% monthly increase for three consecutive months. Fu Yifu, a researcher at SuShang Bank, broke it down this way: energy price increases are narrowing, but food prices are accelerating; housing costs remain the main contributor, while services categories such as transportation, healthcare,
BTC-0.65%
Asking for a friend, but WT* is this cat in my timeline?
post-image
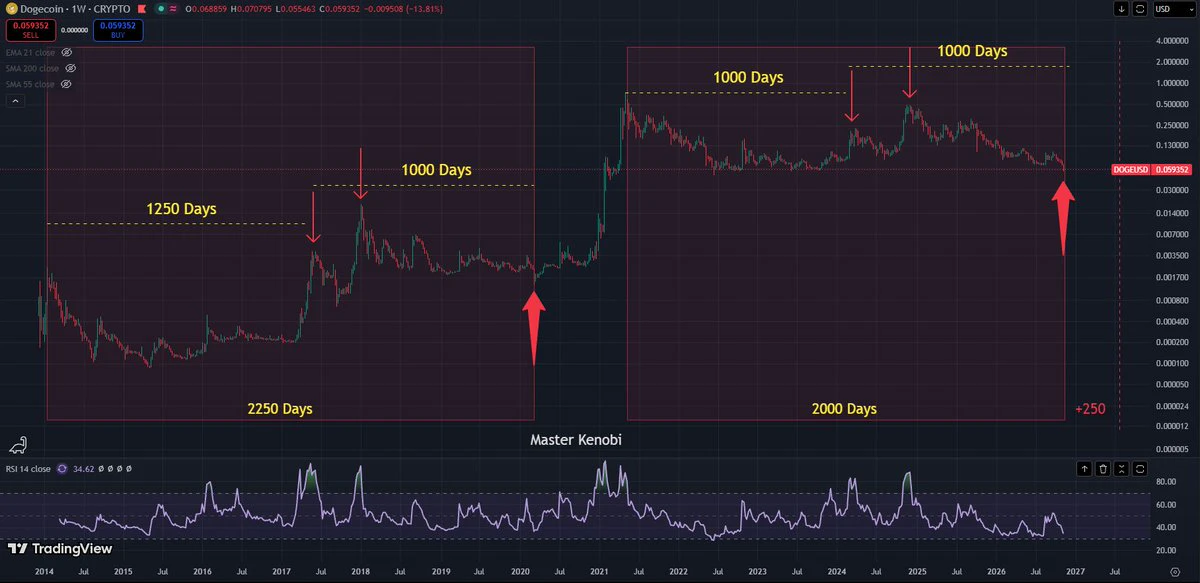
💡 DOGE chart for speculation lovers.
☝️ Those who see financial advice here are drooling idiots.
post-image
DOGE-0.22%
Yuh, run it 🕹️☕
post-image
$SPY . However, if we are in for a deeper S&P 500 correction, we could be seeing the start of a short setup here.
If we are going to take the weekly lows shown below, I want to see the weekly breaker resistance cap price and a daily close below the MSB level at $7,295.
SPY+0.06%
SPX500+0.19%
Cooling employment collides with stubborn inflation, as the most painful “stagflation-like” scenario unfolds

Today’s initial jobless claims data, coming on top of yesterday’s CPI, has pushed the market into an extremely awkward macroeconomic mix: inflation remains stubborn, but the labor market is beginning to show signs of fatigue. This is the kind of “stagflation-like” signal that economists find most troubling.

Look, if inflation were simply running high, a strong economy would mean companies could still turn a profit, allowing stocks and crypto to grit their teeth and weather it. If the
AMD-8.76%
$BANANAS31 Up 17.72% in 24 hours, the current price of 0.0050 is right at the 24-hour high. A close at the high like this is either consolidation before a breakout or one last push before a bull trap. I’m still holding the long I opened yesterday at 0.0043, with an unrealized gain of around 16%, but I haven’t added because the risk-reward ratio of chasing at this level isn’t worthwhile.
Here’s my reasoning. Fundamentally, meme coins like BANANAS31 have no traditional revenue model; their core drivers are community hype and the distribution of on-chain holdings. 24-hour trading volume of 15M is
BANANAS31-3.28%
  • 2
  • 1
seeing both still and video media types in @bis__cut x ito's 111k warms my heart
it's the @J48BAFORMS 2023 vision but in 2026, several trillion exponential AI evolutions later
Actually, I'm still working on the “golden dog” tracker I built last summer.
I still believe in Solana. I still believe in blockchain.
SOL-0.77%
🚨 WEB3AUTH SAYS FUNDS AFFECTED BY THE WALLET BREACH ARE SAFE!
RECOVERY INSTRUCTIONS COMING SOON.
⚠️ KEPLR & TORUS USERS: IGNORE FAKE RECOVERY MESSAGES!
post-image
Load More

Join 40 M users in our growing community

⚡️ Join 40 M users in the crypto craze discussion

💬 Engage with your favorite top creators

👍 See what interests you

Trending Topics

GateIPOAccessAnthropic

373.2K Views2.8K Discussing

Gate IPO Access Phase 3 features Anthropic (ANT), with USDT subscription interest starting from 100 USDT. Successful allocations will be delivered as real shares to Gate Stock Accounts. Indicative price: $70–$78/share Subscription: Nov 12–17 (UTC+8) Allocation is not guaranteed. Please manage risk accordingly.

Dr.HanOxfordUnionSpeech

153.4K Views519 Discussing

USOctoberPPIBelowExpectations

491.2K Views1.6K Discussing

View More