



Square
Following
Hot
News
Profile
Share your thoughts
placeholder
Article
BTC MARKET UPDATES
live-cover
LIVE1,285
The doodle artist strikes!
Have you ever seen a big-tailed cat😂😂😂?
post-image
Trenches
AGT
A
bade
b
AGT
0x5d...e274
Market Cap
$.
Change
.
24h Vol
$.
Holders
.
CNPY
C
bade
b
CNPY
0xc6...ddd2
Market Cap
$.
Change
.
24h Vol
$.
Holders
.
FOLIO
F
bade
b
FOLIO
0x5f...e411
Market Cap
$.
Change
.
24h Vol
$.
Holders
.
Q
Q
bade
b
Q
0xc0...0589
Market Cap
$.
Change
.
24h Vol
$.
Holders
.
FTR
F
bade
b
FTR
DFMt...pump
Market Cap
$.
Change
.
24h Vol
$.
Holders
.
the average martingalers bankroll history
post-image
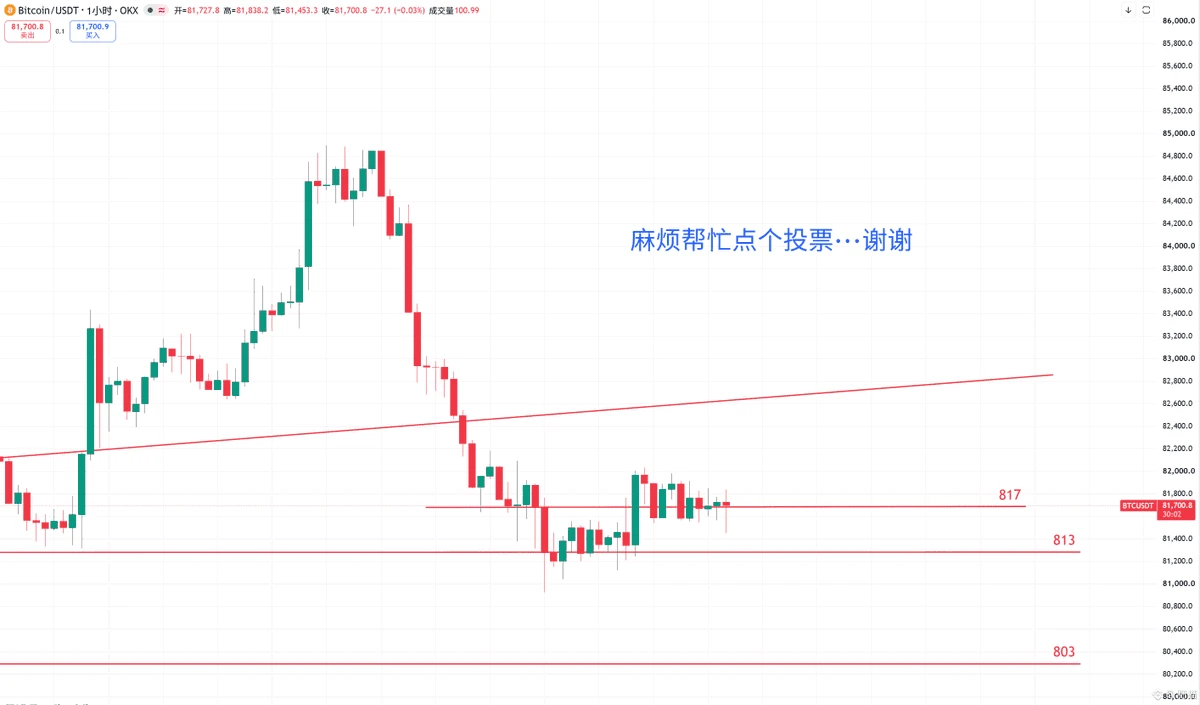
Will #Bitcoin grab the last longs before 85K?
post-image
BTC+0.56%
$NEAR Short-term outlook: Bullish, but this is a weak rebound rather than a trend reversal; the key is to use the moving-average structure to judge whether the trend is healthy. MA5=4.9252 is still below MA20=5.0484, the bearish moving-average alignment remains intact, RSI=41.7 is in the neutral-to-weak range, and the MACD histogram=-0.01993 remains negative, indicating that mid-term momentum has not turned bullish yet. A reusable approach is to first determine direction from the moving-average alignment, then assess the risk-reward ratio based on the price’s position relative to the Bollinge
post-image
NEAR-0.70%
ALT+11.75%
WLD+0.82%
$AGT went from 1.6 cents to 8 cents. I can’t find the reason.
Look at the chart. It sat flat for a long time, jumped, paused, then jumped again. Now it’s about 5x higher.
It also passed its old high of around 4 cents, which makes this more than a bounce.
Normally a move this big has a reason: a partnership, a product launch or an exchange announcement. I looked for one on Alaya AI, the AI data project behind AGT, and found nothing.
One more fact: only about 58% of AGT’s supply is in circulation. The other 42% is still to come.
A big move with no visible reason usually means the story is arriv
post-image
AGT+90.11%
Crypto Trade Today
live-cover
LIVE1,664
🔥 HUGE: Fed will pump $14.6 Billion into the markets in the next 3 weeks
More liquidity for the bull run
Stayed up refreshing on a weekend night, just waiting for the last batch of macro data to land. We’ll see once it’s out. This round, both inflation and industrial production data came in above expectations, and nobody can say for sure whether there’ll be another tightening move this year. After watching candlesticks for years, I only believe one thing: few people who bet on data come out ahead.
The market has only just recovered from that brutal beating. Leverage in the market has been wiped out, and the wounds are still fresh.
$ZEC Going to look at spot right now is unusual in itself—heard i
post-image
ZEC+0.39%
And someone will tell me that grok is the most accurate AI. @grok is so inaccurate that you can't believe anything it says!
$Q Going long while telling others to go short? Definitely an insider
Q+120.72%
$Q ‌Don't even think about sleeping today
post-image
Q+120.72%
VIP Exclusive Airdrop Carnival, Round 19
post-image
welcome to the badlands
$GPRO #COMPX
post-image
#美股存储板块跌幅扩大 The Nature of the U.S. Tech Pullback Is Shifting: From Valuation Repricing to Credit-Chain Repricing
Many people are still viewing U.S. stocks through the old “AI pullback = buying opportunity” playbook. But if you only watch the Nasdaq and the Philadelphia Semiconductor Index, you may miss the most important change:
July was “AI valuation/positioning repricing”; October is a triple hit from “the AI credit chain + high interest rates + geopolitics/oil prices.” The latter is closer to a “credit-side preview” of the bursting of the 2000 internet bubble, but we’re not yet in a full-bl
post-image
$FIL I held through this whole move from 1.8 down to 1.05, and only learned to shut up after cutting losses of over $40,000. It’s now at 1.0641, down another 7.28% over 24h, with $165 million in trading volume—volume hasn’t dried up, which means panic selling is still underway. I’m not guessing the bottom; I’m following the data: the previous low of 1.0582 is the line in the sand. If it breaks, I’m looking at 0.9. My plan now: a 30% core position, scaling in between 1.06 and 1.08, selling half on a rebound to 1.15, with strong resistance at 1.22. Stop-loss at 1.03; if it breaks, I take the los
FIL-5.21%
The Fear & Greed Index remains in the greed zone at 55, but $BNB is currently at 716.14, down slightly by 0.54% over 24h. MA5=716.316 has crossed below MA20=720.143, RSI is only 36.9 and nearing the weak zone, the MACD histogram remains bearish at -0.4738, and the price is near the lower Bollinger Band at 714.526. The funding rate of 0.0000% indicates that long leverage has been largely cleared out. With overall market sentiment warm while leading coins weaken, this is a typical high-level sector rotation—capital is flowing out of major assets and into high-volatility catch-up plays like $EPIC
post-image
HYPE+0.02%
In this round of Trump’s tariffs, even the WTO has admitted it was bypassed. The rules are still there, but the power to enforce them is gone. It’s respectable for member countries to follow the rules, but when a major power imposes tariffs, that respectability becomes mere window dressing. Who can this framework still hold in check going forward? If you see it differently, explain why.
post-image
$ETH #美国9月PPI大超预期 Crypto Academician: 10.18 Ethereum (ETH)’s medium-term uptrend remains intact, but bears have completely taken control in the short term
Yesterday, a follower told me he went long at 2700 and has held on until now, but is almost at his breaking point. I really understand that feeling—watching unrealized losses grow day by day, unable to sleep at night and feeling drained during the day. But I want to say this: in trading, position management is ten times more important than getting the direction right. If you’re holding a full position, even if you get the direction right, on
ETH+0.58%
#GateBTCAndETHFuturesVolumeRanksTop3
Gate’s BTC and ETH Futures Surge: Exploring the Power of Volume, Liquidity, and Market Confidence
1. Gate Strengthens Its Position in the Global Futures Market
The cryptocurrency derivatives market continues to evolve as traders look for better liquidity, efficient execution, advanced trading tools, and access to major digital assets. Against this competitive background, Gate is attracting attention with its reported Top 3 global ranking for Bitcoin and Ethereum futures trading volume.
According to the figures provided, Gate recorded approximately $4.89 bi
BTC+0.56%
ETH+0.58%
Load More

Join 40 M users in our growing community

⚡️ Join 40 M users in the crypto craze discussion

💬 Engage with your favorite top creators

👍 See what interests you

Trending Topics

USSeptemberPPIBeatsExpectations

91.35k Views1.93k Discussing

US September PPI came in at 6.3% YoY, well above the 5.3% market expectation, pointing to renewed producer-side inflation pressure. Weekly jobless claims were 199K, broadly in line with forecasts. Could hotter inflation further reduce room for rate cuts, and what does it mean for $BTC, US stocks, and gold?

GateWCTCS9GlobalTradingCompetition

37.87k Views6.67k Discussing

GateBTCAndETHFuturesVolumeRanksTop3

53.8k Views1.8k Discussing

View More