Square
Following
Hot
News
Notifications
Profile
Share your thoughts
placeholder
Article
$ZEC Short-term, short both, both moving down
Waited all morning
BTC and ETH basically showed no movement
So I also traded secondary-tier ZEC

This time, my friend took +2,230U off the table
15 points of movement in total

Now the top two fluctuate every day
So I may as well lean toward altcoins or secondary-tier coins
#非农之夜
ZEC+1.29%
new steamer BTS market
live-cover
LIVE1,580
Trenches
BTC
B
bade
b
BTC
C5xp...pump
Market Cap
$.
Change
.
24h Vol
$.
Holders
.
ZIG
Z
bade
b
ZIG
0x8c...1145
Market Cap
$.
Change
.
24h Vol
$.
Holders
.
GM
G
bade
b
GM
0x13...7777
Market Cap
$.
Change
.
24h Vol
$.
Holders
.
STONK
S
bade
b
STONK
6GmA...UNgx
Market Cap
$.
Change
.
24h Vol
$.
Holders
.
DESSA
D
bade
b
DESSA
npz2...pump
Market Cap
$.
Change
.
24h Vol
$.
Holders
.
#DemocratsWinBothChambers #ShareWeekly

A New Political Era for Wall Street: Could Washington's Power Shift Trigger the Next Major Rotation Away From AI Stocks?

The U.S. midterm election results have introduced a potentially significant turning point for financial markets. With Democrats winning control of both chambers of Congress, investors are beginning to reassess the relationship between government policy, corporate spending, inflation, and the future of artificial intelligence.

In my view, this development should not be interpreted simply as good news for traditional stocks or bad
MSFT-3.65%
AMZN-2.11%
GOOGL-2.22%
Whether the AI bubble has burst is anyone’s guess, but Wall Street has already started worrying about whether Masayoshi Son can repay his debts.
On November 6, SoftBank’s 5-year credit default swap (CDS) spread surged to 462 basis points, its highest level since October 2022.
Look at SoftBank’s hand: about $64.6 billion worth of OpenAI equity, a controlling stake in Arm, and AI data centers through SB Energy.
The company has spread itself extremely thin, ramped up AI investment, and seen financing costs climb, while meaningful profit returns are still a long way off.
Xiaohuihui has always beli
post-image
OPENAI-0.04%
ARM-13.33%
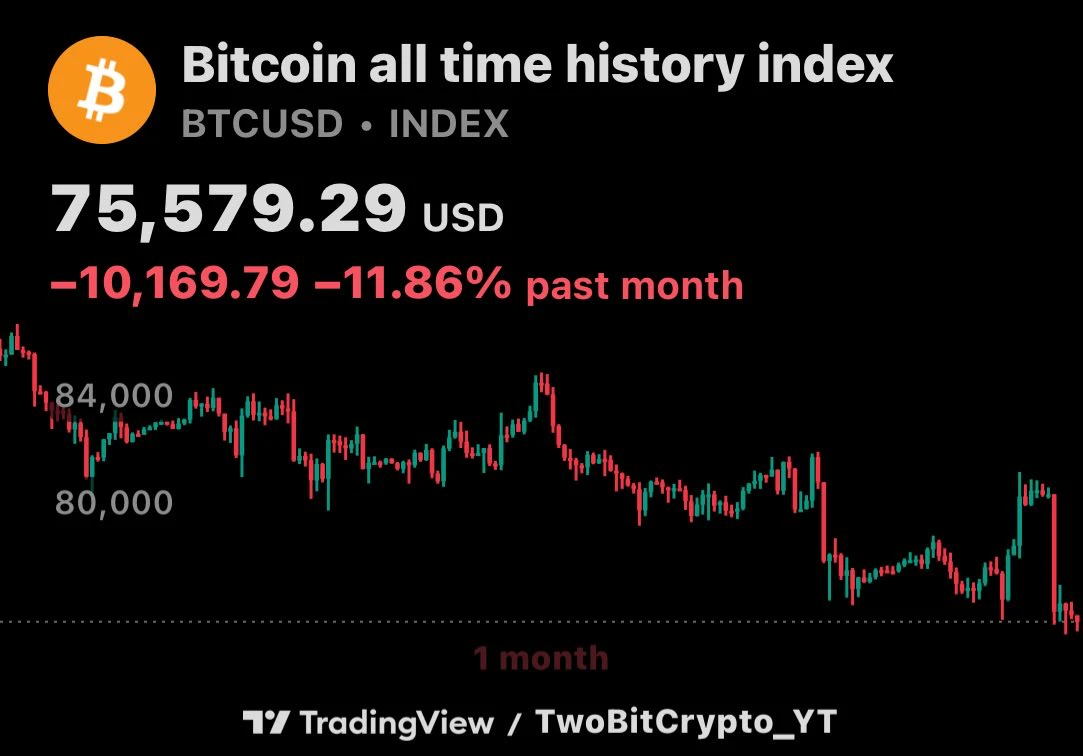
$BTC fell 5.95% in the 24 hours to Nov 6, yet order flow was among the least one sided in 90 days. US traders have bid below the global price for 62 straight days. On $ADA , leveraged longs were forced out as open bets shrank 12.9%.
BTC-0.67%
ADA-1.41%
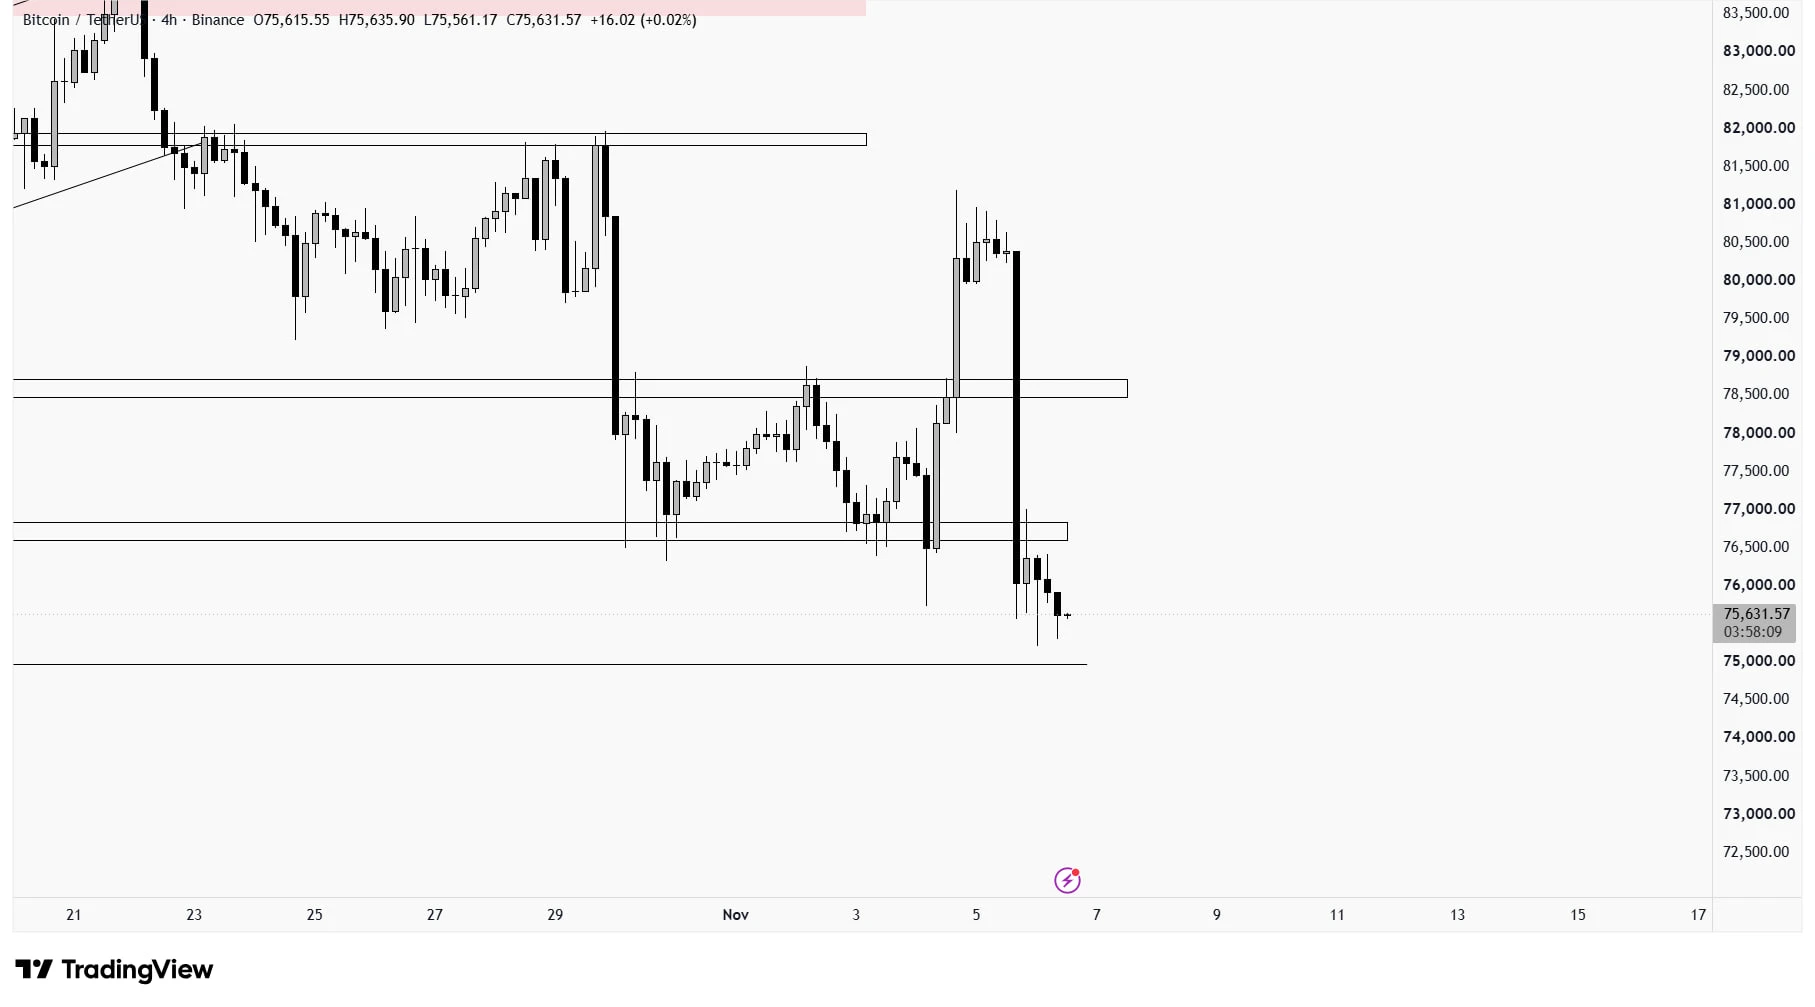
$BTC is under heavy pressure after breaking below its key support zone.

Price has already retested the broken level and is now moving toward the previous low, where liquidity could be waiting.

I'm watching for a possible liquidity sweep followed by a strong reversal. If buyers step in and reclaim support, BTC could make a sharp recovery.

One liquidity grab could change the entire market structure. Eyes on BTC
post-image
BTC-0.67%
#Gate上线台股交易
Artificial Intelligence Stocks and Asia’s Semiconductor Supply Chain: November 2026 Market Analysis

1. General assessment of the market outlook

My preferred strategy is a cautious yet optimistic (bullish) approach, which focuses more heavily on Asia’s artificial intelligence (AI) semiconductor supply chain while incorporating selective investments in U.S. tech leaders.

The investment opportunity in AI is expanding well beyond just the companies developing AI models and processors. It increasingly encompasses firms that manufacture advanced chips, supply high-bandwidth memory (HB
MU-17.23%
NVDA-9.33%
  • 12
Free Claim Airdrop MARS
live-cover
LIVE1,126
11.6
A lot of long positions got liquidated yesterday!

The market doesn’t favor every gambler. Those of us who survived were simply lucky—we happened to read the market correctly.

Whenever I make it through a major market swing like this, I’m not really that happy. Instead, I think about how to survive the next one. Position management, risk control, and consistent execution of take-profit and stop-loss plans all need to work together for us to go further.$BTC $ETH #美股史诗级抛售
FyPaymentMadeEasy
11.6
We have fully entered the bottom-fishing moment!!!
Three months from now, when you look back at today's prices, you'll be glad you chose to get in!!!

BTC's daily and weekly charts have both reached support at EMA21 and the 25-period short-term cycle. How low could it go? At worst, only to the weekly MA200, around 73000. I've started bottom-fishing; the lower it goes, the more I buy!!!

Buy when nobody cares
Sell when everyone is talking about it
$BTC $ETH #美股史诗级抛售

repost-content-media
BTC-0.65%
ETH-1.23%
Gm to the real ones
Question;
Is this the q4 low or are we seeing$60k again ?
post-image
i read the q3 revenue from @turtledotxyz and wondered what would make an issuer come back after its first vault. would it pay turtle to help reach depositors again, or would it already have the relationships it needed?
the update puts q3 revenue at $1.04M across turtle and lunar strategy, on a cash in basis and net of intercompany. that came from services and distribution while turtle was still building its tools.
say the same issuer launches a second vault. it can email the people who used the first one. but if this vault is aimed at a different kind of depositor, that list only gets it so fa
post-image
TURTLE-1.65%
#BTC
11.6 Bitcoin analysis
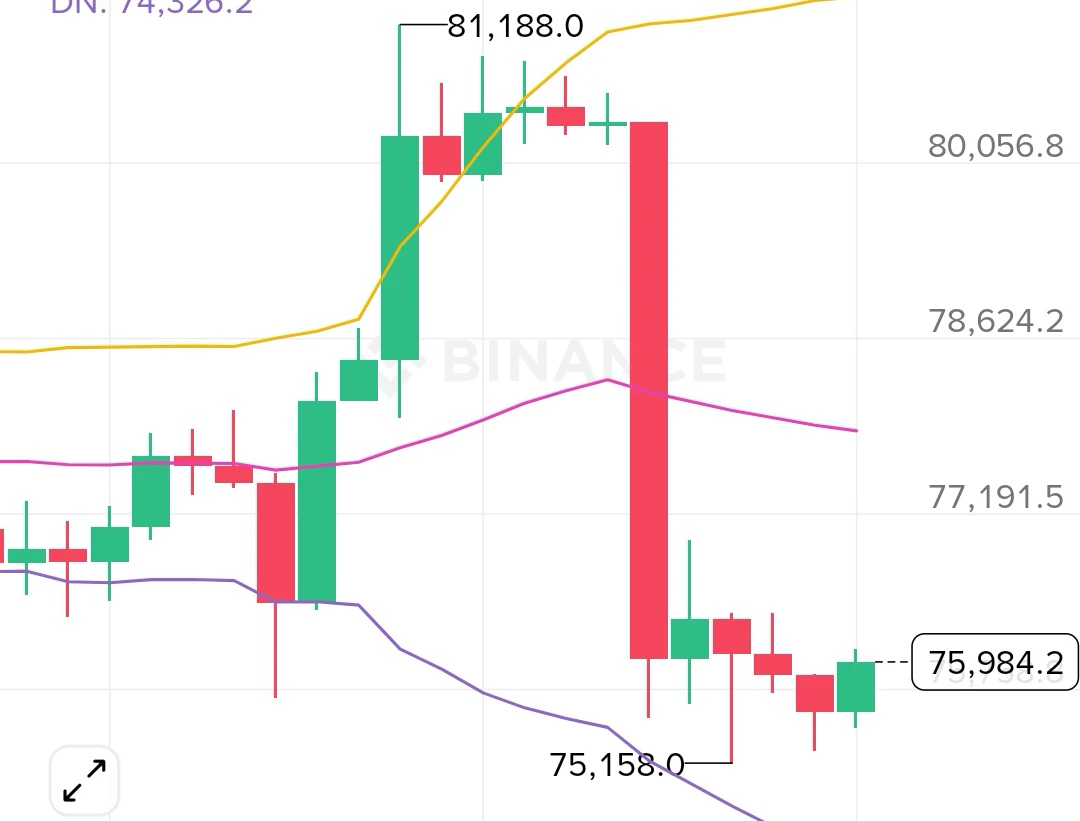
On the 4-hour chart, selling pressure has pushed price below the Bollinger middle band, with bears in control. KDJ indicates oversold conditions, so those looking to trade short-term can try to catch a small rebound. The first resistance above is 77800, with support below at 75158. If price fails to reclaim the middle band, the bias remains bearish, with further downside likely.
Trading suggestion:
Short in the 76500-7700 range, targeting further downside; stop-loss at 77800
post-image
BTC-0.67%
📈 Top traders—let the data speak!
CFD Contract Lead Traders: 7-Day Return Leaderboard
🥇 Watching Time Pass: +1074%
🥈 Jiuyi Gold Strategy No. 1: +967%
🥉 Climbing Uphill: +675%
Their track records speak for themselves; choosing the right trader is key.
Follow well-established traditional financial strategies for CFDs to easily access major markets, including gold, forex, indices, and popular U.S. stocks, and help your capital grow more efficiently.
👉 Follow now:
https://www.gate.com/zh/copytrading/tradfi
#CFD#传统金融 #跟单 #收益
XAUUSD-0.37%
  • 8
  • 1
📡 Signal Card | Reposting, not leading the trade
11-06 Jotham’s damn channel has a new signal:
Asset: $ETHFI Long entry: 0.6201 Target: 0.7992 Stop-loss: 0.5821 Time: Just posted in the channel; I repost as soon as I see it
Come to think of it, I reposted this person’s $BCH trade earlier today, and here they are again—really quick on the trigger 👀
Just so we’re clear: I only repost the signal as-is. All five details are there, but I’m not vouching for the signal itself. Whether to follow and how much to put in is up to you—getting carried away on a single trade can get you burned.
Shared f
ETHFI+1.48%
BCH+1.05%
Situational Awareness performance this past month
# Hot Wallets and Cold Wallets: What Roles Should They Play?

In the Web3 world, some users keep all their assets in one wallet for convenience when trading, participating in DeFi, or connecting to various applications.

Others believe that using a cold wallet is enough to completely solve asset security problems.

But both approaches overlook a key issue:

**Wallet security depends not only on the type of wallet you use, but also on how you allocate assets, manage permissions, and handle everyday transactions.**

Hot wallets and cold wallets are not an either-or choice. They serve different p
post-image
What Is a Stop-Loss Order? Why Is Setting a Stop-Loss Important, Yet No Guarantee You’ll Exit at the Expected Price Every Time?

In cryptocurrency trading, no one can accurately predict price direction all the time. The purpose of a stop-loss is not to ensure that a trade never loses money, but to limit risk in advance when the market moves against expectations and prevent losses on a single trade from continuing to grow. However, a stop-loss is not an absolute safeguard; in extreme market conditions, execution slippage can still occur.

First, what is a stop-loss order?

A stop-loss order is
post-image
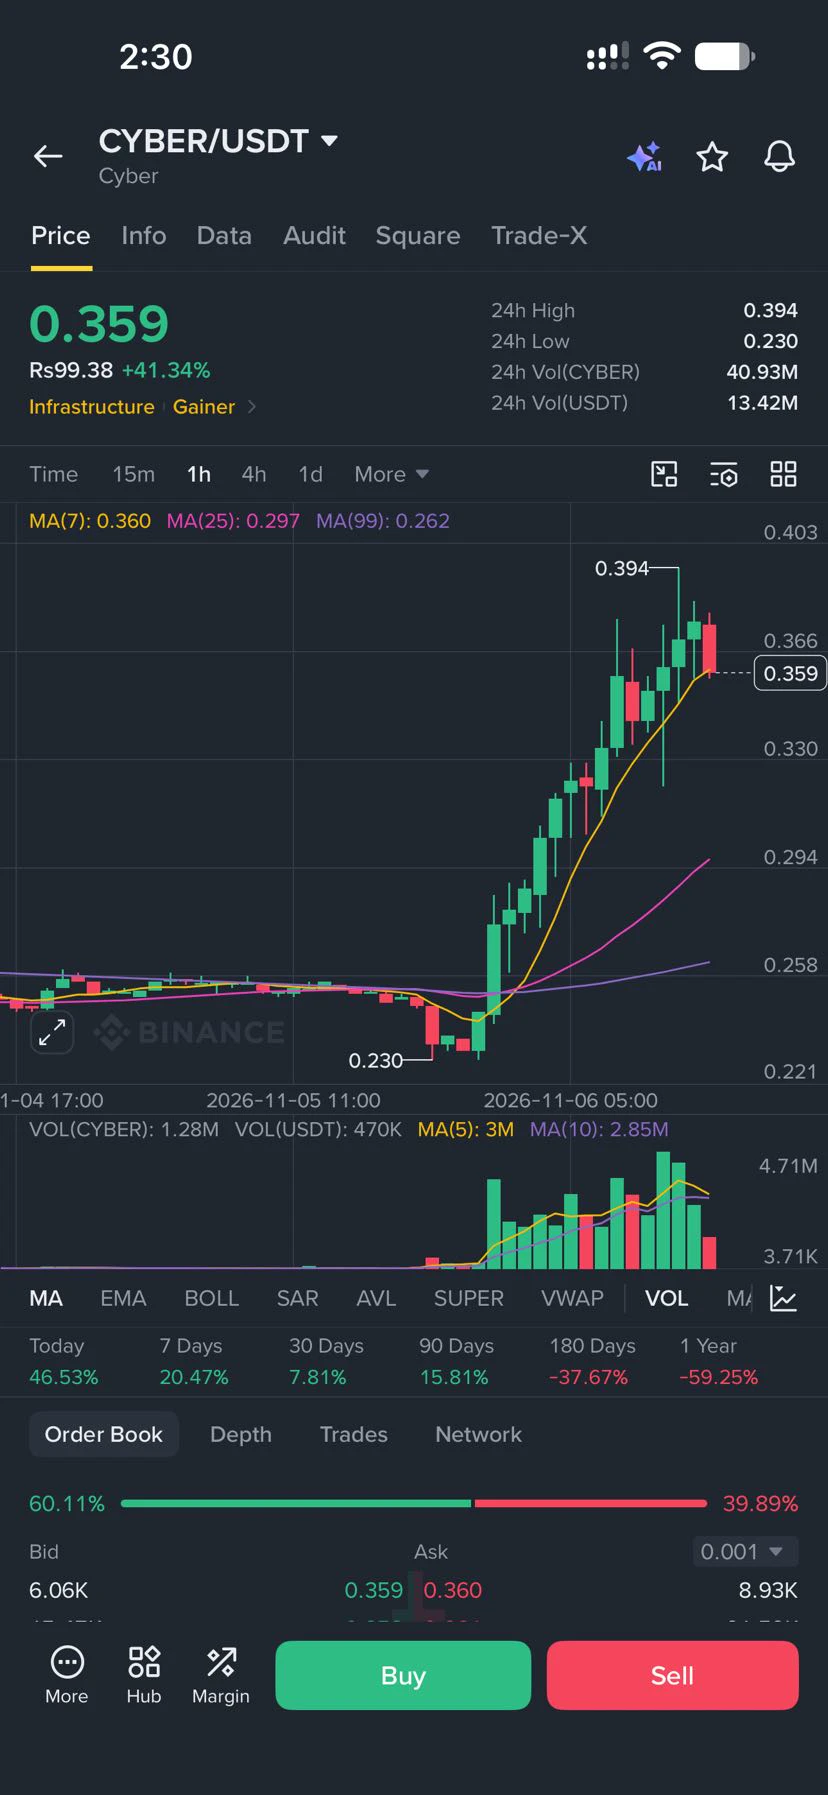
$CYBER 1h

Low was 0.230, tagged 0.394, now 0.359, sitting on the 7.

MAs: 0.360 right at price, 0.297 and 0.262 underneath.

Volume exploded on the push. Range today 0.230–0.394.

Watching 0.360 as the line. Lose it clean and the 25 is next. Hold it and 0.394 stays the reference.

Just the chart. Not a call.

#USStocksFaceHistoricSelloff #GateLaunchesPoSECProofOfSecurity #USNonfarmPayrolls
post-image
CYBER-5.40%
  • 3
  • 1
#ETHDrops5.5%
ETH Drops 5.5% And More: Ethereum Falls Toward $2,200 As Tech Selloff Spills Into Crypto

Ethereum is under pressure today and the numbers are verified.

Ethereum current price 2226.07, down -8.10 percent, open 2422.41, high 2427.10, low 2206.28. Ethereum fell 6.93 percent as near-term selling pressure intensified. Ethereum fell almost 8 percent toward $2,200. ETH trades at $2,242.97, down 7.37 percent over 24 hours. Ethereum tumbled 7.80 percent to $2,233.79. Ethereum is trading at $2,232.49, down 7.96 percent. Ether -6.61 percent. Ethereum price today $2,230 drops 7 percent
ETH-1.26%
  • 12
  • 2
# Why Might a Once-Effective Strategy Gradually Stop Working?

If a trading strategy has delivered profits consistently, why might it start losing frequently a few months later, or even after a longer period?

Has the market changed, or is there a problem with the strategy itself?

This question is especially worth considering in digital asset markets. Market participants, liquidity, volatility structures, and trading behavior can all change. Opportunities that could be captured in the past may not last forever.

**A strategy’s past effectiveness only shows that it performed well under specifi
post-image
Load More

Join 40 M users in our growing community

⚡️ Join 40 M users in the crypto craze discussion

💬 Engage with your favorite top creators

👍 See what interests you

Trending Topics

USStocksFaceHistoricSelloff

4.79k Views3.64k Discussing

U.S. stocks suffered a sharp selloff on Thursday, with the Nasdaq closing down more than 5% and the Philadelphia Semiconductor Index falling over 12%. AI and chip stocks including $NVDA and $AMD were hit especially hard. Markets are reassessing AI valuations, data-center spending and future returns. Is this just short-term deleveraging, or the start of a deeper correction in the AI trade? Which sectors are you watching next?

GateLaunchesPoSECProofOfSecurity

14.95k Views591 Discussing

USNonfarmPayrolls

13.18k Views4.05k Discussing

View More