Square
Following
Hot
News
Notifications
Profile
Share your thoughts
placeholder
Article
$HYPE ‌
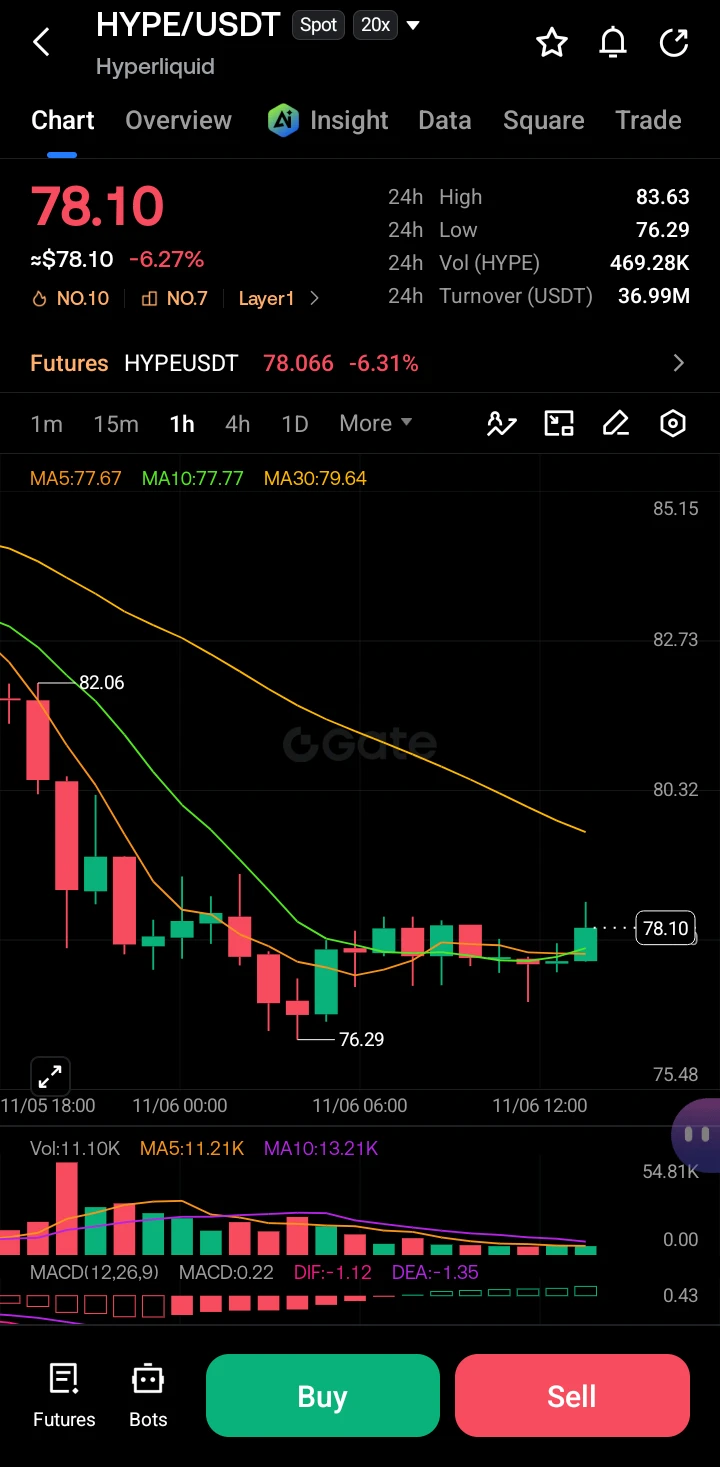
HYPE is currently experiencing a short-term corrective downtrend, trading at $78.10 (-6.27%) after a sharp drop from the $82+ region. The price has found temporary support near $76.29 and is attempting to stabilize, but broader momentum remains bearish.

Key Levels

· Resistance: $79.64 (MA30) and $80.32 (previous breakdown zone).
· Support: $76.29 (local low) and $75.48 (lower structural support).

The 1H chart shows a massive initial sell-off, followed by a period of consolidation. Candles are currently printing smaller bodies with wicks on both sides, indicating indecision. The MAC
post-image
HYPE+0.24%
  • 5
🔥 Crypto and stock market volatility intensifies | Try grid trading at zero cost, exclusive benefits for new users
💰 Sign up to receive 10 USDT in bot trial funds, and trade for a chance to win prizes
🎯 The more you invest, the more prize draw entries you get:
✅ ≥150 USDT: +1 entry
✅ ≥5,000 USDT: +3 entries
✅ ≥50,000 USDT: +10 entries
🔥 Use Gate Futures Grid to trade $ETH and seize opportunities from volatility in popular assets
👇https://gate.onelink.me/7pdk/c5577810cff05c9b
post-image
ETH-1.23%
  • 6
Trenches
BTC
B
bade
b
BTC
C5xp...pump
Market Cap
$.
Change
.
24h Vol
$.
Holders
.
ZIG
Z
bade
b
ZIG
0x8c...1145
Market Cap
$.
Change
.
24h Vol
$.
Holders
.
GM
G
bade
b
GM
0x13...7777
Market Cap
$.
Change
.
24h Vol
$.
Holders
.
STONK
S
bade
b
STONK
6GmA...UNgx
Market Cap
$
Change
.
24h Vol
$.
Holders
.
DESSA
D
bade
b
DESSA
npz2...pump
Market Cap
$.
Change
.
24h Vol
$.
Holders
.
Why Can a Strategy With a High Win Rate Still Lose Money in the End?

In cryptocurrency trading, many people pay special attention to win rates. Winning eight out of ten consecutive trades may seem quite impressive. But if the account still ends up in the red, the problem may not be the win rate, but how much is made or lost on each trade.

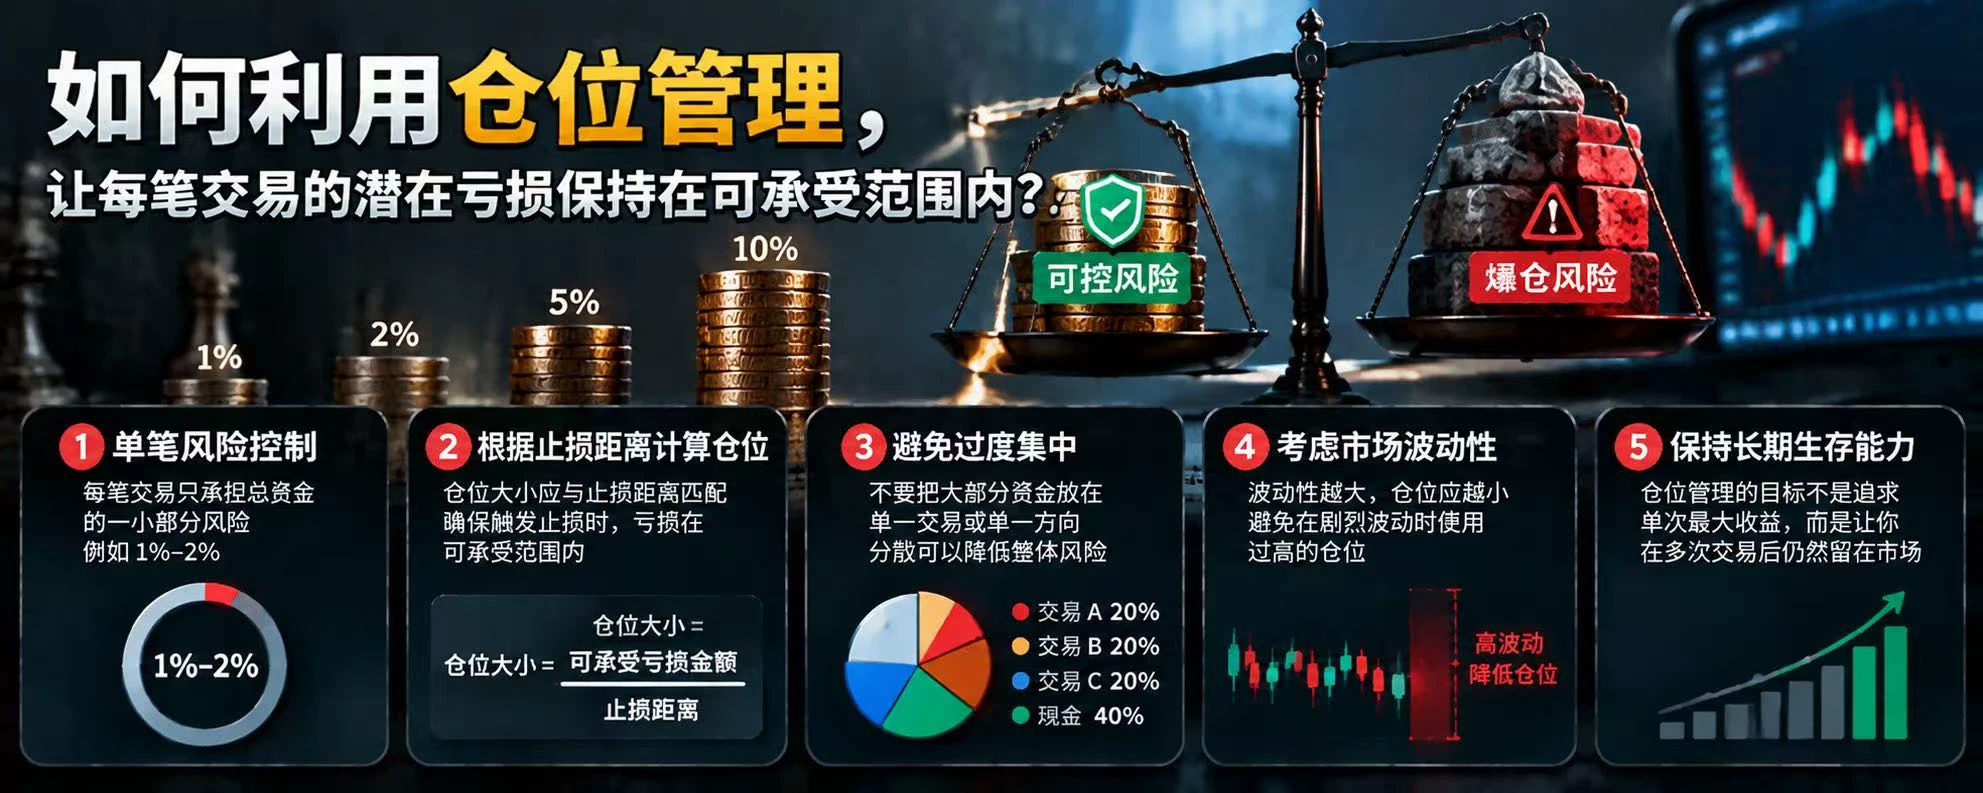
Suppose a trader makes 10 trades, 8 of which are profitable, earning 10 USDT each; the other 2 are losing trades, each losing 50 USDT.

The 8 winning trades bring in 80 USDT, while the 2 losing trades result in a loss of 100 USDT. Without taking fees and fu
post-image
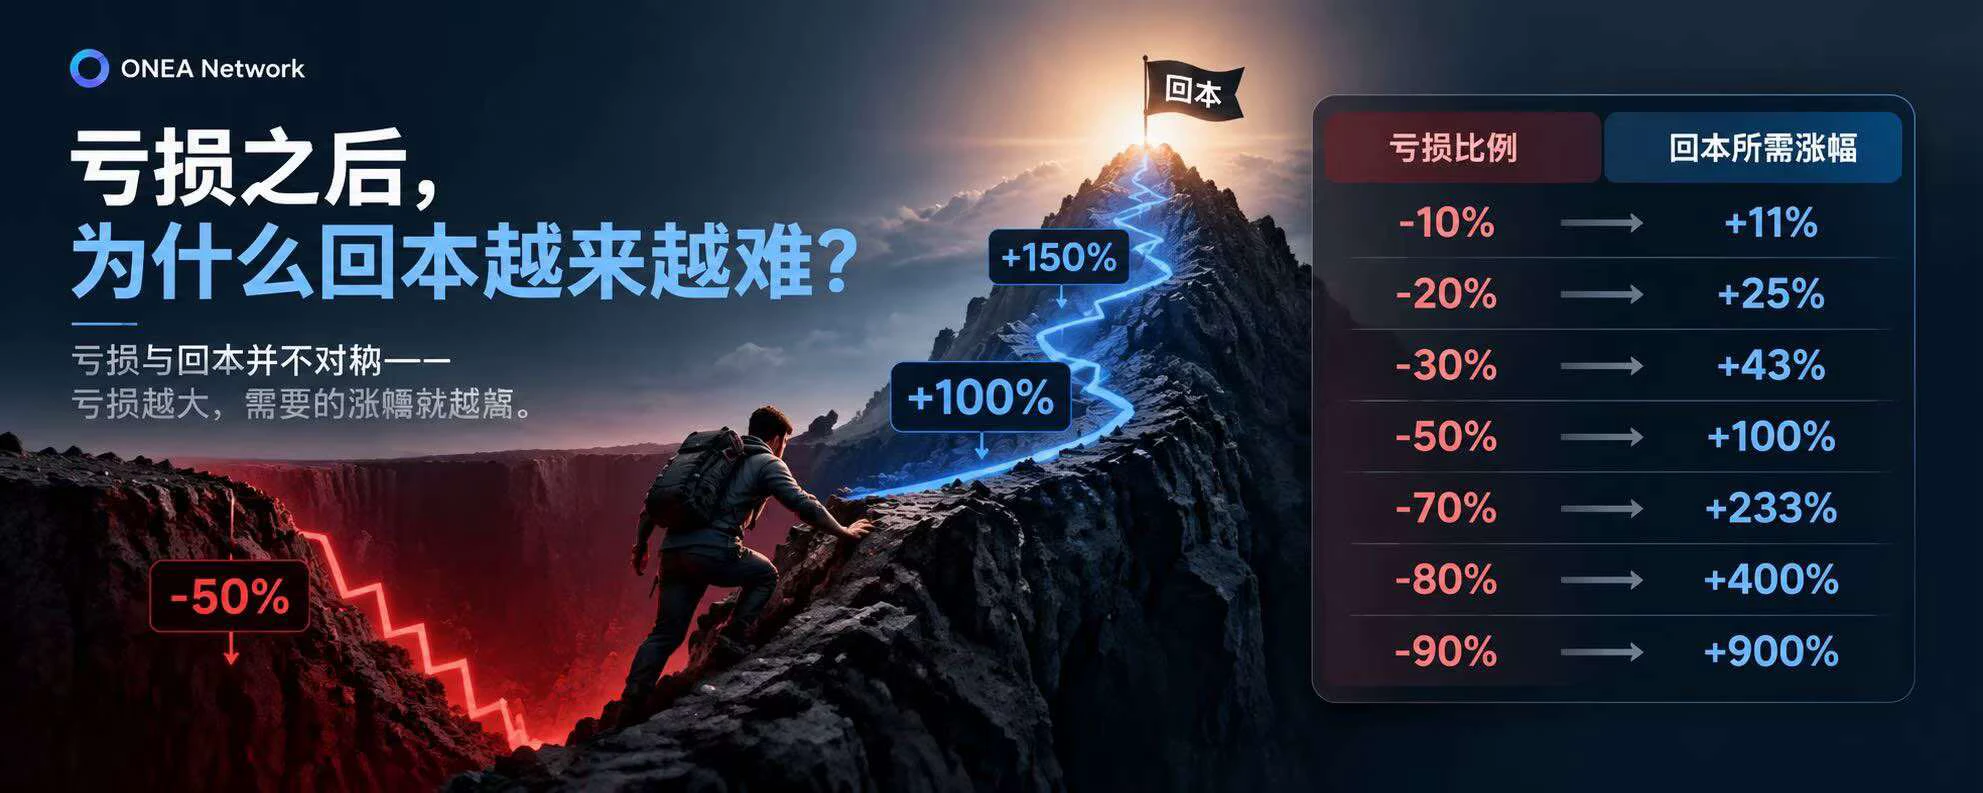
After a Loss, Why Does It Become Increasingly Difficult to Break Even?

There is a mathematical fact in trading that is easy to overlook:

Losses and breaking even are not symmetrical.

Many people think that as long as the market rises again, they have a chance to earn back the money they previously lost. But the problem is that once your account balance has shrunk, the return you need is no longer the same as it was at the outset.

Suppose you initially have $10,000.

If you lose 10%, your account is left with $9,000. At this point, you need a gain of about 11.1% to get back to $10,000.

If
post-image
🔹U.S. Stocks Plunge After the Midterm Elections, Led by AI Stocks, Dragging BTC Down Too! When Will
live-cover
LIVE2,238
#BTC
11.6 Bitcoin analysis
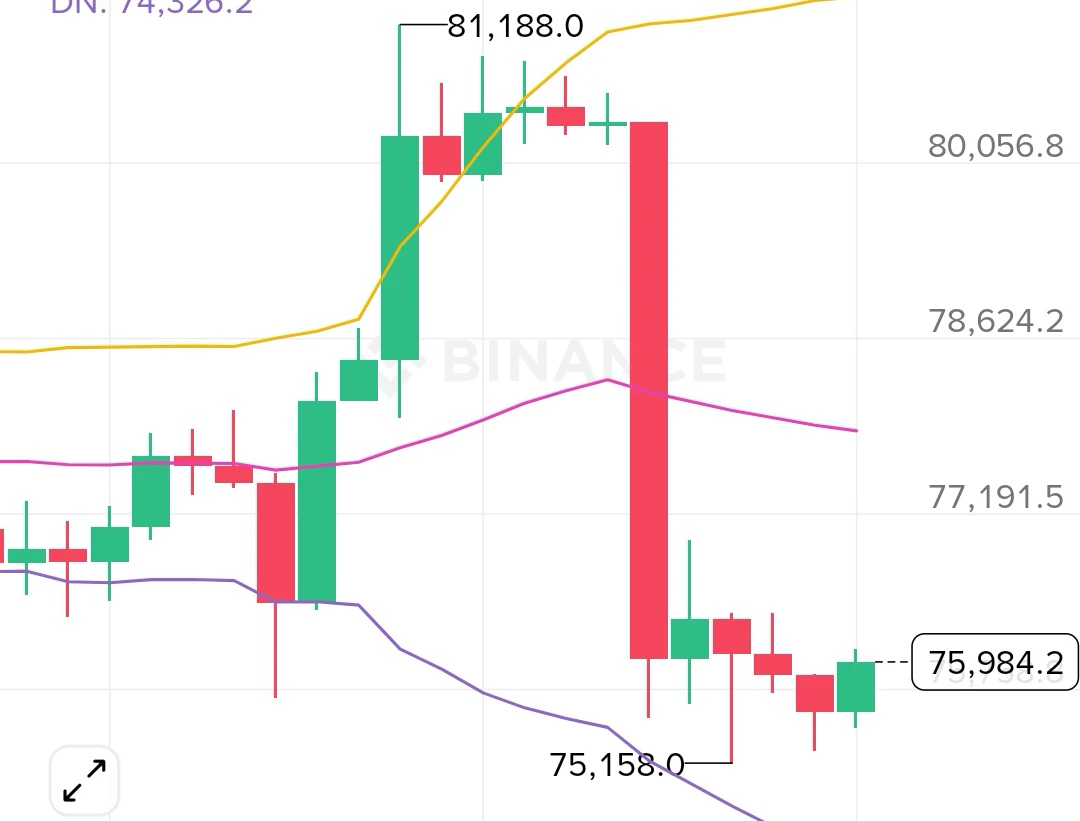
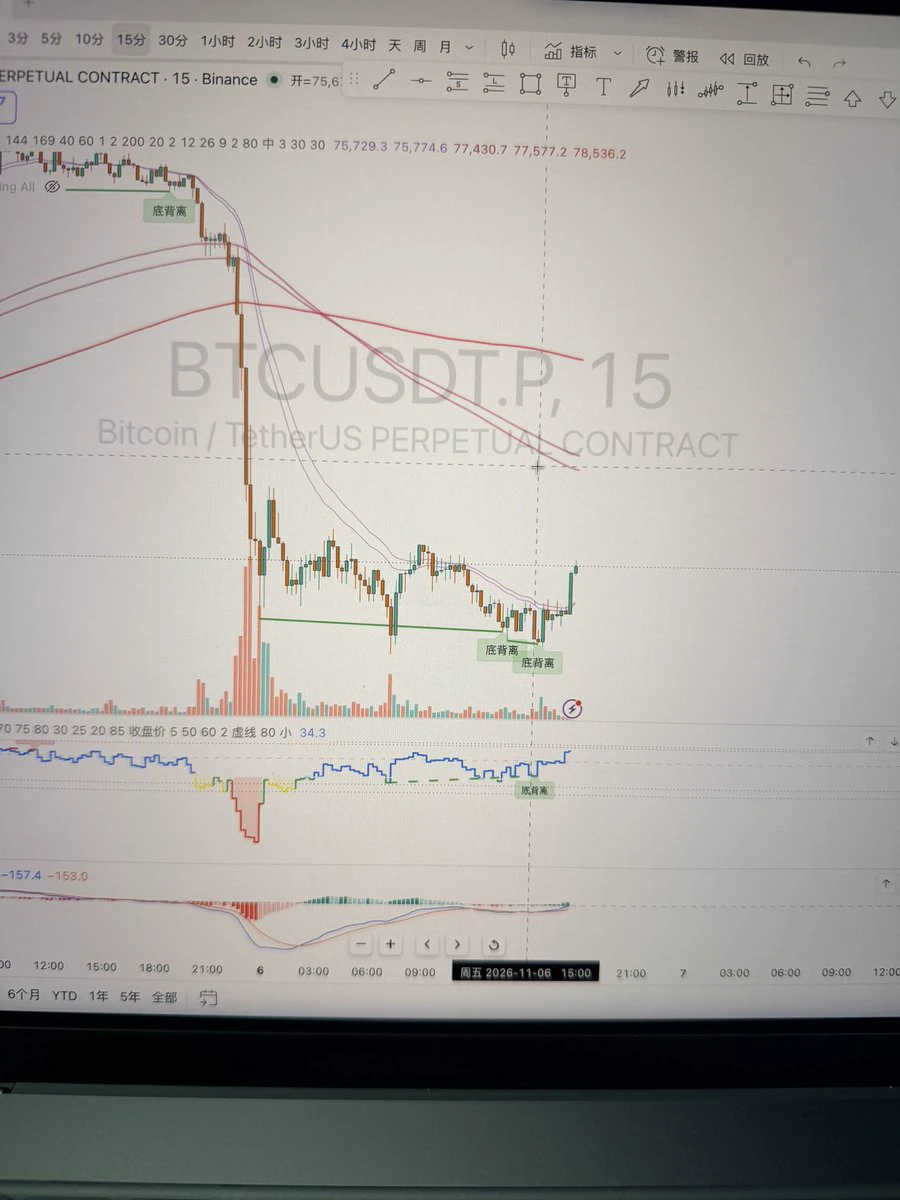
On the 4-hour chart, selling pressure has pushed price below the Bollinger middle band, with bears in control. KDJ indicates oversold conditions, so those looking to trade short-term can try to catch a small rebound. The first resistance above is 77800, with support below at 75158. If price fails to reclaim the middle band, the bias remains bearish, with further downside likely.
Trading suggestion:
Short in the 76500-7700 range, targeting further downside; stop-loss at 77800
post-image
BTC-0.67%
How can we tell when market conditions have changed? Which signals are worth watching, and which are just short-term noise?

In the previous article, we discussed a question: Why might a trading strategy that once worked gradually lose its edge?

One important reason is that market conditions have changed.

But the real challenge is this: Markets fluctuate every day, so how do we know whether this is normal volatility or a genuine change in market conditions?

If we react too slowly, we may keep using a strategy that no longer suits current market conditions.

If we react too quickly, we may c
post-image
Is this the K-line guru, the guy involved in the incident where a female KOL came over to suck his dick?
Seeing her like this reminds me of a saying: A man should know what to do—and what not to do...
This dude was really hungry
11.6 Evening Market Brief

Evening market analysis/Weak oversold recovery ahead of the nonfarm payrolls report; bearish structure remains unchanged, waiting for the data to set the direction

The nonfarm payrolls report is in its final countdown, and after a series of sharp declines, the market has entered an oversold technical recovery phase

BTC and ETH have both rebounded slightly from their lows, but the overall bearish structure remains intact. Rebound volume is clearly insufficient and momentum is limited. The market will likely remain weak and range-bound until the data is released

BTC
BTC-0.65%
ETH-1.23%
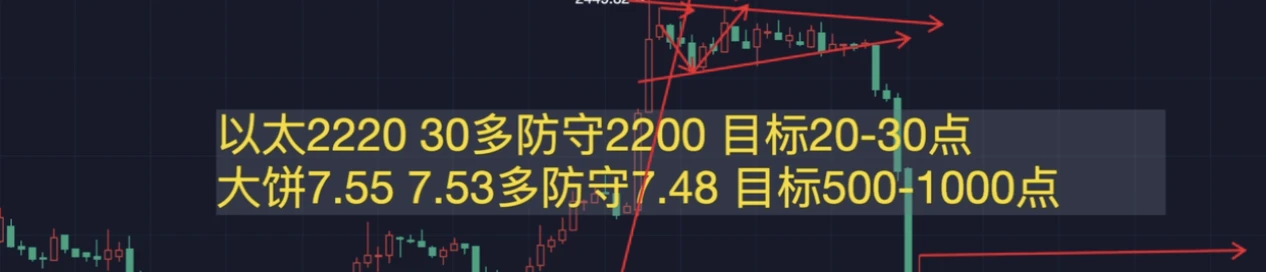
BTC at 7.55, got long above 53
post-image
  • 14
Looking at price, first SanDisk: #闪迪 #美股史诗级抛售

Core judgment: the reasonable range is around 1200–1450 (centered at ~1350); 806 is a panic discount.

But focus on 4 indicators
1. Forward P/E: Based on yesterday’s share price, 806 ≈ 3.5–5× → extremely low; however, low multiples in memory stocks often signal a cycle-peak warning. For example, Micron’s P/E is actually highest at the bottom.
This needs to be considered alongside the points below.

2. Enterprise NAND/SSD contract prices + company guidance: still rising = supports the range; turning down/cuts to guidance = range shifts down to 750
SNDK-22.24%
Sun looks way more handsome now, doesn’t he? The photographer deserves an extra chicken leg.
# Why Might a Once-Effective Strategy Gradually Stop Working?

If a trading strategy has delivered profits consistently, why might it start losing frequently a few months later, or even after a longer period?

Has the market changed, or is there a problem with the strategy itself?

This question is especially worth considering in digital asset markets. Market participants, liquidity, volatility structures, and trading behavior can all change. Opportunities that could be captured in the past may not last forever.

**A strategy’s past effectiveness only shows that it performed well under specifi
post-image
If you could burn 10% of Pi supply to make price 10x, would you burn if its you too?
#PiNetwork
#ShareWeekly
#GateSquare
#WCTCS9
post-image
PI-0.60%
[New Streamer] Market Prediction
live-cover
LIVE1,691
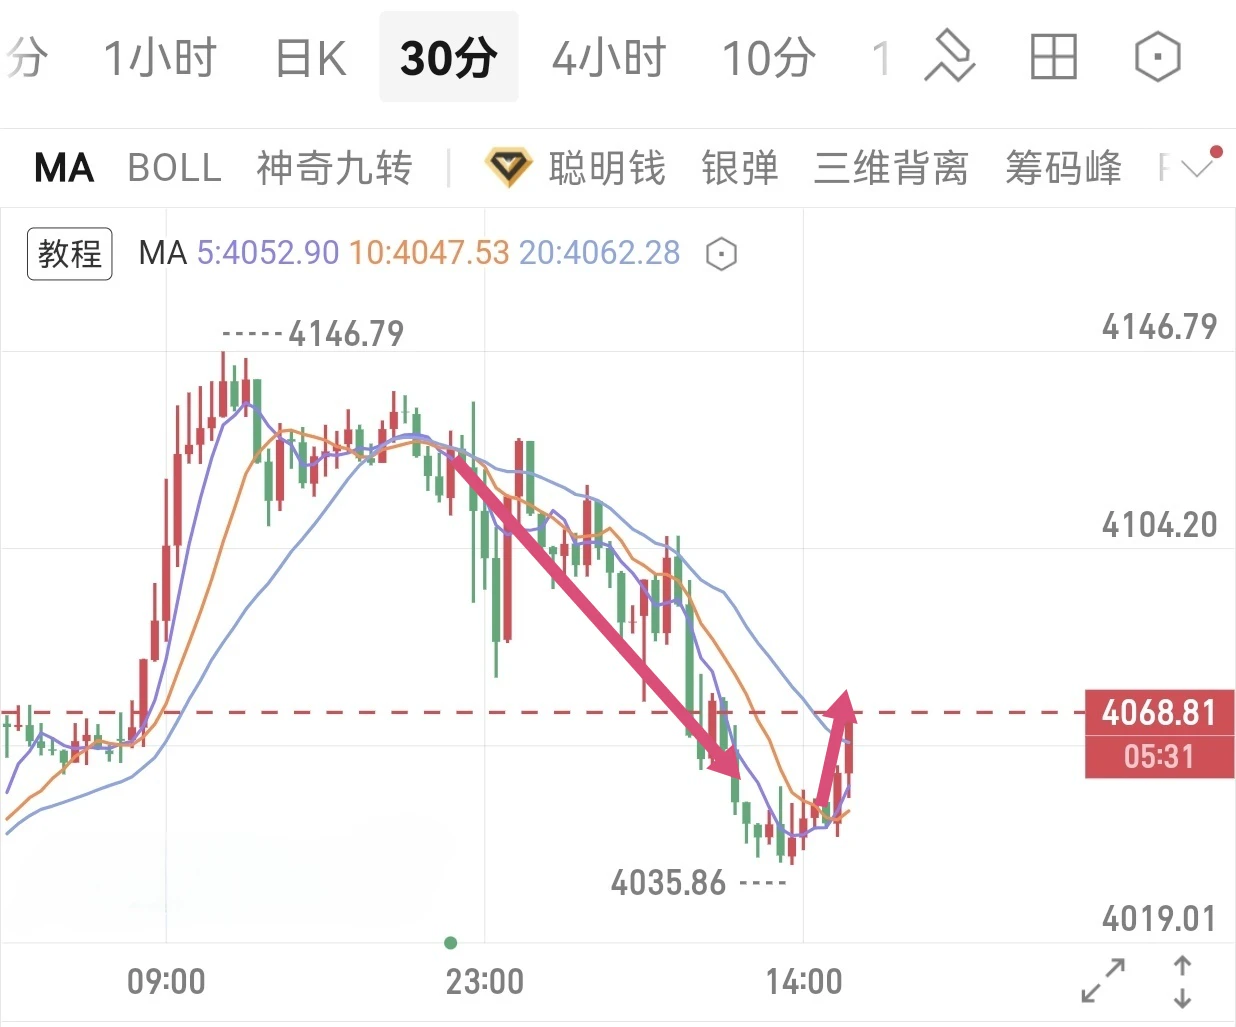
After pulling back, gold prices surged, breaking through resistance and continuing to push higher at elevated levels! $XAU #ETH跌5.5% #黄金 ‌
post-image
XAU+0.38%
  • 1
📊 BTC Market Update

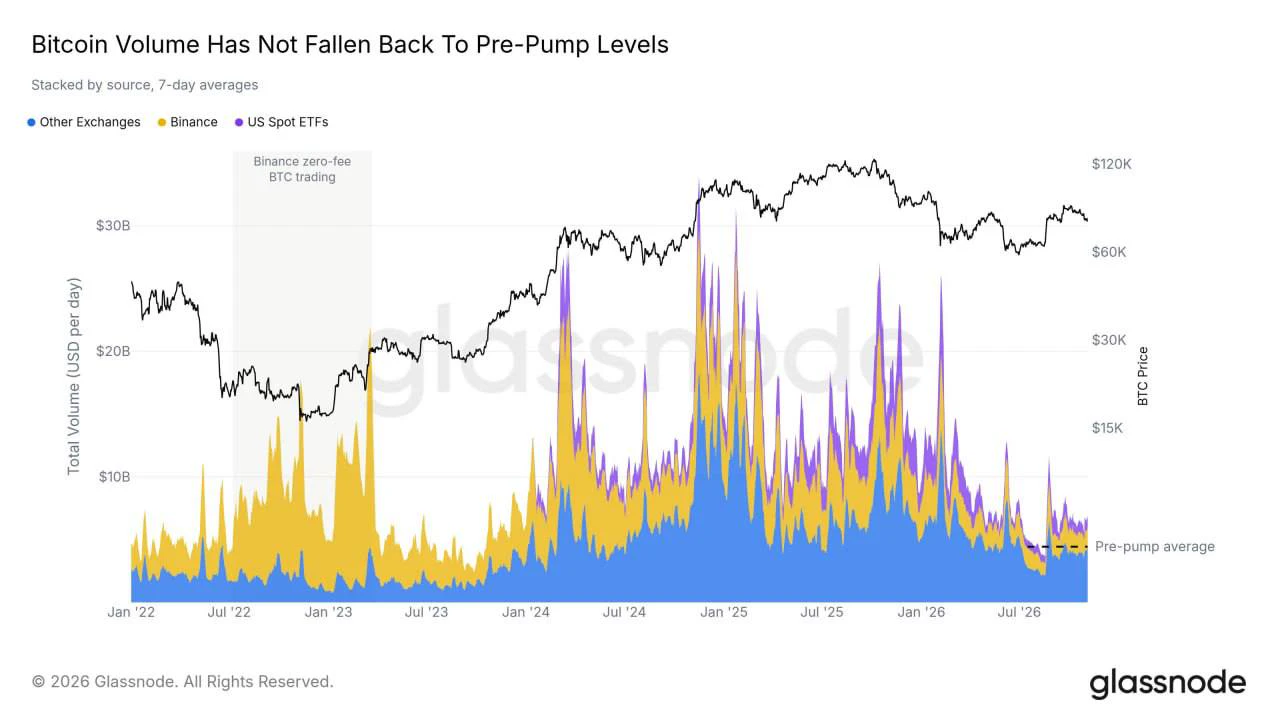
Traders are still active despite Bitcoin’s recent pullback.

Before the August rally, trading volume had dropped to its lowest level since 2023. However, even after the recent retracement, volume remains above that level.

👉 This suggests sustained market interest and improving participation after months of low activity.
$BTC ‌#USStocksFaceHistoricSelloff #GateLaunchesPoSECProofOfSecurity #USNonfarmPayrolls #GateGuardNowAvailableForFree #ShareWeekly
post-image
BTC-0.67%
Bitcoin is done for—is it about to head to 77K?
post-image
BTC-0.67%
  • 1
Why isn’t the execution price shown by an exchange necessarily the price you ultimately get?

In crypto trading, you may see Bitcoin’s price fluctuating around a certain level. After clicking Buy, however, you may find that the average execution price was higher than expected. The same goes for selling: the price displayed on screen may look good, but the amount you ultimately receive may be less than you imagined.

This doesn’t necessarily mean something is wrong with the exchange. The latest traded price, buy and sell quotes, and your actual execution price can differ.

First, the latest tra
post-image
BTC-0.67%
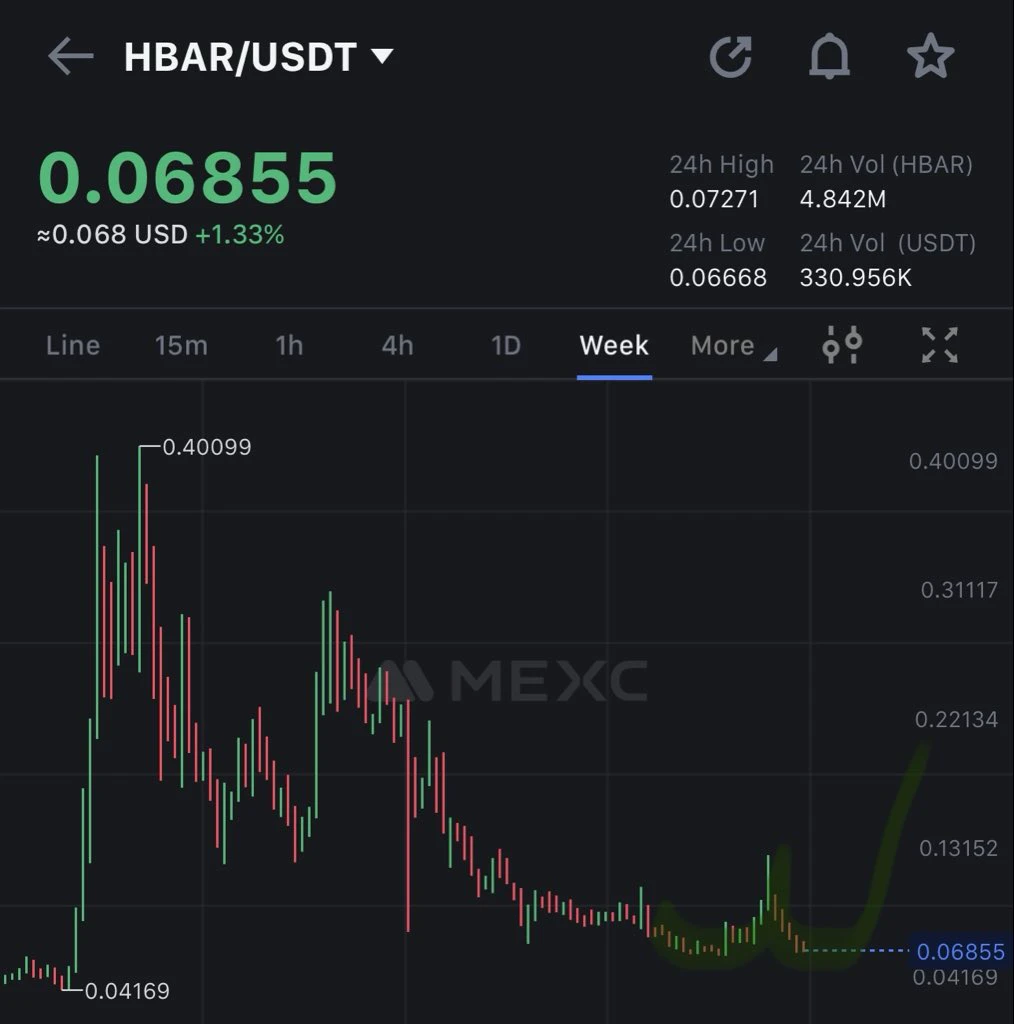
$HBAR might 2x-3x in the next 3-4 weeks.
post-image
HBAR-1.36%
Load More

Join 40 M users in our growing community

⚡️ Join 40 M users in the crypto craze discussion

💬 Engage with your favorite top creators

👍 See what interests you

Trending Topics

USStocksFaceHistoricSelloff

4.79k Views3.65k Discussing

U.S. stocks suffered a sharp selloff on Thursday, with the Nasdaq closing down more than 5% and the Philadelphia Semiconductor Index falling over 12%. AI and chip stocks including $NVDA and $AMD were hit especially hard. Markets are reassessing AI valuations, data-center spending and future returns. Is this just short-term deleveraging, or the start of a deeper correction in the AI trade? Which sectors are you watching next?

GateLaunchesPoSECProofOfSecurity

14.95k Views594 Discussing

USNonfarmPayrolls

13.18k Views4.05k Discussing
View More