Share your thoughts
placeholder
Article
How Much Further Can ZEC Go After Surging Past $1,200? The Real Test Has Just Begun
ZEC breaking through $1,200 means the market has officially entered a new price discovery phase.
Previously, $900 and $1,000 were important psychological levels, but these positions have now been broken through consecutively. The latest market data shows that ZEC recently came close to $1,250 at its peak, gaining more than 40% over the past week—a remarkably rapid rise.
So the question is: where is the next stop?
After breaking through its all-time high, traditional resistance levels become less meaningful, and
ZEC-7.11%
  • 48
$MU /USDT is about to expose the biggest range trap of the week.

$MU /USDT - SHORT

Trade Plan:
Entry: 1035.35 – 1037.39
SL: 1046.17
TP1: 1029.02
TP2: 1024.12
TP3: 1016.77

Why this setup?
Why now? The daily trend is a range, but the 1h price is sitting at 1036.37, right inside the entry zone where the 15m RSI has dropped to 35.35, signaling bearish exhaustion is setting in. The 1h ATR of 4.083077 confirms enough volatility to push the price from the entry_ref toward TP1 at 1029.02 and then TP2 at 1024.12. The invalidation level at 995.15 is the hard line that separates a clean short from
MU+1.51%
The truly attractive part of 3% APY is not the yield, but “earning yield without giving up trading”
One of the most awkward things in the crypto market is having funds on hand but not knowing when to act.
Buy in and you fear a drop; stay out and you fear a rally. In the end, your USDT lies in your account while you watch the candlesticks jump up and down every day.
The core logic of Gate’s Idle Funds Treasure is to improve the utilization of these idle funds. Once enabled, eligible stablecoins can automatically participate in yield generation. The funds do not need to be locked and can still b
  • 50
Smart money is quietly building a short position on WLD while retail chases the range top.

$WLD /USDT - SHORT

Trade Plan:
Entry: 0.471 – 0.477
SL: 0.511
TP1: 0.446
TP2: 0.428
TP3: 0.401

Why this setup?
Why now? The 4h setup shows a range-bound daily trend with the 1h price resting at 0.474, right inside the entry zone of 0.471 to 0.477. The 15m RSI at 63.5 signals room for a pullback before reversal, and the 1h ATR of 0.011762 confirms enough volatility to push WLD toward the first target of 0.446 and the deeper objective at 0.428. The invalidation level at 0.407 is the hard line that wo
WLD+14.00%
I was just about to go to the forum and start cursing, but then I looked at my positions and thought, forget it—the market is always right.

The intraday plunge was indeed pretty scary, but watching $ETH 's volume, I noticed that the volume kept shrinking as the price fell, while buy orders below were getting increasingly thicker. It was obvious that someone was using the panic to accumulate. Once I felt confident, I directly placed a long order at 2111.16.

The market did not disappoint. The current price climbed all the way to 2483.97, sending my position's profit straight to +3071.05%. It
post-image
ETH-0.93%
BNB-1.63%
BTC-1.53%
September 8 Jinman Gold Morning Review:
Spot gold on the 4-hour chart is showing a consolidation pattern after a sharp decline. The price fell sharply from the previous high of 4631.18, found a temporary low at 4282.53, and then saw buying-driven recovery. After rebounding to a relatively high level, it fell again due to insufficient upward momentum. It is currently trading near 4413.43, with the tug-of-war between bulls and bears intensifying, and the market is at a critical juncture for choosing a direction.
On the fundamental front, today’s focus will be on U.S. economic data and remarks fr
post-image
BTC-1.53%
ETH-0.95%
$NACHO Sigh, I couldn't sleep all night.
post-image
NACHO+84.03%
Everyone is about to get burned on $LAB /USDT.

$LAB /USDT - SHORT

Trade Plan:
Entry: 0.0697 – 0.0701
SL: 0.0716
TP1: 0.0686
TP2: 0.0677
TP3: 0.0664

Why this setup?
Why now? The 1d trend is bearish and the 4h setup is confirming it with 95% confidence, so the deck is stacked for more downside. The 1h price is sitting at 0.0699, right inside the entry zone of 0.0697 to 0.0701, giving us a clean trigger. The 15m RSI at 50.9 shows the market is neutralizing, not recovering, which means the short can hold. Meanwhile the 1h ATR of 0.000729 tells us the next leg should move the price from the e
LAB-2.73%
I originally wanted to cut my losses as a sacrifice to the heavens, but the ceremony never happened—the meat cooked itself. When the market plunged, I stared at the chart for a moment, then laughed. The bears had finally started moving to the rhythm they were supposed to, without disappointing anyone.

I had been watching this level for several days. Every rebound toward the upside was always just short of enough, and each rally was immediately knocked back to its original position. I placed a short order around 4474.29 as planned, without hesitating for too long, because opportunities often
post-image
LAB-2.73%
ETH-0.93%
I didn’t do anything—just went to the restroom, and when I came back, the K-line had already done the work for me🚀. During the repeated intraday swings, I kept my eye on $BTW . It held firm after pulling back to around 0.377246, with clear buying support—not one of those fake key levels where a single wick plunges down and disappears. At the time, I judged that there was little room left to fall and alerted everyone to the dip-buying level.

Now at 0.447934, +186.33%, this profit feels great. Panic comes from having no plan; losses come from overthinking. During the earlier narrow-range shake
post-image
BTW+0.74%
LAB-2.73%
SOL-2.49%
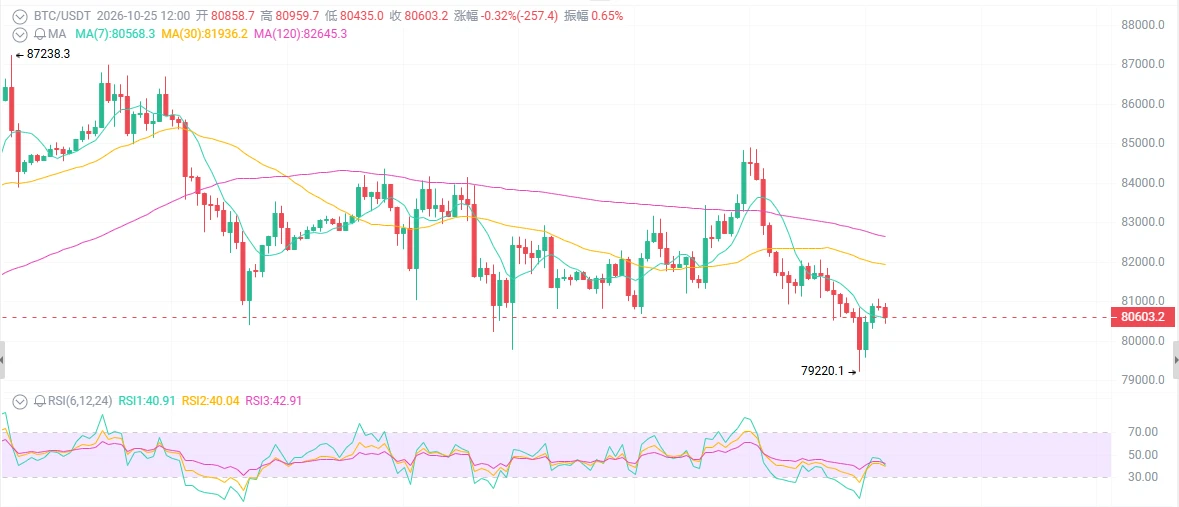
Last night, Bitcoin surged to around 79,600 before facing strong bearish pressure and quickly retreating to around the midnight low of 78,600. It then consolidated within the 79,400–78,800 range and is currently trading around 79,200. Overall, the market is showing a pattern of being blocked after a rally, stabilizing after a pullback, and then moving sideways weakly.
The long upper wick on the daily chart highlights heavy selling pressure above 79,600, signaling a clear short-term top. On the hourly chart, rebounds have repeatedly been capped by the 79,400–79,500 resistance zone, while the bu
BTC-1.53%
Everyone is missing that WLD is trapped in a range while the smart money sets up a SHORT at 0.4744.

$WLD /USDT - SHORT

Trade Plan:
Entry: 0.4715 – 0.4773
SL: 0.5107
TP1: 0.4471
TP2: 0.4290
TP3: 0.4017

Why this setup?
Why now? The 1h ATR of 0.01165 shows volatility is compressed enough for a sharp move, and the 15m RSI at 67.5 is still climbing, meaning momentum has not yet faded and could push into the entry zone. The daily range pattern keeps price contained until a breakout, and with the 1h price at 0.4744, the SHORT bias can flip the trade quickly. TP1 sits at 0.4471 as the first meas
WLD+14.00%
This isn’t a rebound; it’s a feeding tube stuck into an account that was about to flatline. 🔥

When $2Z plunged intraday, it was battered several times around 0.04895 without breaking support, but the downside pressure weakened each time. I recognized it as a washout, not distribution, so I stopped talking and went long directly.

The price has now recovered to 0.05027, with returns at +110.26%—that was a satisfying bite😋. Position management: take 80% off the table first, move the remaining 20% to the entry price for protection, and let the rest of the position make a push.

Those who k
post-image
2Z-2.65%
DOGE-0.21%
ADA-1.12%
Layout for Bitcoin, Ethereum, and Dogecoin
live-cover
LIVE1,435
Insiders are quietly shorting PEPE right now while the crowd chases pumps.

$PEPE /USDT - SHORT

Trade Plan:
Entry: 0 – 0
SL: 0
TP1: 0
TP2: 0
TP3: 0

Why this setup?
Why now? The 1d trend is range, meaning price lacks directional conviction and favors mean reversion. The 15m RSI sits at 53.22, a neutral zone that suggests momentum is not yet committed to buyers. The 1h ATR is 0, indicating volatility has collapsed and a sharp move is overdue. The entry zone aligns with the range-bound structure, giving a defined level to initiate a short with the invalidation level acting as the hard line i
PEPE-0.68%
Yesterday morning, the price surged first. After breaking the parallel high and coming under downward pressure, it tested the previous hourly Bollinger lower band at 806 but failed, then fell back under pressure. During this period, the long trade gained 350 points, while the two short trades gained 450 and 600 points, respectively. The long position entered in the afternoon was trapped, but as mentioned in the morning, there was no one-sided move, and with no U.S. stock market open, the support at 786 would not break. The long position was decisively increased, and after returning to 793 at d
post-image
ETH-0.95%
BTC-1.53%
btc overview
live-cover
LIVE681
$GBPUSD
Daily x H4
Could be a good meal.
GBPUSD+0.55%
Do you stand with Israel or the UK after the UK has announced sanctions due to Jewish settler terrorism ?
post-image
Giveaway 5 GTD spots @Arc_Punks
First punks nft on arc
requirement
> follow them
> drop Evm wallet
Ending in 12 hours
post-image
ARC+4.93%
Load More

Join 40 M users in our growing community

⚡️ Join 40 M users in the crypto craze discussion

💬 Engage with your favorite top creators

👍 See what interests you

View More