Square
Following
Hot
News
Notifications
Profile
Share your thoughts
placeholder
Article
Following the release of the non-farm payrols data , the probillithy of a fed .....
live-cover
LIVE1,156
market updates
live-cover
LIVE1,177
Trenches
ZIG
Z
bade
b
ZIG
0x8c...1145
Market Cap
$.
Change
.
24h Vol
$.
Holders
.
BTC
B
bade
b
BTC
C5xp...pump
Market Cap
$.
Change
.
24h Vol
$.
Holders
.
GM
G
bade
b
GM
0x13...7777
Market Cap
$.
Change
.
24h Vol
$.
Holders
.
Diamond
D
bade
b
Diamond
5VCE...pump
Market Cap
$.
Change
.
24h Vol
$.
Holders
.
DOGE
D
bade
b
DOGE
DoGE...fm7R
Market Cap
$.
Change
.
24h Vol
$.
Holders
.
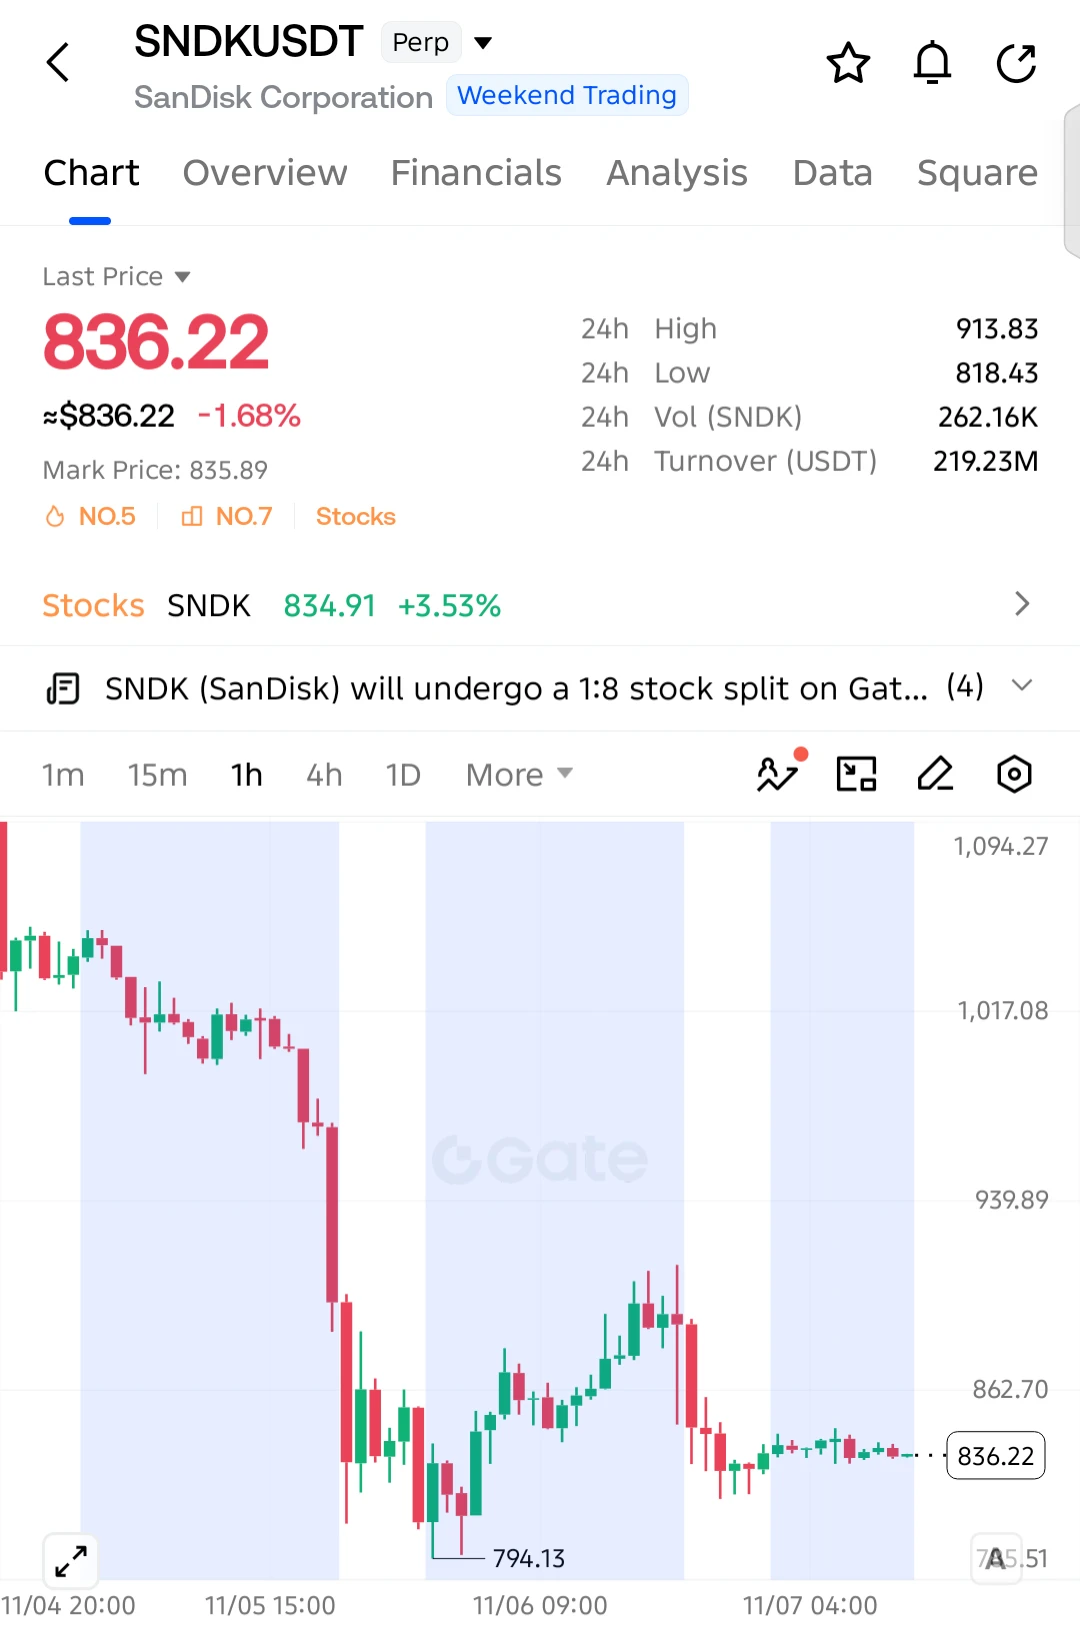
$SNDK SHORT SETUP — BEARS EYE ANOTHER BREAKDOWN!

$SNDK remains under bearish pressure after a massive sell-off. Price is consolidating near 836, and sellers could be preparing for another downside move!

Entry: 836.22
SL: 851.00

TP1: 825.00
TP2: 818.43
TP3: 805.00
Final Target: 794.13

The chart shows a clear bearish structure, with lower highs and failed recovery attempts. Buyers are struggling to regain control, while the 845–850 resistance zone remains a major obstacle. A breakdown below 818.43 could trigger another decline toward 794.13.

Invalidation: A sustained recovery above 851.00 w
post-image
SNDK-0.18%
When a strategy starts losing money, the most dangerous thing to do is not to stop immediately or stubbornly keep going, but to repeatedly change parameters without evidence.

Many traders go through this process:

The strategy performs well in backtests and has even generated consistent profits in live trading. But after some time, losses start to mount.

At this point, three reactions are common:

First: Assume it’s just bad luck and keep executing the strategy.

Second: Keep adjusting parameters, hoping to restore the profit curve.

Third: Start doubting the entire strategy, or even abandon
post-image
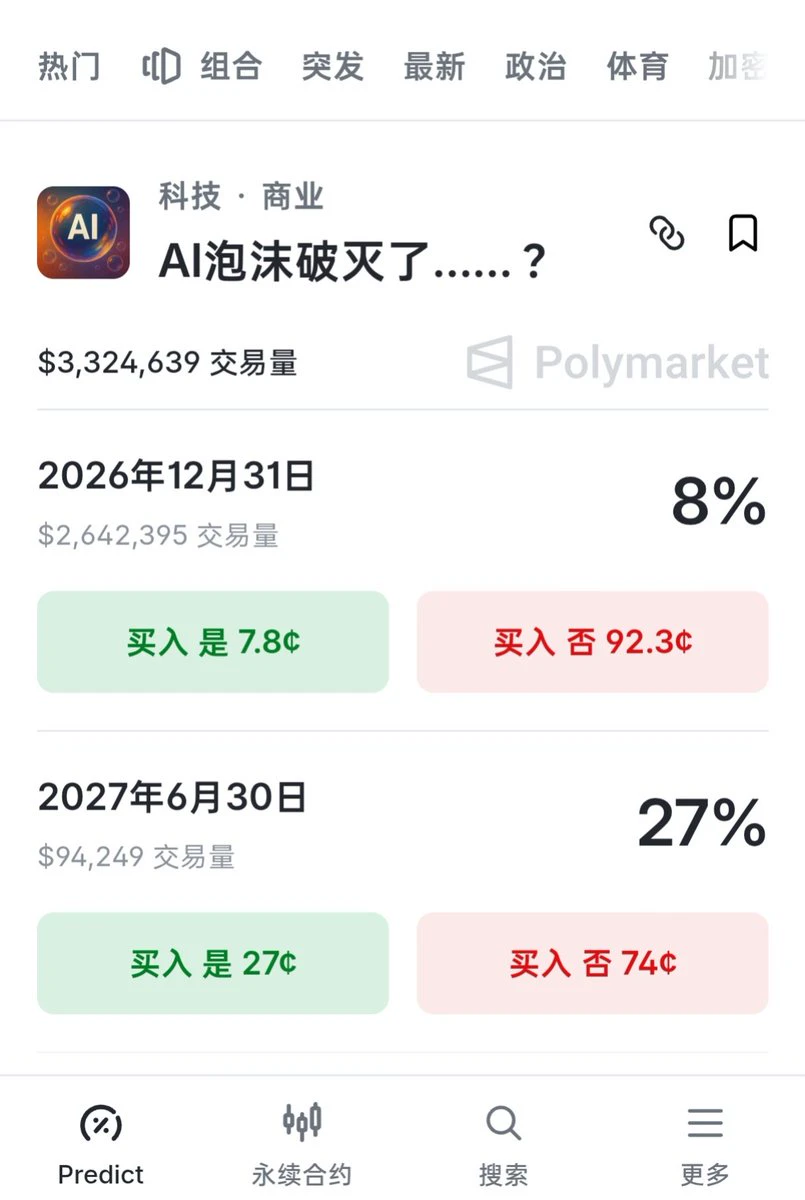
On the Polymarket prediction market platform
Most people think AI won’t reach the “bubble burst” stage at least until mid-next year.
Therefore, based on current market consensus, expectations for AI remain generally optimistic.
Even after the impact of Thursday’s black swan event, the related probabilities haven’t risen much.
post-image
#StakeOnLaunchpoolToShare450KVLX

Gate is bringing another exciting opportunity to the crypto community with its Launchpool campaign, where users can stake supported assets and participate in sharing a reward pool of 450,000 VLX tokens. This campaign gives users another reason to explore the Gate ecosystem and discover new earning opportunities.

Launchpool is an interesting feature for crypto users because it allows participants to stake eligible assets and receive rewards according to the campaign rules. Instead of simply watching the market, users can explo
VLX+0.00%
Research shows that you shouldn't short Ethereum before 9 p.m. Monday. Try to wait until about an hour before the US stock market opens to start shorting; one wrong move and you're trapped. Chasing shorts or longs gets you rekt fast. The current range-bound market is between 2,170 and 2,440: you can go long around 2,200, short at 2,300, and add to your short at 2,430. Bitcoin at 75,200 is a good level for a small long position, and around 80,000 for a short. For ultra-short-term trading, any level works. In crypto, short positions have a 70% win rate and long positions a 30% win rate. That's a
post-image
ETH-1.26%
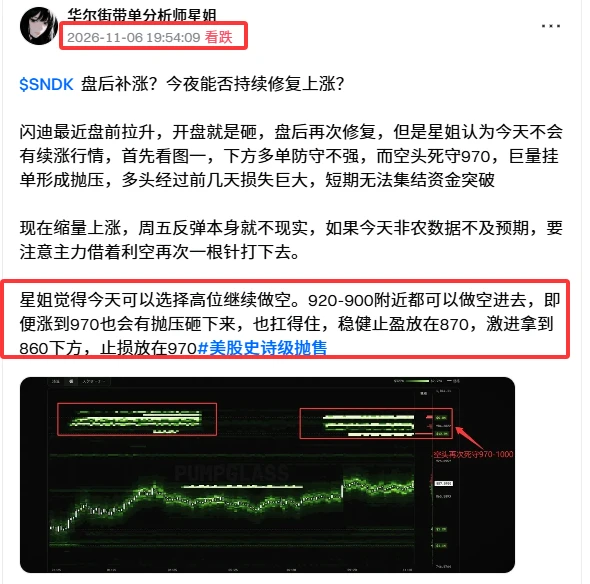
$SNDK The anticipated reversal failed to materialize, and prices fell back again🔥

Star Jie said last night that SanDisk wouldn’t see a strong recovery, and that any recovery would have to wait until next Monday. It’s the weekend, after all, and the overhead supply hasn’t been fully cleared. There aren’t enough buyers chasing the rally, so it’s inherently difficult to push prices higher. They were dumped back to around 810.

However, SanDisk now appears to be holding firmly above 800, and it also saw a brief recovery toward the close. Star Jie estimates that SanDisk will rally on Monday#美股AI板
post-image
SNDK-0.18%
The Three Storage Giants Plunge in Unison! SanDisk, Micron and SK hynix Take a Beating—Which Is the Real Bargain?

AI class isn’t over yet, but storage stocks have already handed in their papers! SanDisk, Micron and SK hynix have faced heavy selling recently, with some stocks falling more than 10% in a single day. Once hot favorites in the AI supply chain, they’ve now become hot potatoes that investors are scrambling to avoid.
But here’s the question: Has the industry’s boom peaked, or is the market overreacting?
SanDisk focuses on NAND flash, benefiting from demand for high-speed storage at A
MU+4.71%
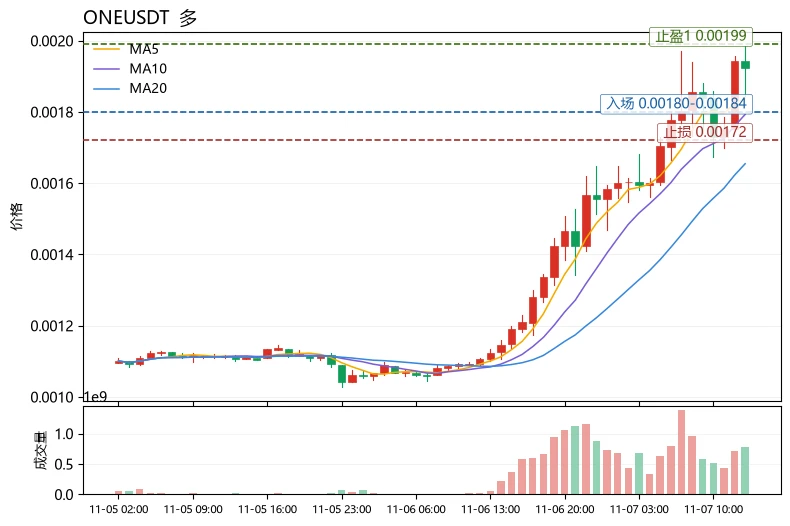
$ONE Current price: 0.001925, up 69.90% in 24h. RSI at 77.3 has entered overbought territory, and the 30-candle range is 48.02%, with volatility at an extreme level. The funding rate is -0.0003%, so shorts are still paying, but the Fear & Greed Index is only 25. Short squeezes amid extreme fear are often accompanied by sharp pullbacks. Assessment: The medium-term bullish structure remains intact (MA5 crossed above MA20, MACD histogram is positive), but chasing the rally in the short term offers a very poor risk-reward ratio. Only enter on a pullback; do not chase.

Reference entry range: 0.001
post-image
WLD-5.61%
#每周来晒
📉 The US Stock Market Sell-Off: What Should Investors Learn?

Thursday's trading session was a strong reminder of how quickly market sentiment can change. The Nasdaq dropped 5.5 %, the S&P 500 lost 4.4 %, and the Dow Jones fell 3.4 %. Technology and semiconductor stocks experienced some of the heaviest losses. NVIDIA, AMD and other companies connected with AI infrastructure came under serious selling pressure. When I see such movements, I do not immediately think that the entire technology sector has lost its future. I believe it is more useful to understand what made investors change
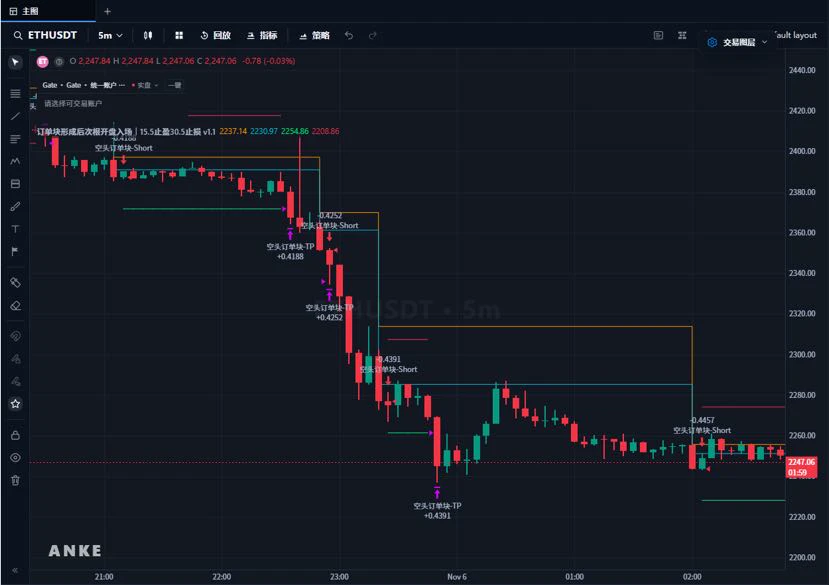
📊 ANKE AI — An AI-assisted charting platform for traders

Trading shouldn’t require spending so much time writing indicators and debugging code.

ANKE AI aims to lower the barrier to developing indicators and strategies, allowing traders to describe their trading ideas in natural language and use AI to generate indicators and standalone strategy code.

From trading charts to strategy development, technical tools are brought closer to traders’ real-world needs.

Make it easier to turn ideas into strategies and simplify strategy development.
post-image
#$AKE It’s a day off today, so there’s not much movement. Many people may not be able to resist trading altcoins, but I don’t recommend it. Its daily chart is heading straight down. It keeps getting pumped up, then crashes hard again. You can tell it’s a completely manipulated coin. Everyone should try to stay away and be careful not to get targeted for liquidation.
post-image
AKE+6.07%
I can't believe my twenties are over, where does it go?
post-image
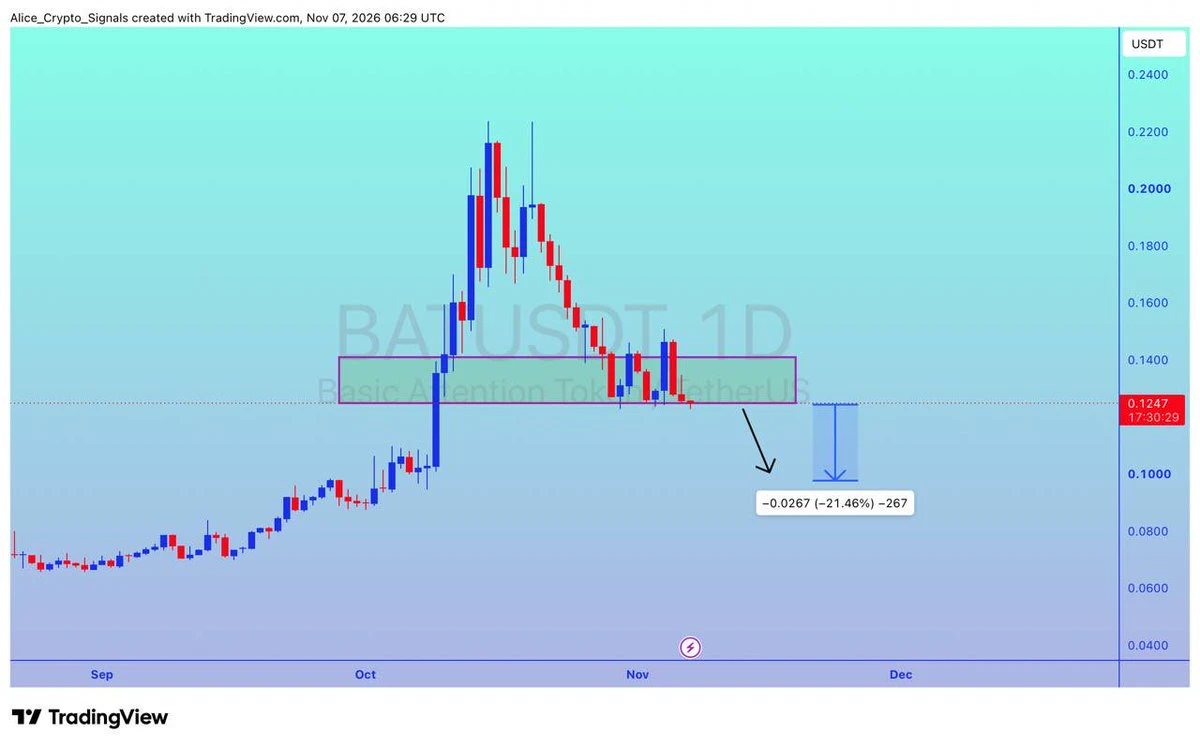
$BAT
UPDATE
#BAT is looking for breakout. We can see 20%+ drop here ✍🏻
#BATUSDT #BATBTC #Bitcoin #Crypto #NFTs
post-image
BAT-6.72%
BTC-0.67%
The reports of people lying on the tracks in Japan are real...
Just today...
The situation in Korea is probably even more dire than in Japan, so...
May there be no leverage in heaven.
When a trading strategy starts to fail, should you adjust its parameters or stop trading?

The real danger isn’t that a strategy loses money, but that you don’t know why it’s losing and keep changing its parameters in an attempt to repair the returns curve.

A strategy may once have worked, but the market won’t always behave the same way.

A trend may turn into a range, liquidity may decline, trading costs may rise, and entry signals that once worked may gradually lose their edge.

So how should you tell?

Step one: Determine whether it’s a normal drawdown or a change in the strategy’s assumpt
post-image
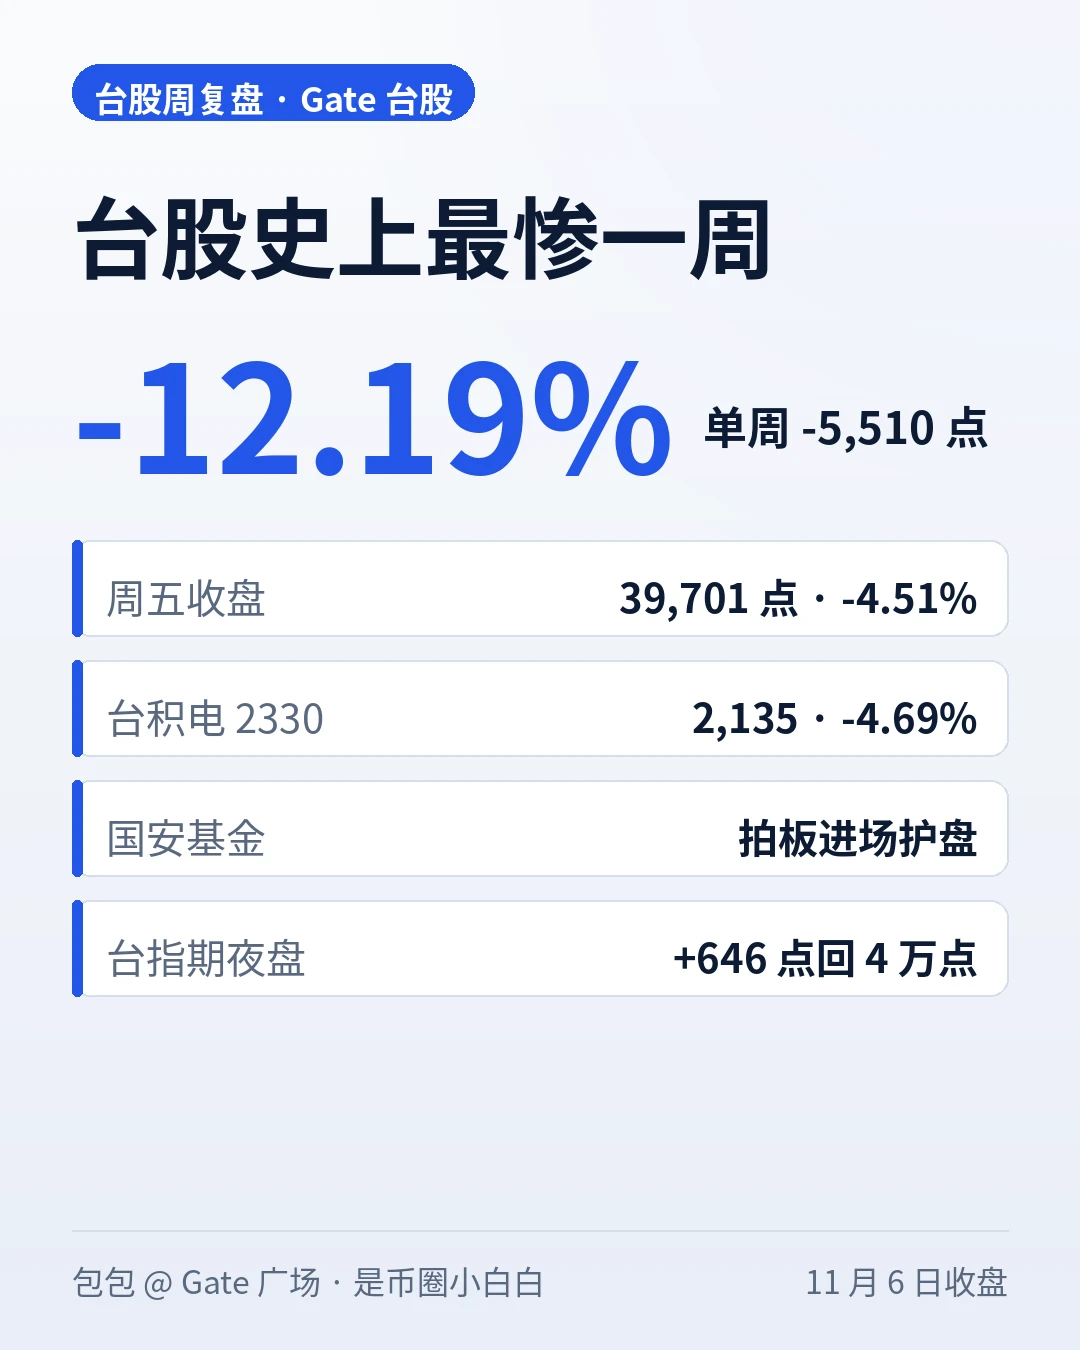
Taiwan stocks fell 5,510 points this week, down 12.19%—their worst single week ever.
‍#Gate上线台股交易
‍#AI科技股大跌加密市场承压
Week in review: The weighted index closed at 39,701.64 points on Friday, down 4.51%. It fell 5,510.19 points, or 12.19%, for the week, its largest weekly point loss in history. The weekly chart posted four straight declines, and the index fell for 7 consecutive trading days. Friday was especially nerve-racking: The market opened with a gap down below 40,000, hit an intraday low of 37,837.05 points, and at one point plunged 3,737.67 points, nearly 9%—also the largest intraday poin
post-image
TSM+6.60%
What Is Trading Expectancy? How Can You Tell Whether a Strategy Has an Edge Over the Long Term?

In crypto trading, some people review their win rate every day and look for better entry points, but overlook a more fundamental question: If you repeatedly trade according to the same set of rules, how much can you expect to earn or lose on average per trade over the long term?

That is the question trading expectancy aims to answer.

First, what is trading expectancy?

Trading expectancy is the theoretical average return per trade under a given strategy and set of statistical conditions. It analy
Load More

Join 40 M users in our growing community

⚡️ Join 40 M users in the crypto craze discussion

💬 Engage with your favorite top creators

👍 See what interests you

Trending Topics

USAIStocksHitHard

15.97k Views3.64k Discussing

U.S. stocks sold off sharply on Thursday, November 5 (UTC). The Nasdaq closed down around 5.5%, entering correction territory, while the Philadelphia Semiconductor Index plunged roughly 12%, with chip stocks including $NVDA and $AMD posting steep losses. Beyond profit-taking, investors are growing concerned about the pace of AI data center construction, capital spending, and future returns on investment. The key question now is whether the AI sector’s lofty growth expectations need to be repriced. Where do you think the next opportunities will emerge: chip stocks, tech giants, or other sectors?

USNonfarmPayrolls

23.64k Views4.26k Discussing

StakeOnLaunchpoolToShare450KVLX

2.62k Views774 Discussing

View More