Square
Following
Hot
News
Profile
Share your thoughts
placeholder
Article
Imagine still desperately chasing the next memecoin pump and dump for a quick buck, when fundamentally strong onchain businesses look like this.
why make life so hard when it could be this easy?
MEME-0.61%
Today, we are only checking one question for $ENA : whether it can quickly reclaim 0.2182 after breaking below it.
The 1-hour timeframe is weak while the 4-hour timeframe is strong, with RSI at 44 and 65, respectively. The current price is 0.2209, about 1.22% from the 1-hour support at 0.2182 and about 2.04% from the resistance at 0.2254. The 24-hour change is +1.19%, but it cannot replace confirmation at key levels.
My view is not based on chasing rallies or selling into declines: I will wait for a break above 0.2254 or below 0.2182, and whichever comes first will determine how I reassess.
Wo
post-image
ENA+1.53%
Afternoon Market Updates
live-cover
LIVE24
Trade to the Top and Unlock Airdrops Worth up to 100,000 USDT https://www.gate.com/campaigns/site-444?ref_type=132
post-image
#EthereumUpOver71%inQ3
$ETH
Ethereum's 71% Q3 Rally: Institutional Demand Meets a Critical Technical Test
Ethereum's reported gain of more than 71% in the third quarter highlights the powerful interaction between institutional capital, market liquidity, and changing macroeconomic expectations. However, a strong quarterly performance does not automatically guarantee another bullish move. The next phase depends on whether capital inflows continue and ETH can establish a sustainable position above key resistance levels.
1. Institutional Capital Is an Important Driver
Spot Ethereum ETFs attracte
post-image
ETH+0.30%
BTC+0.66%
Egg coffee from Vietnam was sooooo good !!!you should try !
post-image
$ALGO ALGOUSDT - this will go up
The price is moving within a descending channel on the 1-hour timeframe; it has reached the lower boundary and appears poised for a rebound. A retest of this boundary is expected, supporting an upward move.
The Relative Strength Index (RSI) indicates a bearish trend, but an upward breakout is likely due to oversold conditions on the 1-hour chart.
An orange trend line supports the potential upward rebound.
There is initial support at the 0.1000 level, acting as a primary support zone.
A key support zone (marked in green) exists at 0.0900; the price has rebounded
post-image
ALGO+3.17%
Financial News, Crypto Updates, Real Trading Strategies
live-cover
LIVE887
$LINK
OI was cut by 21% in one week, longs were chopped all the way down, and the price is hovering around 12.85—the long squeeze in the downtrend is not over yet. Failure to break above 13.02 would signal a pullback. I’m bearish; any rebound is an exit window—don’t wait for the breakdown to react.
post-image
BTC at $83,000—are you still holding?
Today marks the first anniversary of the “1011” crash. The wound from $19 billion in liquidations has yet to heal, and BTC has fallen from $126,000 to $83,000—a 34% retracement. Even more painful: on-chain data shows that the dense cost basis zone for 1 million BTC is stuck at $83,000-$86,000. Every penny you buy now is helping someone else break even. Is this merely a mid-bull-market pause, or has the bear market just begun?
First, the surface picture: range-bound at high levels, with neither bulls nor bears daring to act.
BTC is moving sideways on declin
post-image
BTC+0.38%
ETH+0.30%
SOL-0.30%
#btc $btc #xrp #crypto #eth
We had already missed the big picture back in June, when BTC was at 65K 🤌🤌🤌🤌🤌
post-image
BTC+0.38%
XRP-0.81%
ETH+0.30%
#BTCPullsBackTo81000
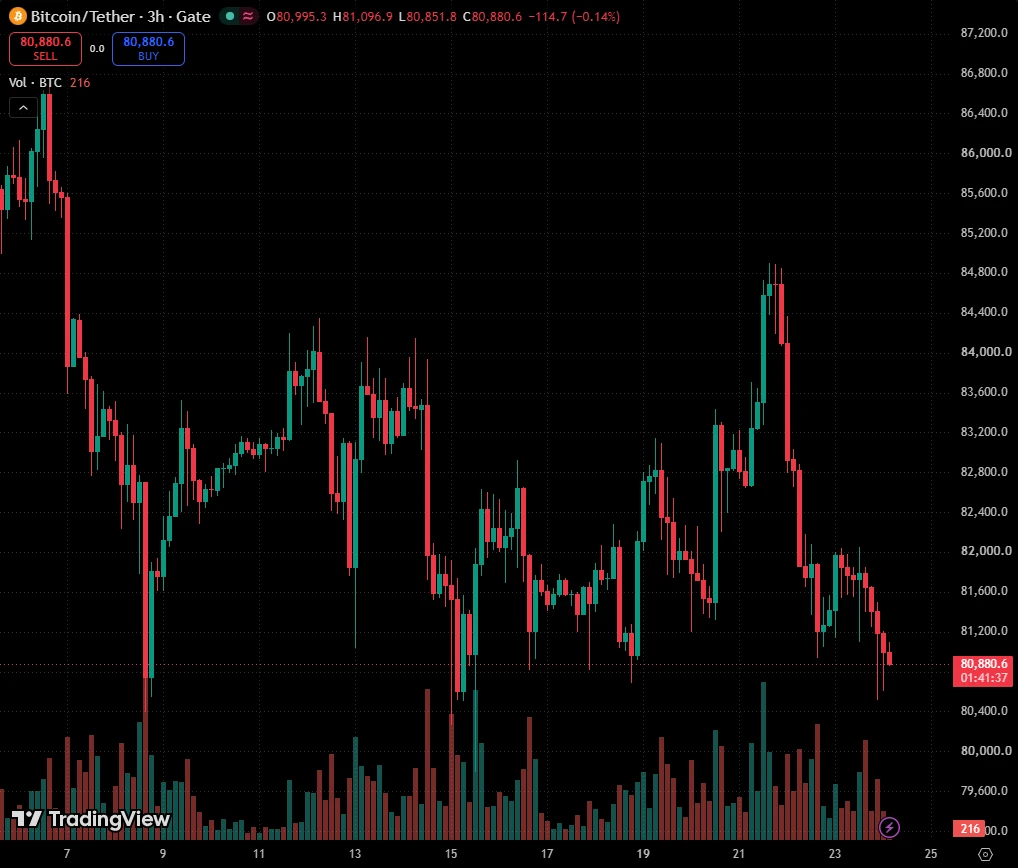
BTC tagged $81,000, bounced to $82,000, and the 24h drop has narrowed to about 1.5%. “Bulls and bears are battling” is true but useless, so here is what the daily chart actually says.
1. Why 81,000 matters
It’s not just a round number. On my daily chart it sits right on the 50-day MA (~80,950) and just under the 81,868 support line I’ve marked. That’s a confluence zone, which is why the bounce happened where it did.
2. The distance map (from ~82,000)
Up to 86,589 resistance: about +5.6%
Down to the 50-day at 80,950: about -1.3%
Below that, the next structural levels on my
BTC+0.38%
$XRP XRP/USDT: Key Support Holds, Potential Recovery Ahead
XRP is testing a key support zone around $1.37 to $1.39 on the 4H timeframe. This area aligns with the ascending trendline and has already triggered a rebound following the recent sell-off.
If support holds, XRP could recover toward $1.48 to $1.52, with further upside potential toward $1.60 to $1.63.
A breakdown below the support zone and ascending trendline would weaken the bullish outlook. Confirmation through price action remains essential.
post-image
XRP-0.84%
Still shaken!
After attending Token2049, my trip flying from Singapore back to Chengdu turned out to be unexpectedly tortuous, and budget airline Thai Lion Air taught me a harsh lesson
First, when I was checking in at the airport, my original suitcase got stuck with a Thai Lion Air trainee clerk, who said I had to pay an additional 260 SGD to check it in. I thought I could accept paying a few dozen SGD, but paying that much would be no better than buying a new ticket, so I had no choice but to abandon the suitcase
Fortunately, the MSX small carry-on suitcase that @HarlanMix Haolan had given me
Musk Apologizes to India’s Richest Man: I Was Too Blind to Recognize Your True Identity🥲
I can only imagine what the diehard Pudgy holders feel like watching their assets collapse in the beginning of a bullrun
Always wanted a penguin, might be time to throw stinky bids and catch the bottom
post-image
PENGUIN+16.34%
The employment data is out. People who have jobs are stable as can be, while those looking for work can’t even get a foot in the door. Only 29,000 jobs were added in September, versus expectations of 90,000, and those unemployed for more than six months accounted for 27%. There’s only one way to describe this market: employers aren’t hiring, and job seekers have no chance. Let’s cross-check the figures below over the weekend.
post-image
Bitcoin Will Stop Where If It Keeps Falling? CryptoQuant Forecasts Potential Bottom
CryptoQuant has analyzed Bitcoin's drawdowns across previous bull cycles to assess the current downside risk. The findings show the ongoing correction remains milder than the historical average.
The Bitcoin Bull Cycle Price Corrections indicator tracked the average drawdown for each cycle: 18.41% (2010–2011), 21.71% (2011–2013), 10.93% (2015–2017), 19.39% (2018–2021), and 7.58% (2022–2025). Across all five cycles, the average sits at roughly 14.39%.
⚠️ Personal market analysis only. NFA — manage risk and DYOR.
post-image
BTC+0.38%
  • 2
$LAB I’d advise you not to rush to curse yourself—curse the market maker instead.
When prices were rising, everyone was shouting bullish calls and you chased in; once they dropped, people immediately came out saying that if you didn’t get out at this level, you’d lose everything. So they’ve had all the good and bad things to say. Fuck, you pulled me in when you pumped it, I’m still holding while you dump it, and now you come out with, “No one understands it better than I do”?
This is what you call understanding it? To the brothers who lost money, here’s a hug. I don’t understand this level eit
post-image
LAB-2.34%
Load More

Join 40 M users in our growing community

⚡️ Join 40 M users in the crypto craze discussion

💬 Engage with your favorite top creators

👍 See what interests you

Trending Topics

GateAtTOKEN2049

40.76k Views21.68k Discussing

Gate brought a series of major events to TOKEN2049 Singapore! From the official launch of Gate Money to the F1 Red Bull driver meet-and-greet and the Gate Gala, we witnessed a new chapter of "One Gate, Borderless Finance." Which moment from TOKEN2049 stood out most to you?

LedgerLossesNear90Million

39.32k Views240 Discussing

GateWCTCS9GlobalTradingCompetition

33.93k Views5.03k Discussing

View More