

Share your thoughts
placeholder
Article
👀 I’m keeping $TRUMP /USDT on my radar here.
The chart looks like it’s trying to build momentum again after that sharp flush. Price has climbed back above the short-term moving averages, but I’m not chasing the move I want to see buyers prove they can hold the breakout area.
📍 Entry Zone: $2.30 – $2.34
🎯 TP1: $2.42
🎯 TP2: $2.50
🎯 TP3: $2.58
🛑 Stop Loss: $2.24
If $2.34 holds as support, the next push toward the previous resistance zone could get interesting. ⚡
My approach: patience on the entry, partial profits on the way up, and strict risk control if the setup breaks down.
⚠️ Disclaime
post-image
TRUMP-2.00%
ZEC Brief
Current price: 1018.43. The 4-hour chart has entered a strong primary uptrend, retreating slightly after surging to 1052.11. Catalyzed by ETF news, it is clearly outperforming the broader market.
Upside resistance: 1027.23; short-term support: 895.21.
News-driven capital is entering the market in force, with ample bullish momentum, driving an independent rally apart from major cryptocurrencies. As long as the 895 level holds, the strong trend is likely to continue, with potential to challenge new highs; however, after a massive short-term cumulative gain, a rapid pullback could occur
post-image
ZEC+9.67%
BTC-1.40%
ETH-2.05%
GLDX-0.94%
PAXG-0.98%
$AKE Short it—it has already run out of steam on the upside, and the bears have gathered.
post-image
AKE+31.87%
  • 5
JUST IN: A $70M Bitcoin-themed movie is in post-production, reportedly depicting Craig Wright as Satoshi Nakamoto, sparking renewed debate in crypto circles. $BTC 🎬
post-image
BTC-1.40%
Positioned in SanDisk on Wednesday, and today I pocketed 200 points $SNDK @$SNDK
post-image
SNDK+11.88%
【$Lobster Signal】1H pullback support, 4H bullish structure intact, go long
$Lobster rallied to 0.1027 then fell back to 0.0856, with continuous buying support below 0.0850, and the price holding above EMA20_1h. The 1H MACD histogram is -0.0001, with the negative value converging; the 4H MACD histogram is 0.0014, with momentum still intact. Order book depth favors buyers, with a Bid/Ask ratio of 1.11, and the funding rate is 0.0174%, with stable OI.
🎯Direction: Go long
⚡Entry/limit order: 0.0853631 - 0.0856200 range
🛑Stop-loss: 0.0847638
🚀Target 1: 0.0869043
🚀Target 2: 0.0875464
🛡️Trade ma
post-image
龙虾+9.05%
BTC-1.40%
ETH-2.05%
SOL-1.66%
Everyone’s staring at WLD’s 0.389 support—but what if that’s the exact spot the whales are waiting to fade?

$WLD /USDT - SHORT

Trade Plan:
Entry: 0.388 – 0.390
SL: 0.402
TP1: 0.379
TP2: 0.373
TP3: 0.364

Why this setup?
- 4H bias is SHORT with 55% confidence, but the 1D trend is *range*, not downtrend—so this is a scalp, not a saga.
- RSI on 15m is already overheated at 70.6—buyers are tired right as price kisses the range mid.
- ATR on 1h (0.0053) is tight—the breakout from 0.389 will be violent; don’t chase, wait for the rejection candle.
- Why now? Price is at the exact entry_ref
WLD-2.01%
$1000 to $100,000 Crypto Trade Challenge Today
live-cover
LIVE556
Crypto Prediction and Trading Insights
live-cover
LIVE1,575
$UAI was still at 0.51 an hour ago, but has now plunged straight back to 0.45, with $107 million in 24-hour trading volume. The volatility of this kind of meme coin is more intense than SOL’s entire week. Don’t stare at the candlestick chart asking why: the Fed’s hawkish March meeting minutes were released early today, sending the probability of a June rate cut from 73% down to 61%, while the 2-year U.S. Treasury yield surged to 4.8% and Nasdaq futures plunged. AI-sector coins were hit the hardest because these high-beta assets are the first to be drained of liquidity.
I ran a correlation bac
UAI+29.10%
SOL-1.66%
NAS100-0.43%
BTC-1.40%
USIDX+0.15%
Japanese government bond yields reach 3%, and many people’s first reaction is:
What does this have to do with me?
Actually, quite a lot.
Because Japan has been one of the important sources of low-interest-rate funds globally for decades.
As Japanese interest rates rise again, U.S. 10-year Treasury yields hover around 5%, and oil prices move higher, global markets are essentially recalculating:
Is money still cheap?
If the answer becomes “No, it isn’t cheap,” the valuation logic for many assets will change.
High-valuation tech stocks will have to face renewed discount-rate pressure;
Corporate b
post-image
GLDX-0.94%
PAXG-0.98%
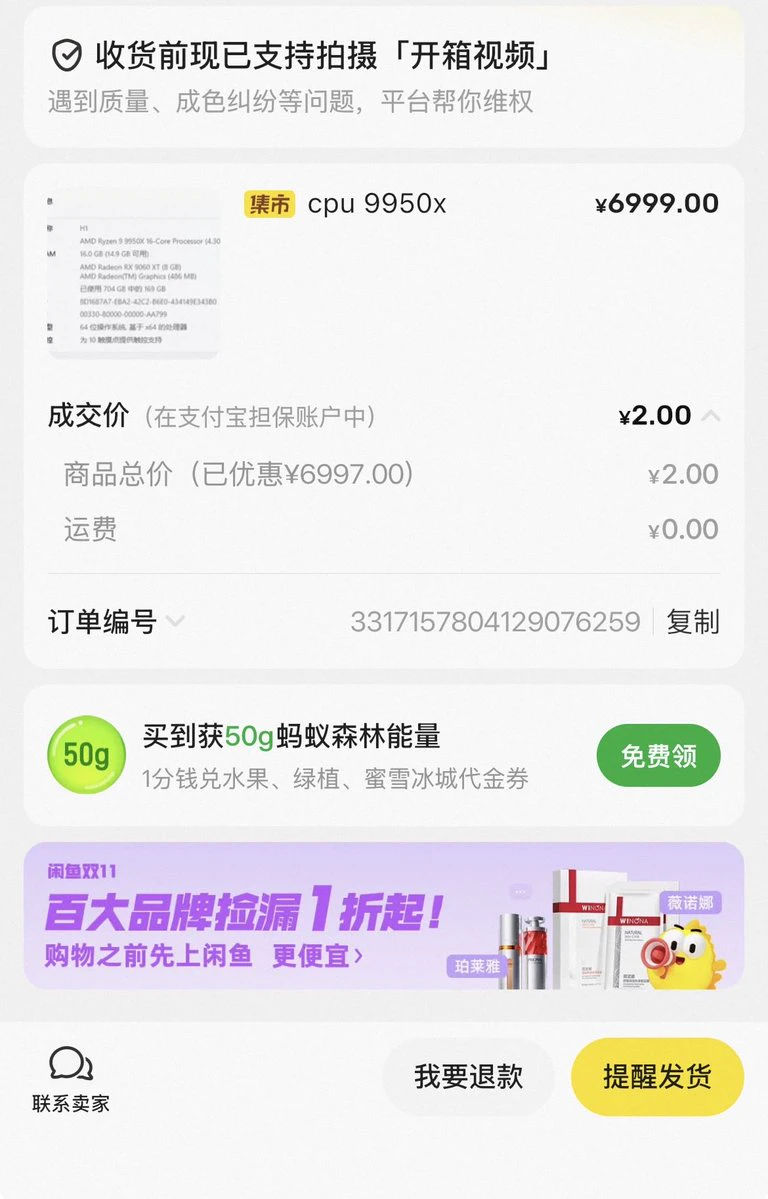
Damn!
Xianyu really is the dark web.
It has sellers of every kind.
post-image
Stable trading and continuous compounding are the way to go. If you compound steadily at 5% per day for 100 days, it will result in 100 times the original amount.
If you take a heavy position on every trade seeking high returns, it will inevitably come with high risk. You should only take a heavy position occasionally based on the situation and your judgment; you cannot keep taking heavy positions. No matter how much you win, you are ultimately destined to get trapped and see your gains reduced to zero.
December 14: Looking forward to the results in 100 days.
post-image
🟢 $ONDO is quietly setting up and that’s exactly what caught my eye.
I’m not interested in the noise around this chart. The interesting part is the reclaim: price has pushed back above the short-term averages after defending the lower range. Now I’m watching whether buyers can turn this bounce into a proper continuation.
Trade Map 👇
🎯 Entry Zone: 0.3600 – 0.3650
🚀 TP1: 0.3720
🚀 TP2: 0.3800
🚀 TP3: 0.3900
⛔ Stop Loss: 0.3530
The 0.3720 area is the first real test. A clean break with volume could open the door toward the higher targets. If price loses the entry structure, I’d rather step as
ONDO+1.34%
I originally just wanted to freeload a breakfast, but the market ended up wrapping me in dumplings for half a year.
A few days ago, during that late-night pullback, to be honest, many people were shouting that support had broken. I stared at the $DOGE /DOGE chart over and over, but the key level never actually broke; instead, volume kept stabilizing. I posted one sentence at the time: Bottom consolidation isn’t weakness—it’s funds quietly accumulating. The long entered at 0.08454 and ground its way up to 0.08483, sending the unrealized profit straight to +31.91%. At this point, I’m not going to
post-image
DOGE-2.97%
ETH-2.07%
XRP-3.34%
Everyone’s long silver, but the 4H clock just ticked against $XAG /USDT—here’s the ugly side of 66.3.

$XAG /USDT - SHORT

Trade Plan:
Entry: 66.2 – 66.4
SL: 67.1
TP1: 65.7
TP2: 65.3
TP3: 64.6

Why this setup?
Why fade the bounce?
- 1D is stuck in a range, so rallies die fast.
- RSI 15m at 53.9 = zero momentum, just a dead-cat wiggle.
- ATR 1h (0.35) says volatility is low—breakouts fake out.
- Entry 66.3 with TP1 65.7 is a clean 0.9% grab before resistance at 66.9 slaps you.

Debate:
Are you trusting the range top at 66.9, or is this the one time silver breaks your short’s heart?
XAG-0.96%
👀 I’m watching $PUMP /USDT, and this one is getting interesting.
PUMP is moving inside a tight range after the recent swings. Price is holding around $0.00424, while the chart shows buyers trying to defend the lower area. For me, the key is a clean push above the nearby resistance rather than chasing random candles.
📍 Entry Zone: $0.00420 – $0.00428
🎯 TP1: $0.00440
🎯 TP2: $0.00455
🎯 TP3: $0.00470
🛑 Stop Loss: $0.00408
If momentum returns with volume, that previous $0.00455 high becomes an important level to watch. ⚡📈
I’d keep the position controlled, take partial profits along the way,
post-image
PUMP+0.72%
How to Find 100x and 1,000x Assets in a Bull Market
1. Choose the right sector, with a high enough ceiling, strong potential, and ample room for growth;
2. This year's hot sectors are the BTC ecosystem, ETH ecosystem, and SOL ecosystem;
3. The BTC ecosystem has produced 100x, 1,000x, and 10,000x assets, with a clear wealth-creation effect;
4. The ETH and BSC ecosystems have performed moderately, with no dark horses emerging for now and no wealth-creation effect currently visible;
5. Many coins in the SOL ecosystem have surged this year, creating wealth-making opportunities, with foreigners mak
post-image
BTC-1.40%
ETH-2.05%
SOL-1.66%
CORE-0.64%
  • 1
9.5 BTC Analysis
As the weekend approaches, market liquidity is contracting, and the market will most likely enter a narrow-range consolidation. BTC has completed a breakdown and pullback on the one-hour timeframe, with the Bollinger middle band forming strong resistance, while short-term bearish momentum has not yet fully abated. The bull-bear dividing line above is 79878; if it cannot be reclaimed, the overall market will remain in a relatively weak consolidation. Keep a close eye on support near 78501 below. Once it breaks decisively, the room for a pullback will open further.

Weekend tra
post-image
BTC-1.40%
Load More

Join 40 M users in our growing community

⚡️ Join 40 M users in the crypto craze discussion

💬 Engage with your favorite top creators

👍 See what interests you

View More