
Share your thoughts
placeholder
Article
Everyone is calling SKHYNIX a range-bound asset, but the data says otherwise.

$SKHYNIX /USDT - SHORT

Trade Plan:
Entry: 1335.46 – 1338.16
SL: 1349.77
TP1: 1327.09
TP2: 1320.61
TP3: 1310.89

Why this setup?
Why now? The 1h price sits at 1336.81 inside a tight entry zone, and the 15m RSI at 45.96 signals neutral-to-bearish momentum just before a potential push lower. The 1h ATR of 5.39993 confirms that any breakout will likely be a swift 5+ point move, giving enough room to target TP1 at 1327.09 and TP2 at 1320.61 while the daily trend remains range-bound. The invalidation level at 1320.66
SKHYNIX+0.06%
$MSTR
1. A weekly MSB
2. 4 weekly closed above weekly 400EMA
3. Approaching weekly 200EMA which most likely price could start to pullback
4. Anticipating another demand block to form
5. A weekly closed above $197 is a HTF 90% confirmation a reversal is solid
post-image
MSTR+16.35%
$ENA Conclusion first: this +11.45% surge should for now be considered merely an oversold rebound, not a trend reversal; the risk of chasing higher is greater than the opportunity.
To determine whether the trend is healthy using moving averages, you only need to look at two points: the relative position of the price and moving averages, and whether the short-term moving average has crossed above the long-term moving average. Currently, MA5=0.19608 remains below MA20=0.20051, with the moving averages in a bearish alignment, indicating that medium-term costs are still suppressing the price and t
post-image
ASTER-2.85%
🔥Bitcoin BTC has bounced, but 82300 is the real test!
One sentence to sum up BTC right now: The bulls have the upper hand, but price is still stuck in a range, so don’t rush to call the bull market’s return🐂
From the September 15 low of 74965, it has climbed nearly 9% at the high, with the current price in the 81200–81900 range.
✅The short-term market trend is bullish. This large green candle wiped out a significant number of shorts, RSI has not entered overbought territory, and upward momentum remains intact.
⚠️But! This is only a rebound, not the start of a new bull market. There is still
post-image
BTC-0.90%
Insiders are calling the SYMBOL setup a trap, but the numbers tell a different story.

$G /USDT - LONG

Trade Plan:
Entry: 0.014501 – 0.015075
SL: 0.012035
TP1: 0.016853
TP2: 0.018229
TP3: 0.020294

Why this setup?
Why now? The 1h price just printed 0.014785 against a 15m RSI of 77.59, which means momentum is stretched but still directional inside a daily bullish trend. The 1h ATR of 0.001147 shows the average candle is tight enough that our entry zone at 0.014788 offers a clean risk-defined fill between 0.014501 and 0.015075. From there, TP1 at 0.016853 and TP2 at 0.018229 represent measur
G-1.56%
When it comes to market action, the more anxious you are, the more it grinds you down—only moving after you give up. While everyone was still waiting and watching, I held onto my short position. Looking back now, it was worth it.
$PRL Every push upward fell just short, with clear resistance overhead and insufficient buying support. I saw that the volume was off and warned against chasing the rise; rebounds are opportunities to enter short positions. Bullish.
From 0.33936 to 0.11405, the short position gained +1309.69%. Those who were on board must be wide awake with laughter. It was truly slug
post-image
PRL-5.77%
BTC-0.93%
ZEC-7.32%
Yesterday I opened a short on ETH at 2650 and closed it at 2640, planning to go long and reverse at 60. But because I set the stop-loss too high, I was stopped out at 30. I got a little anxious and opened a short after a slight pullback. It did indeed reach 60 later, and only after adding to my position did I bring the average entry price to 2653. Looking back, I could have lowered the stop-loss a bit and profited from both moves. I’ll be more careful next time.
Today ETH fell a lot and moved sideways around 2580 for a long time. I got a little anxious, so I closed 1/4 at 72 and also moved the
ETH-1.98%
The Fear & Greed Index is at 71 and remains in the greed zone, so many people simply assume “greed = keep chasing longs.” This is a typical trading misconception. A greed reading only indicates that sentiment has not yet cleared out; it does not mean prices still have upward momentum. Especially when a coin has already weakened ahead of the broader market, sentiment and price often diverge.
Looking at the current structure of $XR : current price 1.3841, down 2.65% over 24h; MA5=1.38218 has crossed below MA20=1.41068, with the short-term moving average turning down and exerting pressure; RSI=40
post-image
LSK-10.37%
🔥Sunday daytime free strategy levels👇
🔥Long entry levels (second entry, short entry, and take-profit levels are in the pinned subscription post; long and short spot setups are also in the pinned post)
===========
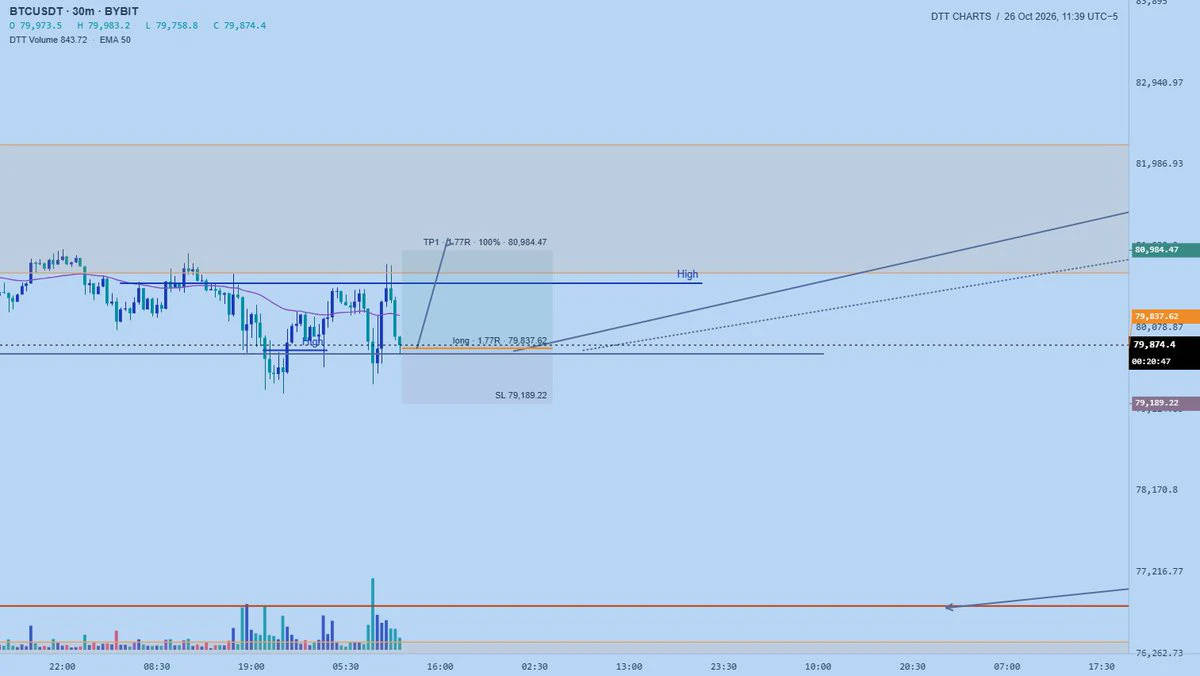
79,850 long, 79,550 long, stop-loss 78,150
2,565 long, 2,545 long, stop-loss 2,495
#GarrettJin晒单持有3.2亿美元ZEC
ZEC-7.32%
$WLD WLD is holding firm here. Once the market stabilizes again, I expect WLD to rise sharply. This is a long-term position.
Entry: $0.42 - $0.43Take-profit: $0.45 - $0.47 - $0.5 - $0.55 - $0.6 - $0.8Stop-loss: $0.383
post-image
WLD+2.25%
#MSTRTopsNasdaq100
🌈 #GateLiveStreamingInspiration -September 20

Go live with the following topics now to receive extra official support and promotional exposure!
Today's Topic Recommendations:
🔹 Michael Saylor: The best way to protect digital asset innovation is to expand adoption.
🔹 Analysis: Bitcoin market behavior has undergone a substantial shift, moving from panic selling to buying on dips.
🔹 iPhone users, please check if FomoPeek is installed, as it can exploit iOS vulnerabilities to gain root access to your device.
🔹 Bitcoin's market capitalization surpasses Tesla's, returning
BTC-0.90%
GT+0.89%
ETH-1.93%
  • 2
🟩 Ethereum officially recorded the best third quarter in its history, with a rise of +67.89% in Q3 2026.
According to CoinGlass data, ETH thus surpassed its previous record for this period of the year, set in 2025 at +66.55%, as well as 2020 at +59.5%.
The contrast with the beginning of the year is huge, as Ethereum ended Q1 at -29.26% and then Q2 at -25.28%.
post-image
ETH-1.93%
  • 1
MARket prices updates
live-cover
LIVE664
I had already finished venting to my friends about this week’s market, but now I have to take it all back. A bit awkward.
One afternoon a few days ago, I saw $SKHYNIX hold firm after a retest as buying pressure strengthened. I didn’t explain any complicated logic—just said to go long if you could follow. Now it has moved from 1171.00 to 1338.22, with a return of +1014.63%. This was a satisfying bite of profit—the price action was genuinely sluggish at first, but once it broke out, it felt great.
Take profit on 80% first, and protect the remaining 20% at the entry price. Don’t get greedy for t
post-image
SKHYNIX+0.06%
SNDK-0.88%
ETH-1.98%
Everyone is sleeping on $G /USDT while this 95-score setup cooks silently.

$G /USDT - LONG

Trade Plan:
Entry: 0.013358 – 0.013946
SL: 0.010830
TP1: 0.015769
TP2: 0.017180
TP3: 0.019297

Why this setup?
Why now? The daily trend is firmly bullish, giving us a high-confidence directional tailwind that rarely shows up this cleanly. The 15m RSI at 71.35 tells us momentum is still accelerating without yet hitting exhausted territory, so we are early, not late. The 1h ATR of 0.001176 means every tick of movement carries real volatility worth trading, not just noise around the entry zone sitting
G-1.56%
BTC AND ETH MARKET STRUCTURE
live-cover
LIVE1,032
#GateTops24HNetInflowsAmongExchanges
Capital movement reached a new peak as seven day net inflows crossed 273 million, establishing a fresh all time high and marking a clear acceleration compared with every previous cycle recorded.
From Daily Strength To Weekly Record
Earlier data showed 19.21 million in 24 hours, while a prior snapshot placed daily inflow at 10.567 million and weekly inflow at 74.84 million. In another seven day window the figure stood at 122.64 million, a level that had placed the platform among the top two centralized venues globally. The new reading of 273 million more th
USD1-0.01%
Bitcoin ($BTC ): $81,000
post-image
BTC-0.90%
Insiders are quiet on SYMBOL but the numbers just screamed LONG

$ONDO /USDT - LONG

Trade Plan:
Entry: 0.4057 – 0.4101
SL: 0.3868
TP1: 0.4237
TP2: 0.4342
TP3: 0.4500

Why this setup?


Debate:
Are we about to blow past TP2 or is 0.3661 going to wreck the long?

⚠️ Personal market analysis only. NFA — manage risk and DYOR.
Educational content, not investment advice or a recommendation to buy, sell, deposit, or withdraw any asset. No paid promotion or referral/affiliate links.
ONDO+3.41%
Turns out making 100 million is that simple.
post-image
Load More

Join 40 M users in our growing community

⚡️ Join 40 M users in the crypto craze discussion

💬 Engage with your favorite top creators

👍 See what interests you

Trending Topics

MSTRTopsNasdaq100

73.18k Views2.71k Discussing

Strategy (MSTR) has gained about 48% over the past month, making it the best-performing stock in the Nasdaq 100, while Bitcoin rose roughly 12% over the same period. The company holds 845,050 BTC with a cumulative cost basis of about $63.73B. MSTR is not a pure Bitcoin proxy — its price swings can be more extreme. Can this rally last?

Gate Tops 24H Net Inflows Among Exchanges

26.23k Views3.67k Discussing

BTCRetakes80K

56.28k Views60.08k Discussing

View More