Square
Following
Hot
News
Notifications
Profile
Share your thoughts
placeholder
Article
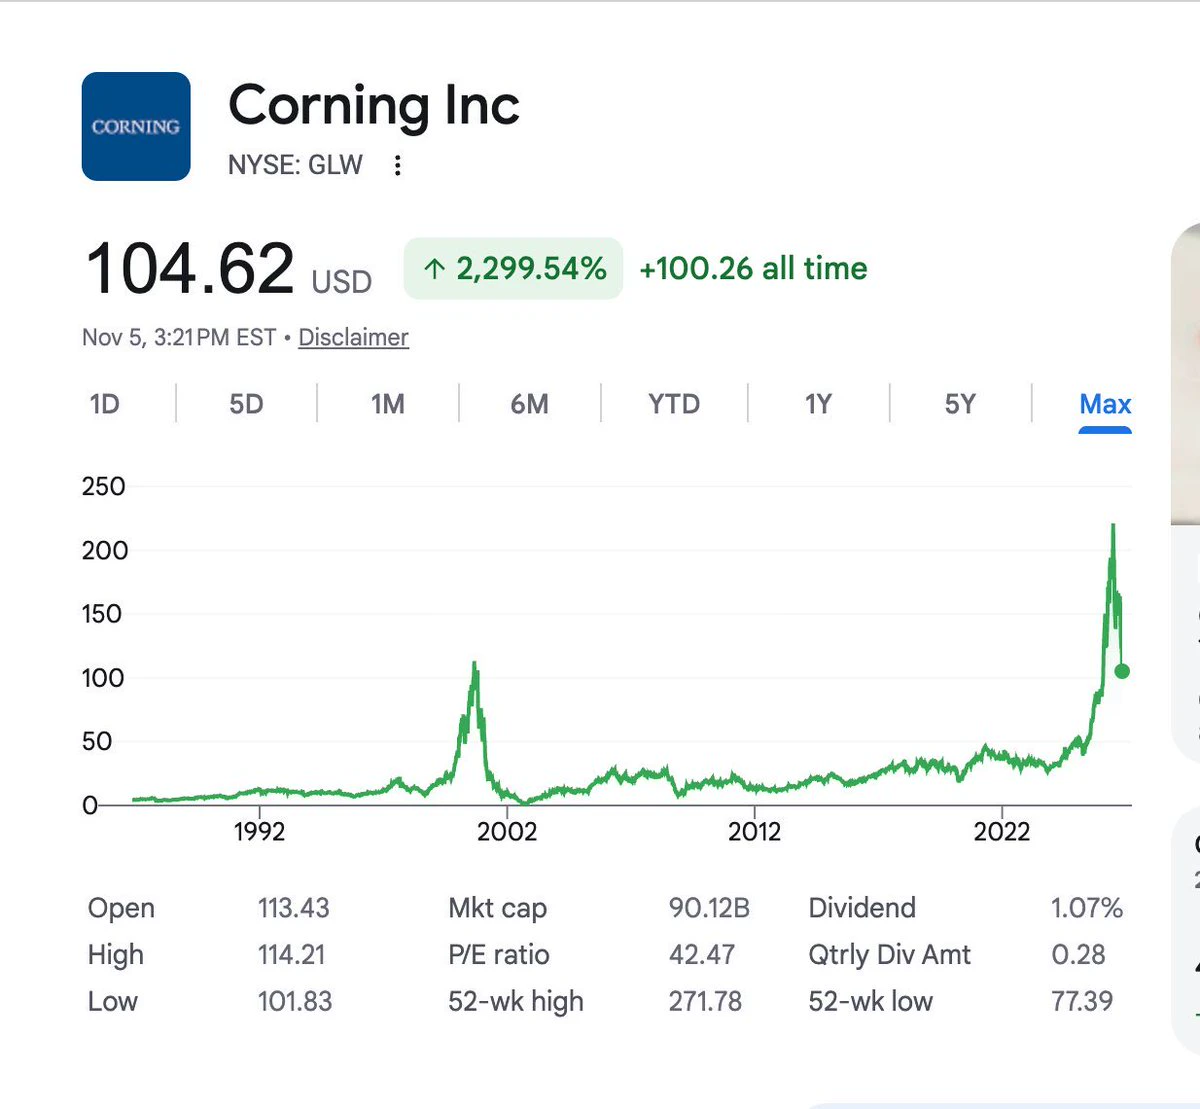
Bulls, take a look at this candlestick chart
You say after falling from such a sharp peak
the stock price can return to a bull market and make new highs?
Does this conform to the basic laws of physics?
Isn't this just 2000 on a larger scale?
Is this time really different?
Thanks, everyone
post-image
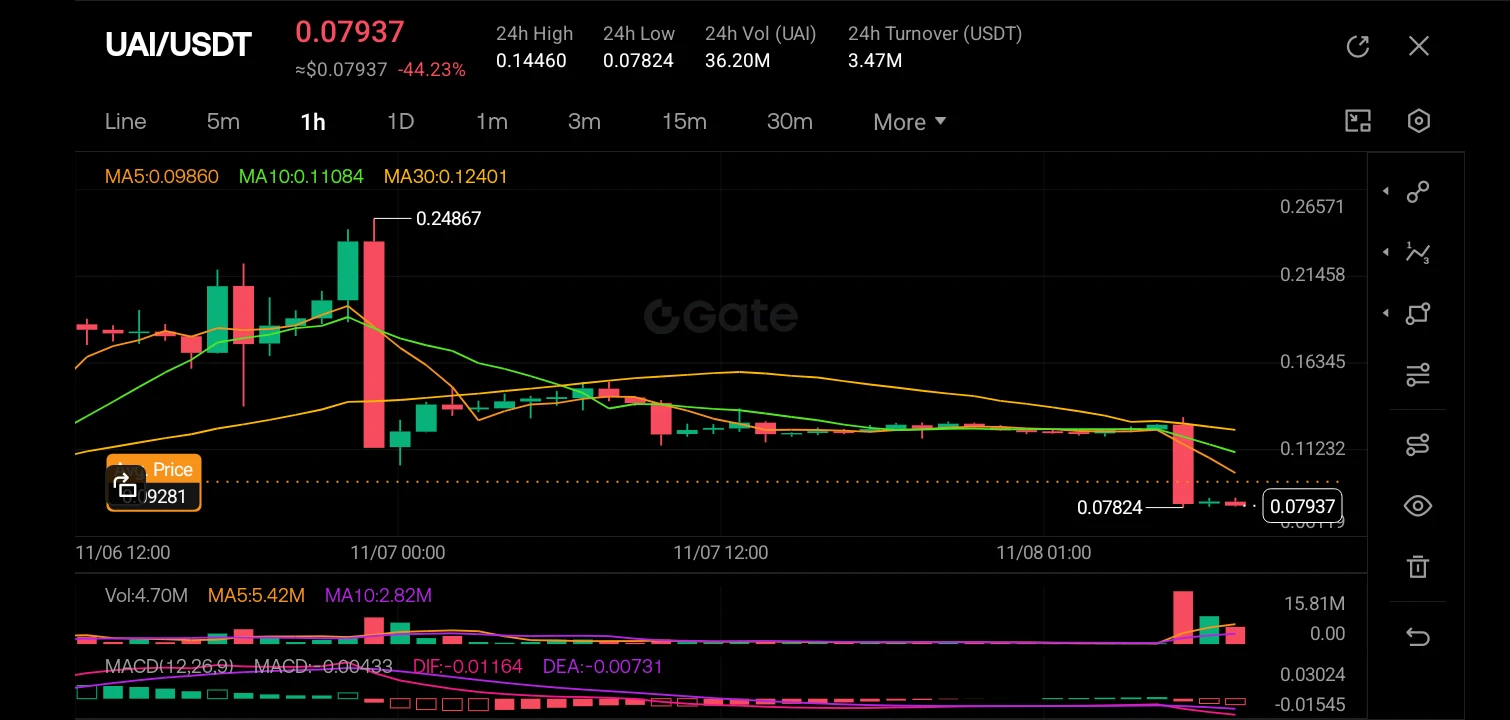
$UAI ‌
The 1-hour chart for UAI/USDT is showing a severe bearish breakdown, with the price currently sitting at 0.07937, representing a massive 44.23% drop over the 24-hour period. The chart clearly displays a steep waterfall decline from the recent high of 0.24867, completely obliterating the short and medium-term moving averages (MA5, MA10, MA30), which are now fanning out downwards in a classic bearish alignment. The most recent candle is a massive, long-bodied red marubozu that has crashed through any nearby support levels, accompanied by a significant volume spike (15.81M), indicating in
post-image
UAI-7.58%
  • 3
Trenches
ZIG
Z
bade
b
ZIG
0x8c...1145
Market Cap
$.
Change
.
24h Vol
$.
Holders
.
STONK
S
bade
b
STONK
6GmA...UNgx
Market Cap
$.
Change
.
24h Vol
$.
Holders
.
IDOL
I
bade
b
IDOL
0x3b...ab07
Market Cap
$.
Change
.
24h Vol
$.
Holders
.
BTC
B
bade
b
BTC
C5xp...pump
Market Cap
$.
Change
.
24h Vol
$.
Holders
.
FLOAT
F
bade
b
FLOAT
Bv1a...BMmr
Market Cap
$.
Change
.
24h Vol
$.
Holders
.
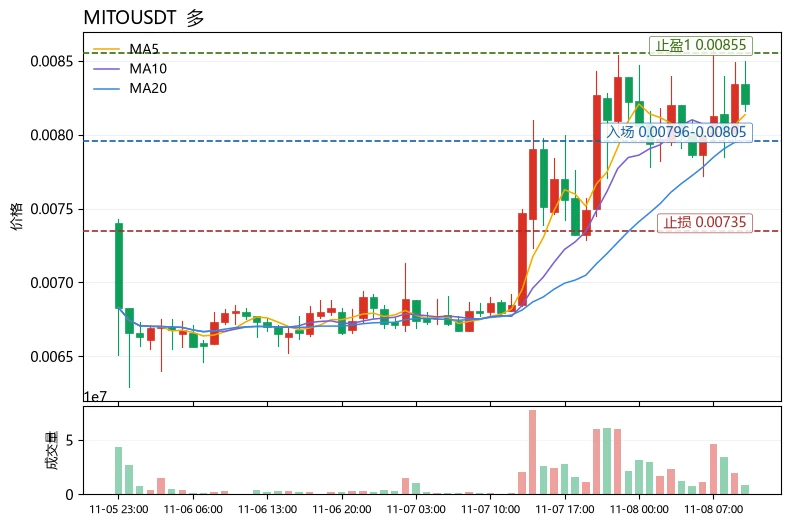
$MITO Short-term bias is bullish, but this is a low-tolerance trade amid high volatility, so the position must be kept below half the usual size. Rationale: The current price of 0.00821 is above MA5 (0.008136) and MA20 (0.0079635), with the moving averages in a bullish alignment; however, the MACD histogram remains negative (-1.393e-05), indicating that upward momentum is not yet confirmed. RSI at 59.2 has also not entered the strong zone, and the 30-candle amplitude is as high as 23.51%, making this a typical high-volatility asset. The Fear & Greed Index is at 28, in the fear zone; sentiment
post-image
MITO+8.51%
HYPE+0.24%
ETH-1.26%
$KORU Keep going long and look for a rebound! Targeting around 7.5–8! Others are fearful, I'm greedy! Just go for it! Hop aboard and pick up some easy money!
post-image
KORU-1.22%
#USNonfarmPayrolls #每周来晒
🛑 Structural Recalibration: Macro Volatility Intensifies After Blockbuster October Labor Print

The global macroeconomic layout has entered a phase of intense structural repricing following the official release of the U.S. Bureau of Labor Statistics (BLS) October employment data. For multi-strategy funds and active trading desks, the historical predictive models have been completely upended. This is no longer an environment driven by speculative soft-landing narratives; it is a market reacting to undeniable, high-velocity labor resilience that alters the future path
post-image
XAU+0.38%
  • 4
  • 1
🔥Official Major Announcement | Pi’s First Ecosystem Summit Schedule Revealed🚀
The event will be livestreamed worldwide on YouTube, and Pi’s two founders, Fan Chengdiao and Nicolas, will both attend!
⏰ Beijing time:
✅Nov. 17, 12:00 a.m.: Developer platform launch, presentations by major ecosystem projects (ecosystem projects such as CiDi are expected to appear)
✅Nov. 18, 12:00 a.m.: Special session on AI and the Pi ecosystem, technical demonstrations, new feature announcements, and developer discussions
✅Nov. 19: Hackathon with a total prize pool of 200,000 USDT officially launches, attractin
post-image
PI-0.60%
  • 2
#Ahr999EntersBottomBuyingZone

Ahr999 Enters the Bottom-Buying Zone: Is Bitcoin Finally Becoming Undervalued?

The Myth: A Low Indicator Means Bitcoin Cannot Fall Further

Does a low Bitcoin valuation indicator mean the market has already reached its bottom? Not necessarily. This is one of the most common misunderstandings among crypto investors.

The Ahr999 indicator has entered its historically recognized bottom-buying zone, bringing renewed attention to Bitcoin's long-term valuation. However, an attractive valuation does not guarantee an immediate price recovery. It tells us that Bitcoin i
post-image
BTC-0.67%
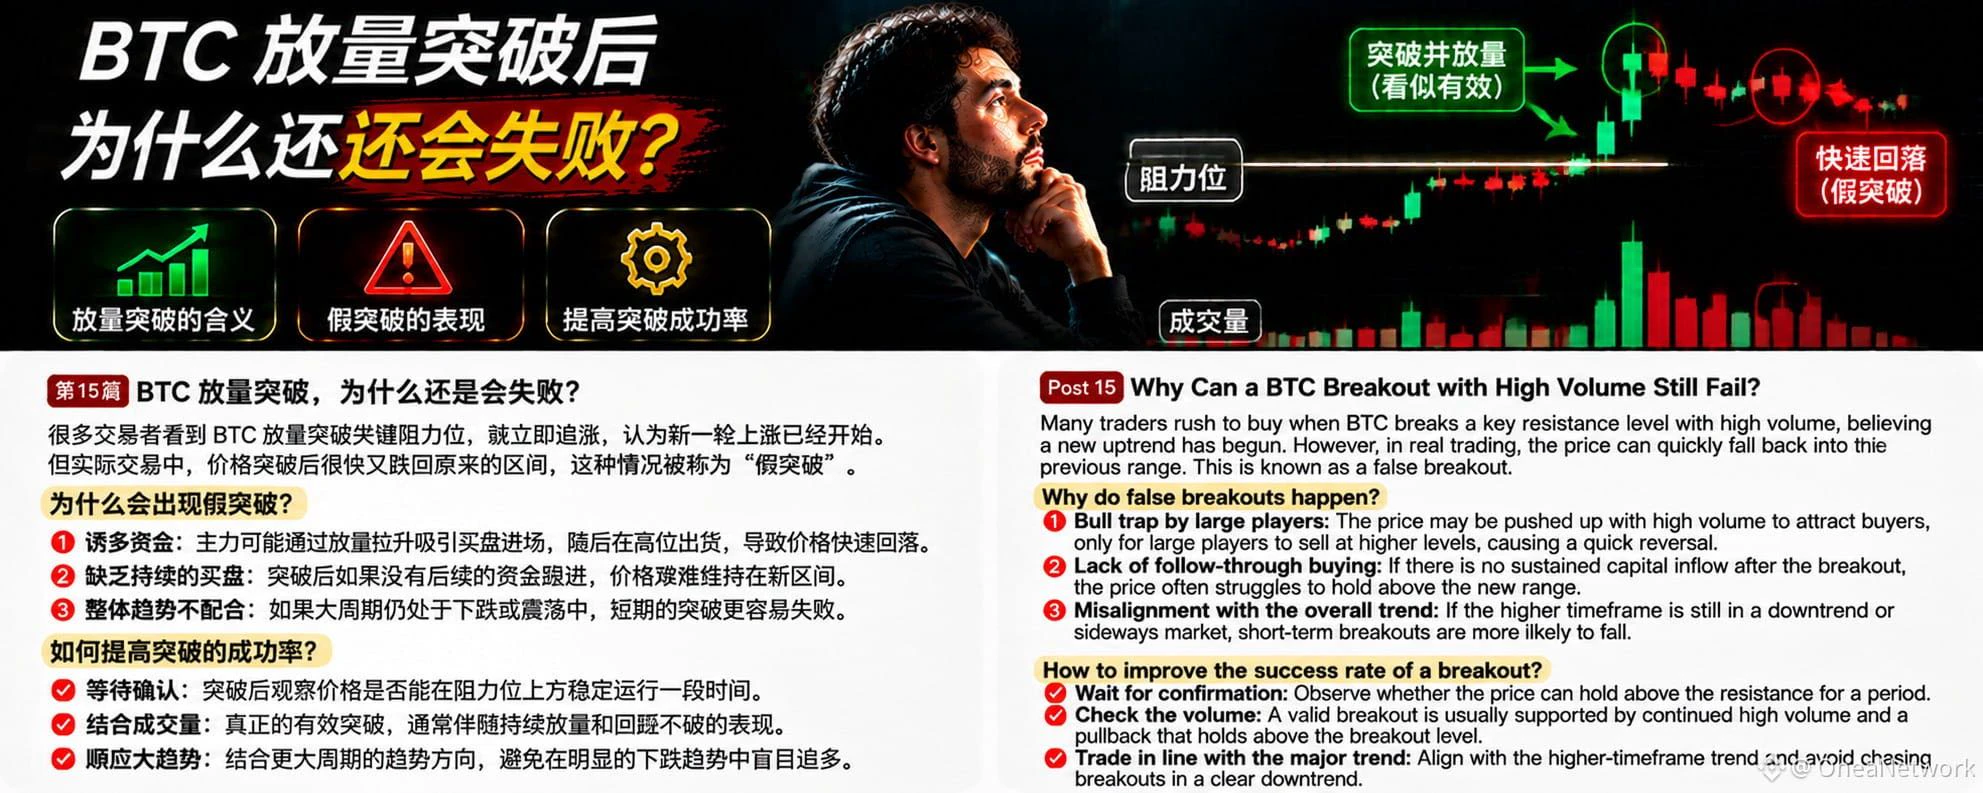
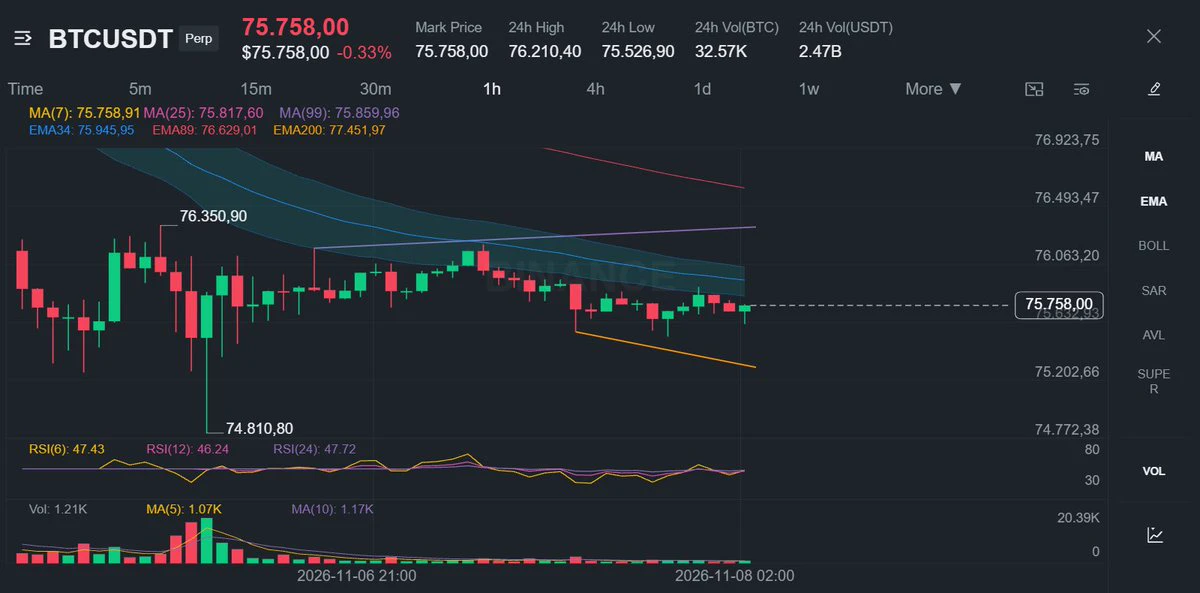
Many traders see BTC break above an important resistance level on high volume and immediately chase the rally, believing a new uptrend has begun. But sometimes, after breaking out, the price quickly falls back into its previous range, catching those who just entered off guard. This is commonly called a false breakout.
Why can a high-volume breakout fail?
First, buying lacks follow-through. A large amount of capital may enter at the moment of the breakout, but if no new buyers follow, it is difficult for the price to hold steadily above resistance.
Second, there is strong selling pressure at th
post-image
BTC-0.67%
BTC | ETH | Gold | Crude Oil
live-cover
LIVE2,730
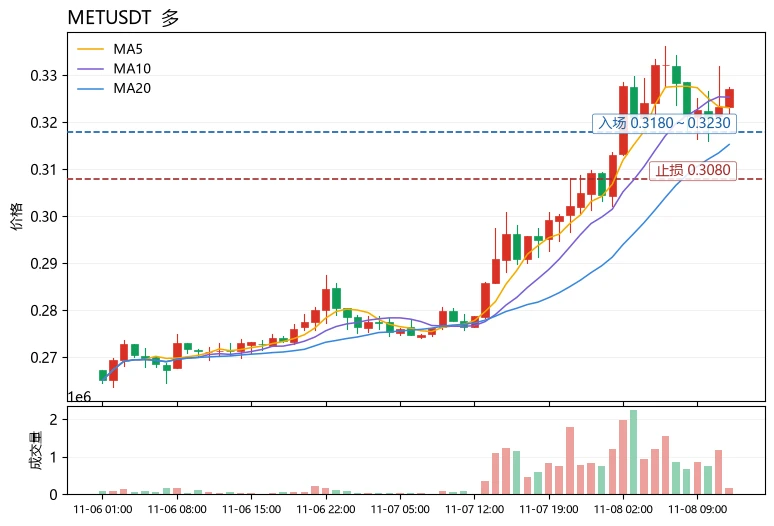
Many people rush to buy the dip when they see negative funding rates, but overlook that relative strength is the source of excess returns. During the same period, $TRX$TRX rose just 1.04%, with a 1.12% range, and its Bollinger Bands were nearly flat—a typical low-volatility sideways market; $UNI $UNI rose 1.94%, with a 5.2% range and an RSI of 55, merely following the rally moderately. Meanwhile, $MET rose 18.20% in 24 hours, with a range of nearly 19%. MA5 crossed above MA20 and the price held above the moving averages, while the RSI of 66.7 had not yet entered overbought territory. Its signi
post-image
UNI+3.05%
MET-0.33%
$DUSK Now aggressively shorting, then buying at $-0.02551; short entry price 0.07062 $DUSK 👇
post-image
DUSK+5.54%
$IRON may come tomorrow
IRON-0.01%
#Ahr999EntersBottomBuyingZone

AHR999 Drops Below 0.45: Bitcoin Enters a Historically Important Bottom-Buying Zone

The Market Has Reached an Important Point

Imagine watching Bitcoin trade around $80,000, then seeing its price move lower while a long-term valuation indicator enters a historically important zone. You might wonder whether the market is approaching a major turning point or simply experiencing another correction.

That is the situation surrounding the AHR999 indicator on November 8, 2026. Its latest reported reading is approximately 0.429, placing Bitcoin inside the historically
post-image
BTC-0.67%
US Adds 165,000 Jobs in October: Why Bitcoin Traders Watch the Fed
The US economy added 165,000 payroll jobs in October while unemployment held at 4.1%, the Bureau of Labor Statistics reported on November 6. The release complicates hopes for rapid monetary easing, but it cannot by itself determine what the Federal Reserve will do next or where Bitcoin will trade.
Bitcoin’s difficult trading week has coincided with a closely watched update on the US economy. The Bureau of Labor Statistics said nonfarm payroll employment increased by 165,000 in October, and the unemployment rate was little chang
post-image
BTC-0.67%
  • 2
Layout: Bitcoin, Ethereum, Dogecoin
live-cover
LIVE880
  • 1
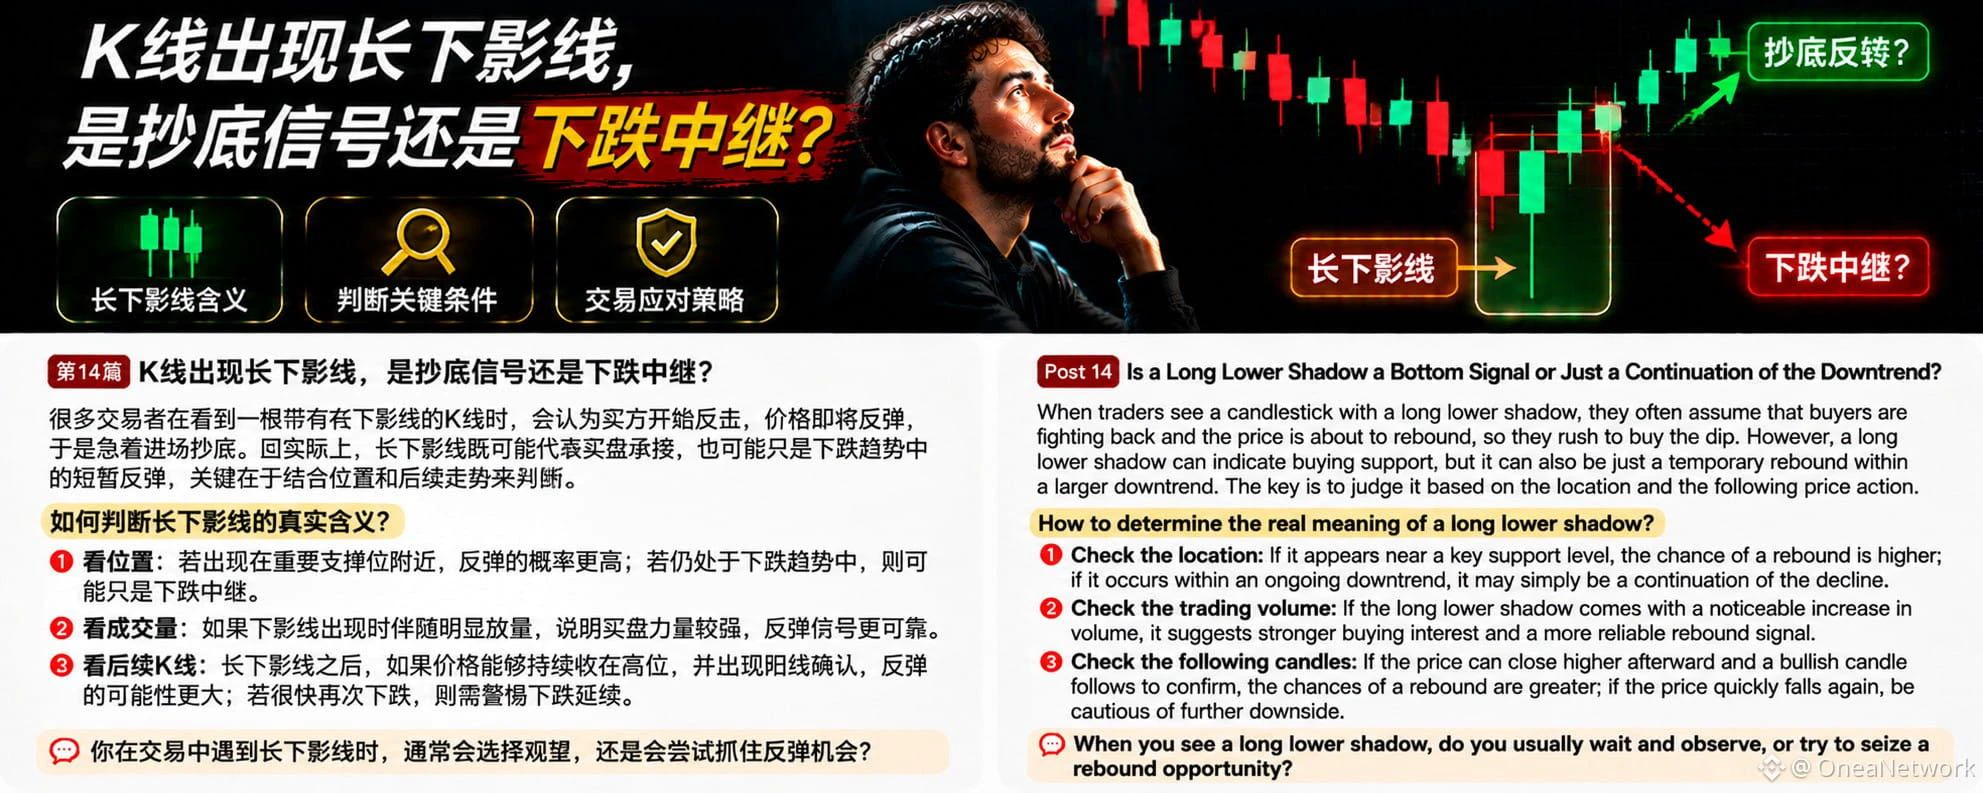
In BTC trading, many people see a candlestick with a long lower wick and assume buyers are starting to fight back and the price is about to rebound, so they rush in to buy the dip. But in reality, a long lower wick does not necessarily mean a trend reversal; it may simply be a brief bounce during a decline.
So, how should you judge?
First, look at where it appears. If a long lower wick forms near an important support level from earlier, it suggests that strong buying may have absorbed selling pressure after the price fell to this area, making the potential rebound a more meaningful signal. But
post-image
BTC-0.67%
Sometimes when the market is as slow as it is, the best move can be to do nothing.
Lessons in patience.
I believe the end of this year will be good for $BTC and $ETH .
post-image
BTC-0.67%
ETH-1.26%
🌐 #FOMO人生 Core Data
🕐 November 8 - 08:00 (Day 51)

✅ Top Holder 1: 702.65 million - Super Prize Pool
✅ Top Holder 2: 208.37 million - Burned to the Black Hole
✅ Top Holder 3: 16.84 million - Iron Army Multisig
✅ Top Holder 4: 10.67 million - Liquidity Pool
✅ Top Holder 5: 7.24 million - Exchange
✅ Top Holder 6: 4.4 million - Offline Promotion Deposit
✅ Top Holder 7: 736k - Butterfly Platform
✅ Iron Army Consensus Holdings: 18.44 million - Untouched

🟠 External Circulation: Only 42.3 million
🔴 Circulating Market Cap: Only $900k
🟣 Total Staked the Previous Day: 48k
🟡 Current Total Staked:
post-image
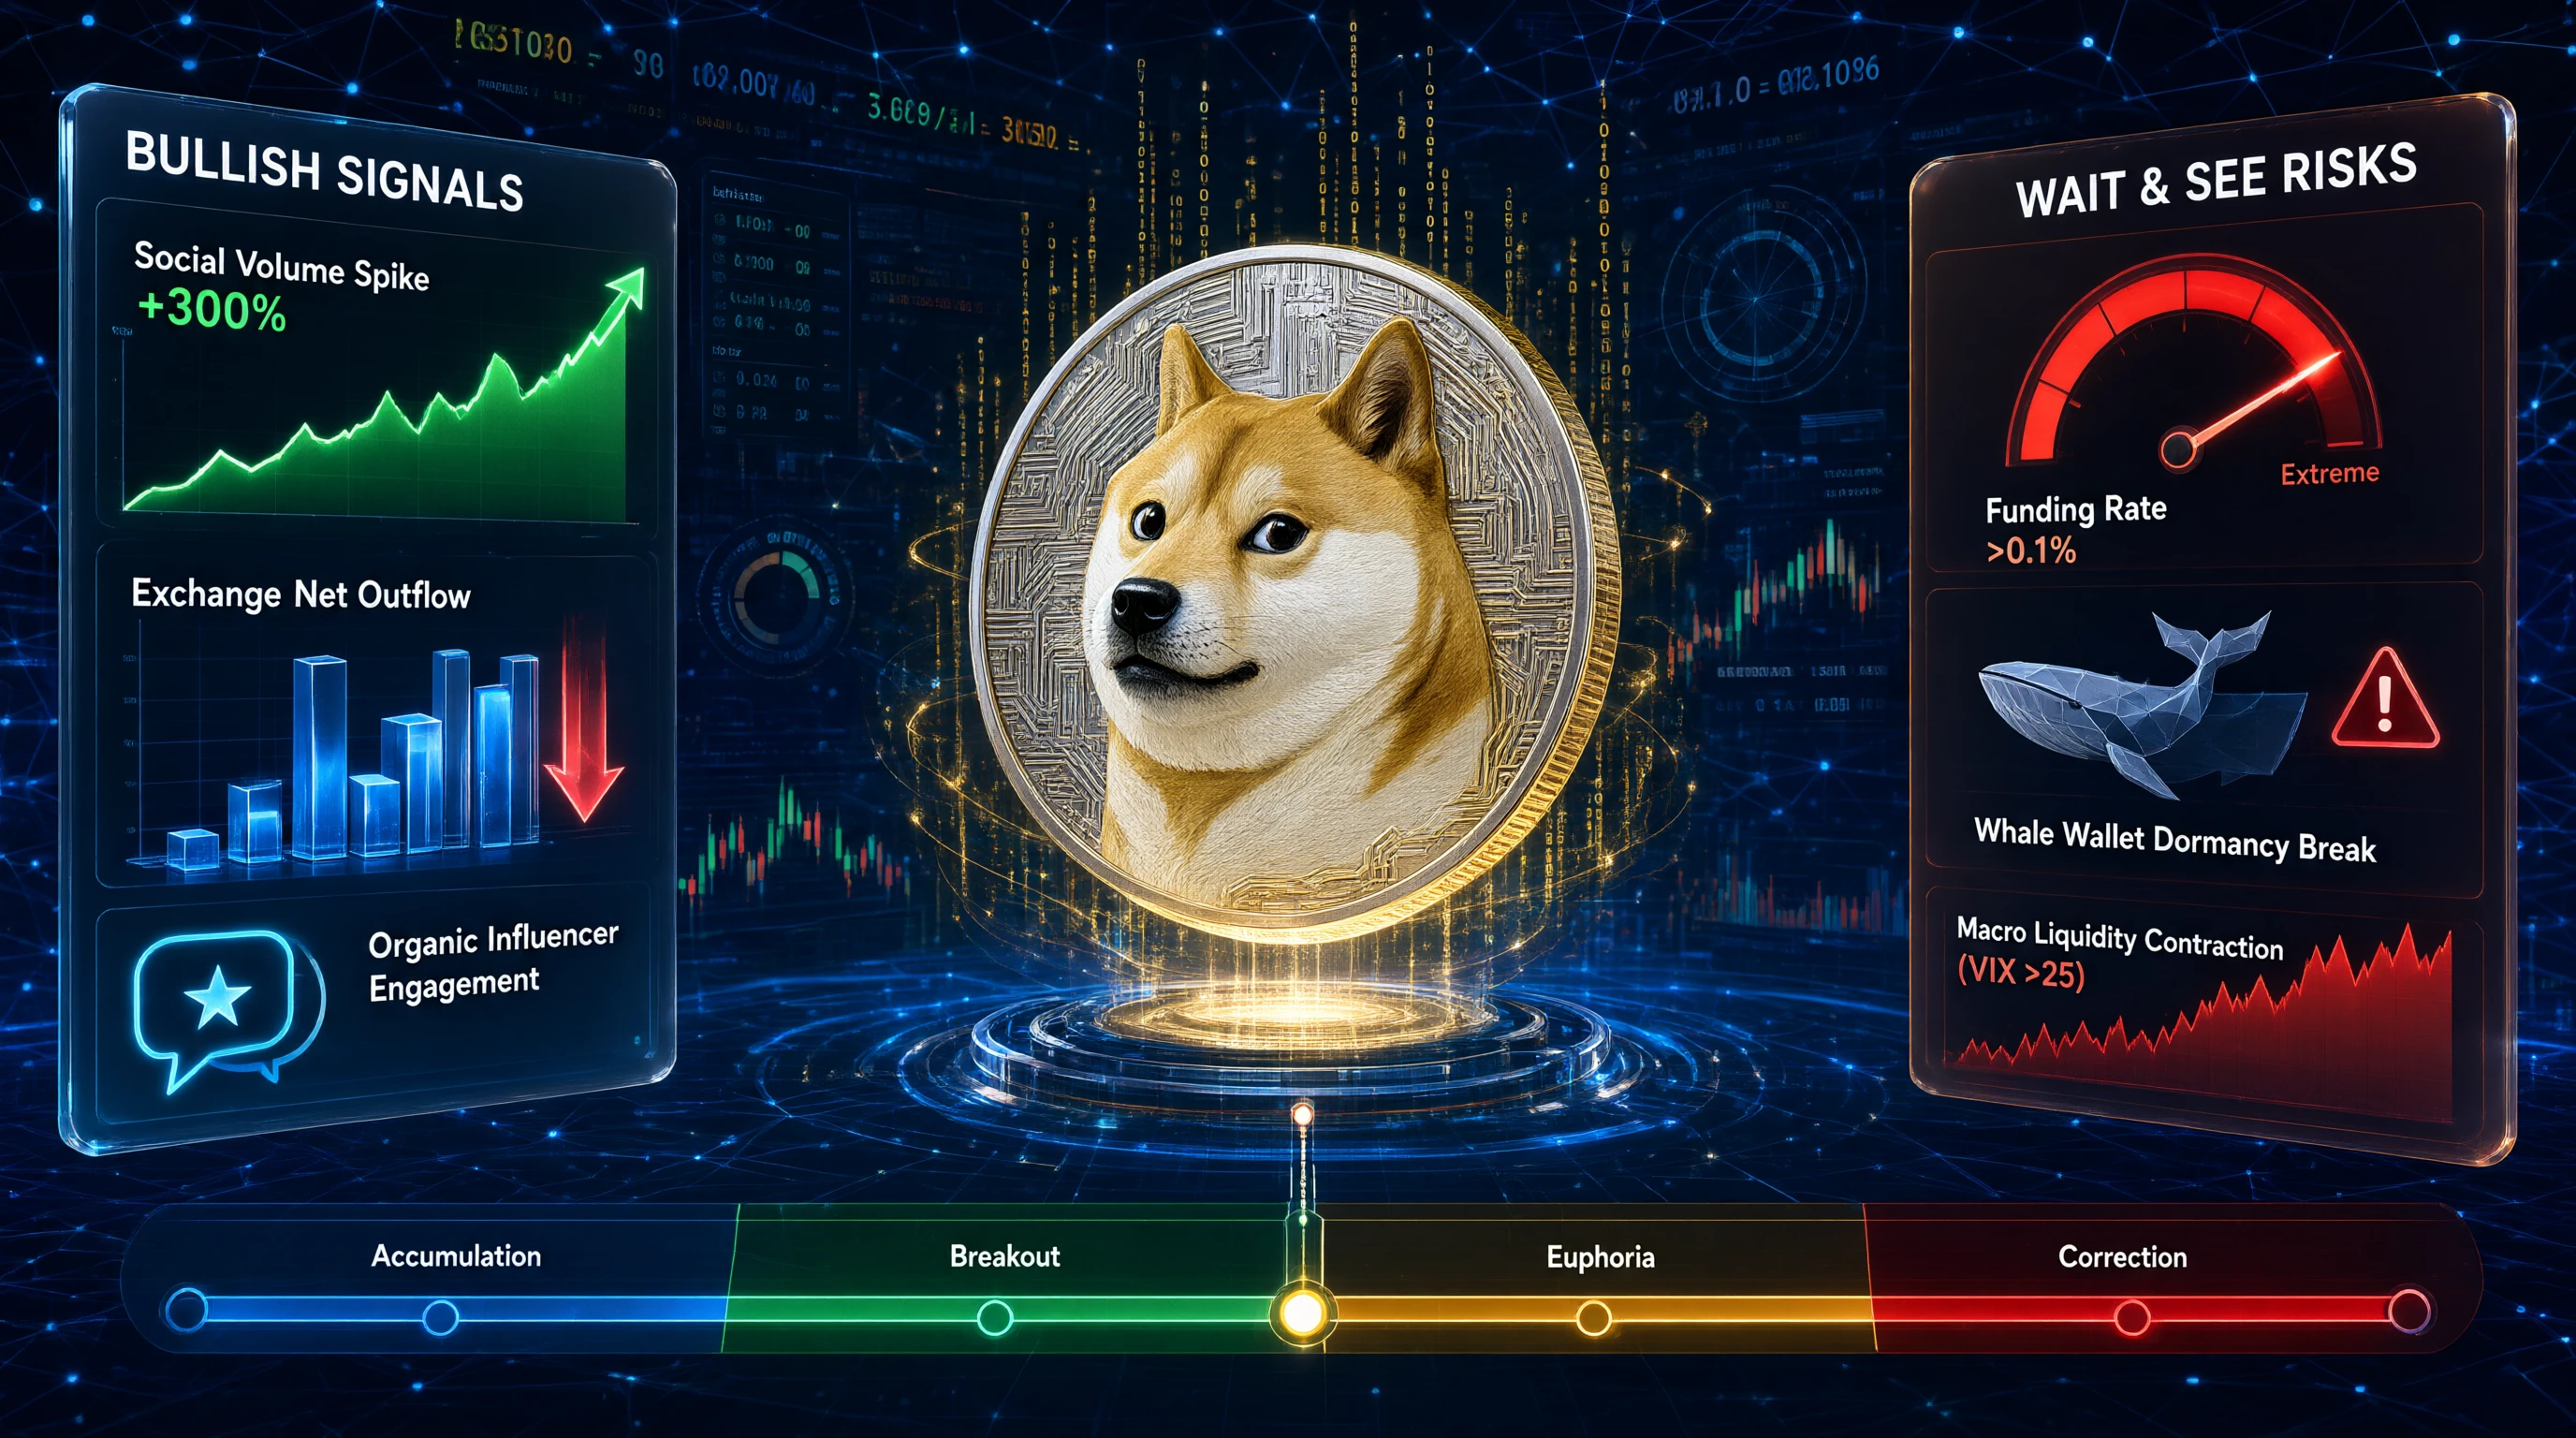
Applying traditional equity analysis to $DOGE is a category error; this asset operates on meme economics, not fundamental valuation.

The question of bullish signals for Dogecoin cannot be answered through discounted cash flow models or balance sheet scrutiny. $DOGE is the world’s most liquid meme asset, and its price discovery mechanism is driven entirely by social sentiment, celebrity influence, and speculative liquidity cycles. Treating it as a company fundamentally misaligns your analytical framework with market reality. Success requires evaluating cultural momentum, on-chain activity patt
post-image
DOGE-0.18%
  • 3
  • 2
165,000 jobs stun markets! Fed December rate hike probability hits 77.7%—rate-cut hopes dashed?

Investors had just gotten ready to pop champagne for a year-end rally when U.S. nonfarm payrolls suddenly poured cold water on things.
The U.S. added 165,000 nonfarm jobs in October, well above market expectations. The strong labor market has renewed concerns that the Fed may continue to maintain its tight policy.
Even more striking, the probability of a December rate hike reportedly rose to 77.7%.
What does this mean? Investors who had been expecting monetary policy to turn dovish may now need to
MU+4.71%
Load More

Join 40 M users in our growing community

⚡️ Join 40 M users in the crypto craze discussion

💬 Engage with your favorite top creators

👍 See what interests you

Trending Topics

USCPIDataIncoming

1.04k Views1.48k Discussing

The U.S. October CPI report will be released on November 10 at 8:30 a.m. ET. September CPI came in at 3.7% year over year, and markets will be watching closely for signs that inflation is cooling, especially in core CPI. A softer-than-expected reading could strengthen rate-cut expectations, while hotter inflation may pressure risk assets through higher Treasury yields and a stronger dollar. How do you think this CPI print will move $BTC, U.S. stocks and gold?

USAIStocksHitHard

23.56k Views3.69k Discussing

USNonfarmPayrolls

40.34k Views4.38k Discussing

View More