
Square
Following
Hot
News
Notifications
Profile
Share your thoughts
placeholder
Article
market prices updates
live-cover
LIVE994
$EVAA Keep buying the dip: the market cap is only tens of millions, while futures open interest has already nearly topped $90 million. Clearly, money is flowing in; a 2x is no problem. 👇🏻👇🏻👇🏻
post-image
EVAA-0.49%
Trenches
mihao
m
bade
b
mihao
4Cxj...pump
Market Cap
$.
Change
.
24h Vol
$.
Holders
.
Snoopy
S
bade
b
Snoopy
7mEh...47Cn
Market Cap
$.
Change
.
24h Vol
$.
Holders
.
AGT
A
bade
b
AGT
0x5d...e274
Market Cap
$.
Change
.
24h Vol
$.
Holders
.
PIEVERSE
P
bade
b
PIEVERSE
0x0e...25a9
Market Cap
$.
Change
.
24h Vol
$.
Holders
.
IDOL
I
bade
b
IDOL
0x3b...ab07
Market Cap
$.
Change
.
24h Vol
$.
Holders
.
$645,000,000 worth of crypto longs liquidated in the past 30 minutes.
post-image
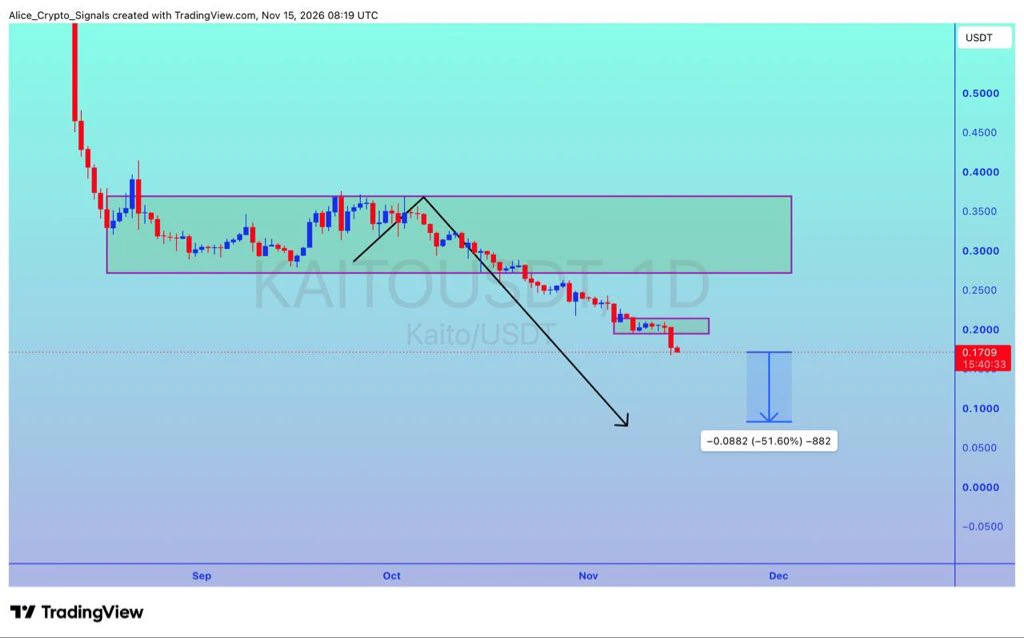
$KAITO
UPDATE
#KAITO already breakout done. We can see 50%+ drop here ✍🏻
post-image
KAITO-0.96%
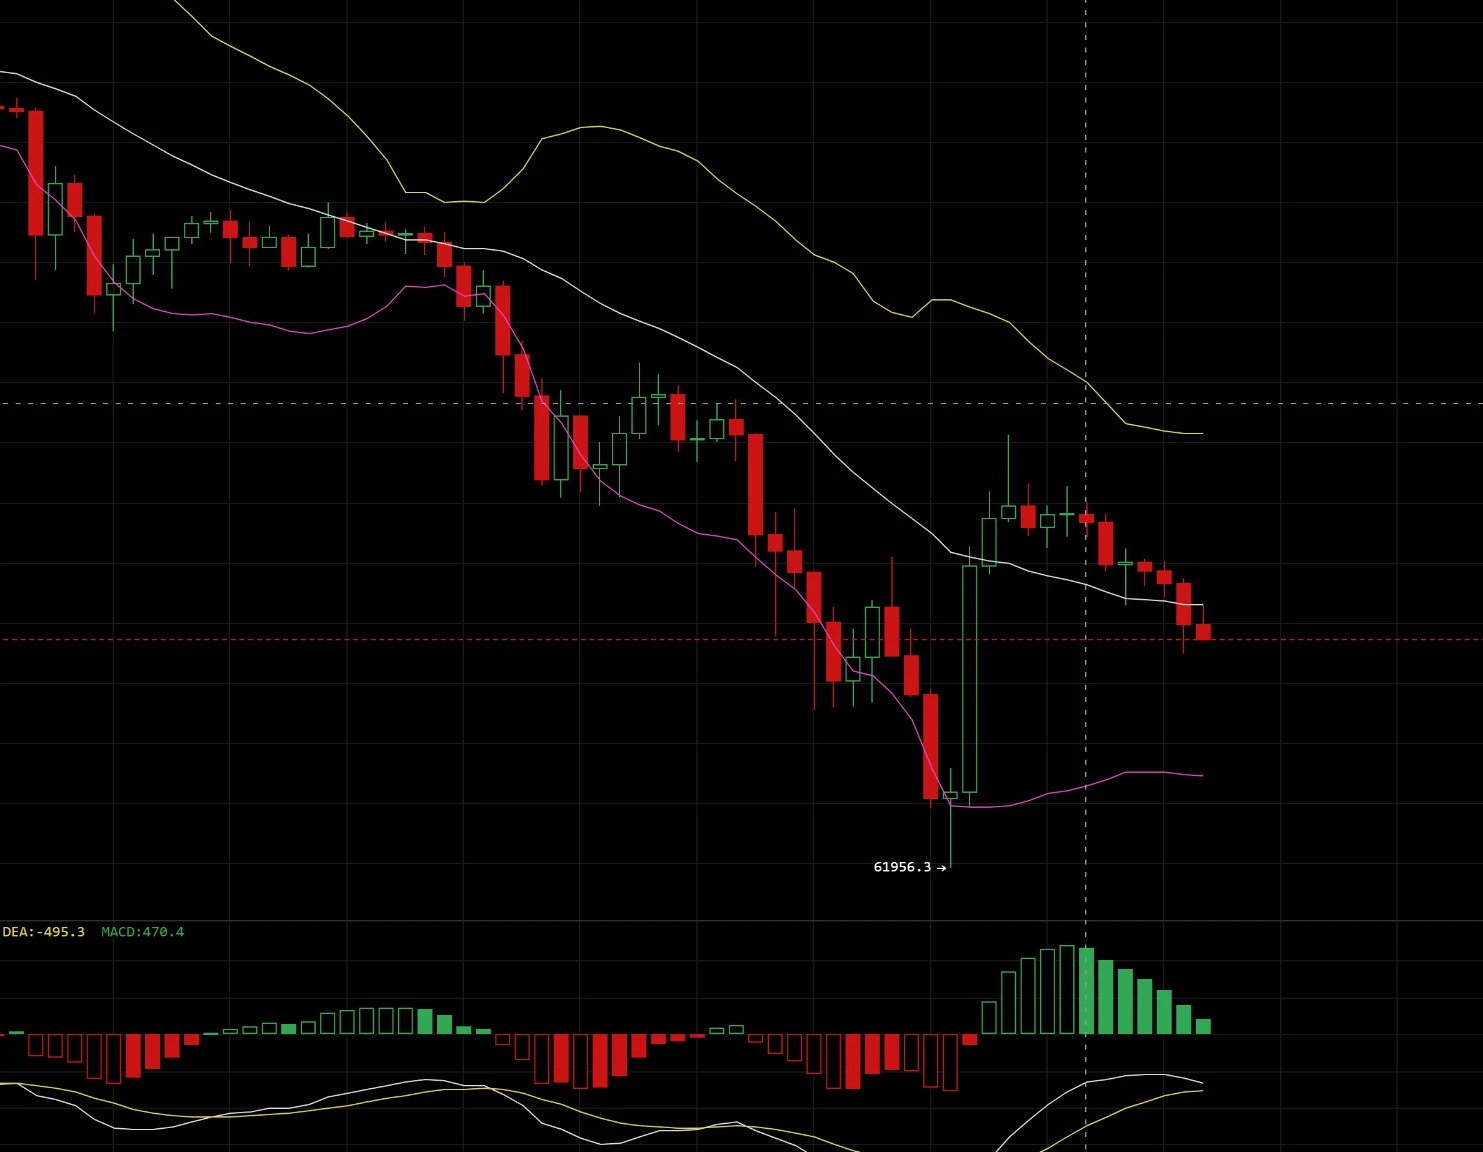
11.15 BTC Trade Setup

The current BTC cycle is in a downtrend dominated by bears, with the Bollinger Bands opening downward. After rebounding from the 61956 low, the price has moved near the middle band and encountered resistance. Rebound momentum is weak, and the bearish structure remains unchanged. Key resistance is at 64200 (the middle band) and in the 65200–65600 range (the upper band and a previous high-volume resistance zone). The first support is in the 63000–63100 range (near the lower band), with strong support at the previous low of 61956. The overall trend is bearish, and the price
post-image
BTC-0.65%
Media reported that the spot price of aluminum on the London Metal Exchange (LME) briefly reached a premium of $147 per ton over three-month futures, its highest level in more than 30 years. LME warehouse stocks fell to their lowest level since 1990, while the spot premium structure (backwardation) reached its most severe level since the late 1980s. Exchange data show that as of Monday, long positions held by two trading entities in warehouse warrants and spot contracts accounted for 60% to 80% of available stocks in the LME warehousing network, further exacerbating supply concentration concer
GM Everyone
Whether the market moves or not, we keep pushing forward.
post-image
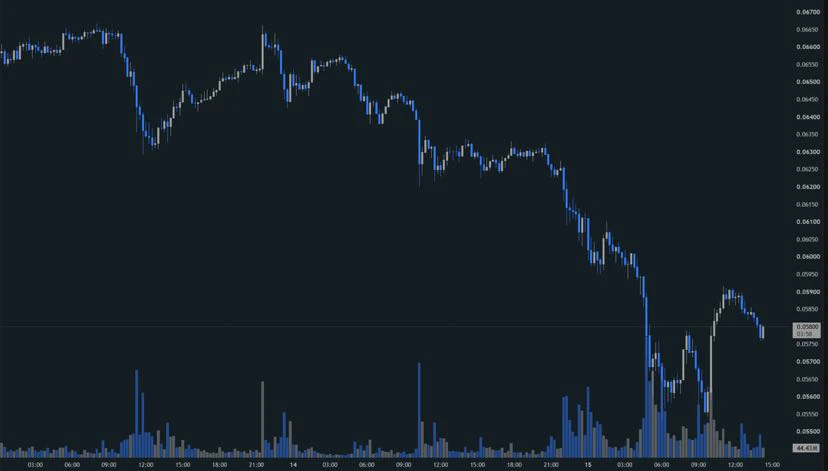
$DOGE has once again been among the hardest hit as the broader market falls……

It dropped nearly 9% over the past 24 hours, briefly touching around 0.0554 at its low, significantly underperforming BTC and ETH and falling straight below this year's June low!

When prices rise, DOGE can often deliver strong upside momentum on sentiment and capital inflows, but when the market deleverages across the board, that same volatility can also amplify losses

Looking at the 4H chart, consecutive bearish candles drove the price down, with almost no meaningful rebound structure forming along the way. It w
post-image
DOGE-0.22%
  • 2
CASH CAT USDT MARKET UPDATE PREDICTION
live-cover
LIVE1,878
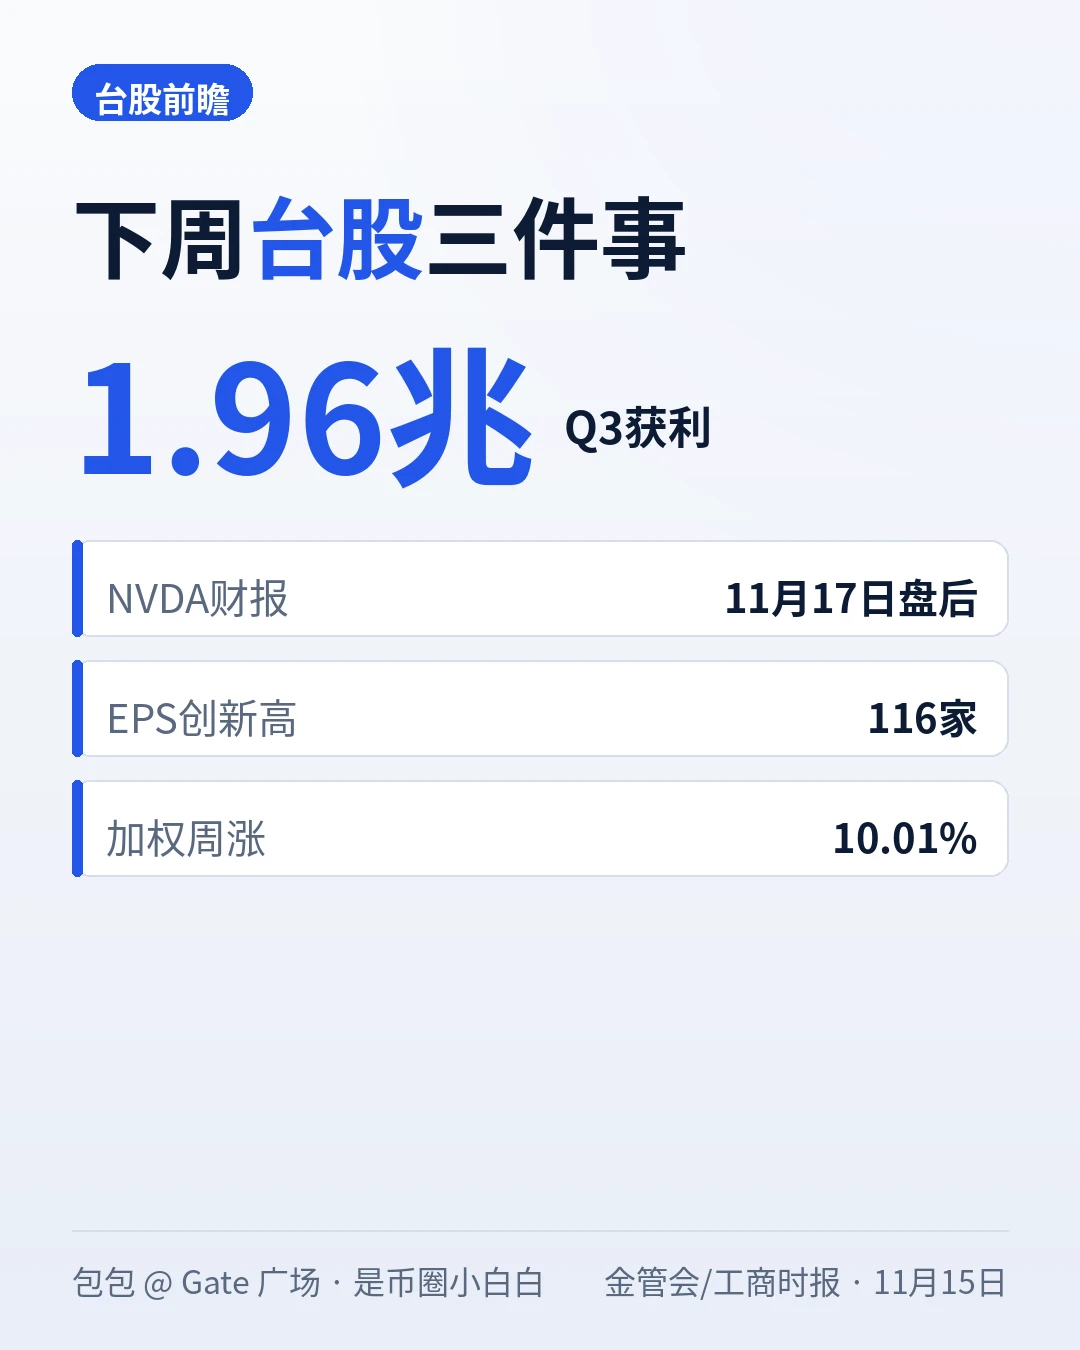
Q3 net profit hit 1.96 trillion, up 74.5% year over year, with 116 companies posting record EPS—the Taiwan stock market’s 10% gain over the past week had earnings to support it. #Gate上线台股交易

First, a check on the 12:00 call: At noon, I said “Taiwan stocks will take their cue from U.S. chip stocks,” leaving Monday’s open and TSMC’s ADR as an open question. U.S. markets were closed over the weekend, and the ADR stayed unchanged at Friday’s close of $398.73, so that part of the equation still doesn’t add up over the weekend—but a new variable emerged: the Financial Supervisory Commission announc
post-image
TSM-1.70%
NVDA-1.92%
OPENAI-0.04%
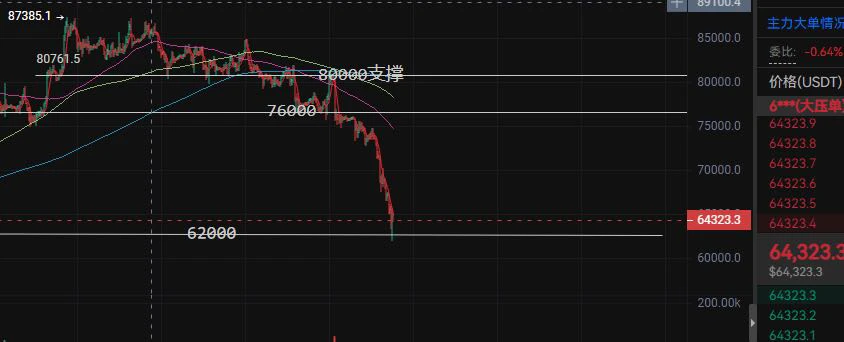
What the hell is this? Is this still value investing in Bitcoin? Where the hell have I ended up?

The 80,000 support level I identified on October 24 broke just like that—that's one thing.
The upward trendline at 76,000 was gone in a week too.

In just 10 days, I got dragged from 76,000 down to 62,000, the bull-bear dividing line.
Are we still in China? Is there anyone keeping tabs on the crypto narrative?

I previously said 70,000–68,000 was a good range for a long-term, low-leverage long, then got stopped out after losing 2,000 points and made a fool of myself.

Now I'm telling you again: ta
post-image
BTC-0.67%
  • 1
#ETH #ShareWeekly #WCTCS9
Ethereum (ETH) Full Market Breakdown – November 15, 2026

Ethereum is trading near the $1,790–$1,810 area after continued pressure. Recent quotes place it around $1,791 to $1,808, with 24-hour declines of roughly –5.5% to –6%. Market capitalization remains second only to Bitcoin. Volume has stayed elevated during the sell-off, reflecting both forced liquidations and ongoing institutional activity.

Recent Performance and Percentage Moves
Over the past 7 days ETH has dropped approximately –10% to –12%, falling from levels near $2,050–$2,160 into the high $1,700s and
ETH-1.26%
BTC-0.67%
  • 2
$EVAA All targets met, and another bold, successful trade is complete at $2.30—another quick, profitable trade
post-image
EVAA-0.49%
$BTC After a sharp drop, price bounced back—and liquidation zones above and below have lit up! BTC quickly rebounded from around 62,000. Around 66,700 above, shorts face a test! Around 61,600 below, leveraged positions are still clustered. Whether this rally can continue depends on how far the rebound can go! Our 24-hour liquidation heatmap shows BTC quickly recovering to around 65,000 after dipping near $62,000. The selected points on the chart show estimated liquidation leverage of about $63.86 million around $66,691 and about $32.14 million around $61,571. Both are potential liquidation zon
post-image
ZEC+1.16%
$BTC Still trading sideways, while the altcoin rotation has already begun. There’s not much to say about this market. When capital shifts from major coins to small caps, the first to move is never the one making the most noise. The hardest part of trading isn’t calling the direction—it’s waiting for a signal you can understand. As the spotlight shifts to altcoins, follow along only if the timing lines up; otherwise, just watch from the sidelines. We’ll check the results over the weekend and compare notes then. #altcoin Keep an eye on what I’m watching.
post-image
BTC-0.67%
  • 1
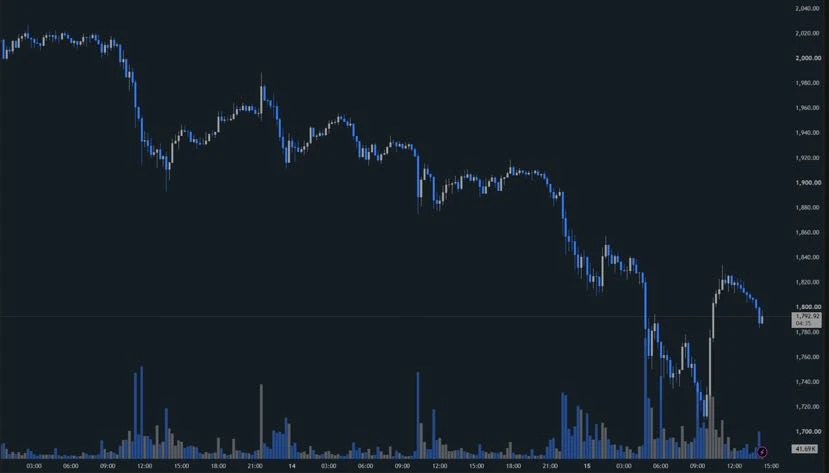
$ETH This sell-off is getting pretty ugly😥

Over the weekend, BTC continued to slide, hitting a low near $1,710, down more than 6% on the day

But I’m more focused on the ETH/BTC exchange rate:

A few days ago, although ETH fell alongside the market, its exchange rate remained fairly resilient, showing some signs of relative strength; but in this latest sell-off, ETH fell significantly more than BTC, and the exchange rate came under renewed pressure

Looking at the candlestick chart, the 4-hour timeframe has seen a series of large bearish candles. Although it rebounded quickly from the low th
post-image
ETH-1.26%
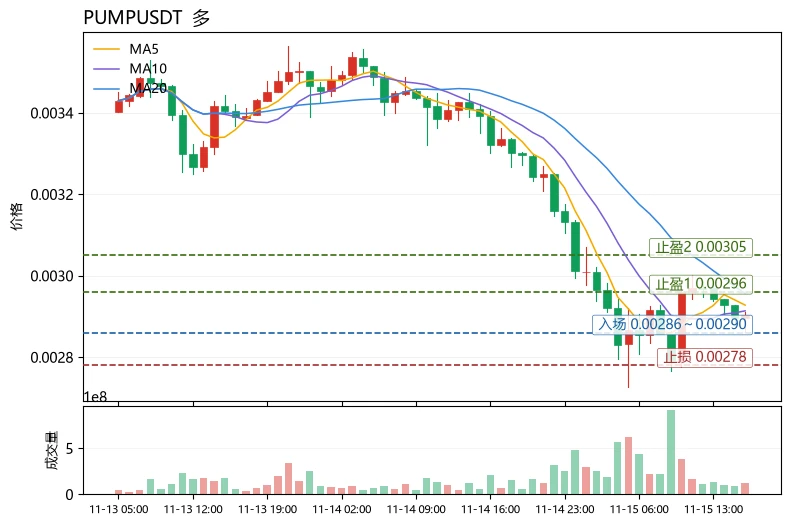
The Fear & Greed Index has fallen to 10, in the extreme fear zone. On the 24-hour leaderboard, $PUMP is at 0.002901, down 12.99%, with 19.2M USDT in trading volume; $PEPE is down 8.66%, and $AVAX is down 11.33%. Altcoins are seeing similar outflows. Weakness in the broader BTC market is weighing on small-cap, high-volatility coins, but $PUMP’s MACD histogram has turned positive (+1.556e-05), its RSI is just 36.5, and its price is near the lower Bollinger Band at 0.00273558. This is a technical divergence setup following oversold conditions. The funding rate remains positive at 0.0029%, long
post-image
PUMP-1.06%
PEPE+0.97%
AVAX-0.10%
BTC hits $67K: Bloomberg analyst shares notable take
Bitcoin’s ETF outflows total about $1.4 billion this year. Bloomberg’s Eric Balchunas says that’s limited, with support near $60,000.
Bitcoin fell back toward the $67,000 zone, pulling sentiment down with it as capital also exited spot Bitcoin ETFs. However, Eric Balchunas, ETF specialist at Bloomberg Intelligence, views the current outflows as relatively contained.
⚠️ Personal market analysis only. NFA — manage risk and DYOR.
Educational content, not investment advice or a recommendation to buy, sell, deposit, or withdraw any asset. No paid
post-image
BTC-3.45%
Load More

Join 40 M users in our growing community

⚡️ Join 40 M users in the crypto craze discussion

💬 Engage with your favorite top creators

👍 See what interests you

Trending Topics

GateIPOAccessAnthropic

345.1K Views2.7K Discussing

Gate IPO Access Phase 3 features Anthropic (ANT), with USDT subscription interest starting from 100 USDT. Successful allocations will be delivered as real shares to Gate Stock Accounts. Indicative price: $70–$78/share Subscription: Nov 12–17 (UTC+8) Allocation is not guaranteed. Please manage risk accordingly.

Dr.HanOxfordUnionSpeech

151K Views510 Discussing

USOctoberPPIBelowExpectations

479.7K Views1.4K Discussing

View More