Square
Following
Hot
News
Profile
Share your thoughts
placeholder
Article
BTC MARKET UPDATE
live-cover
LIVE641
$Anyone here like hairy crabs
post-image
Trenches
AGT
A
bade
b
AGT
0x5d...e274
Market Cap
$.
Change
.
24h Vol
$.
Holders
.
CNPY
C
bade
b
CNPY
0xc6...ddd2
Market Cap
$.
Change
.
24h Vol
$.
Holders
.
Q
Q
bade
b
Q
0xc0...0589
Market Cap
$.
Change
.
24h Vol
$.
Holders
.
Gato
G
bade
b
Gato
55A3...pump
Market Cap
$.
Change
.
24h Vol
$.
Holders
.
TSI
T
bade
b
TSI
AcV6...pump
Market Cap
$.
Change
.
24h Vol
$.
Holders
.
#USSeptemberPPIBeatsExpectations
eptember PPI Beats Expectations 🇺🇸📊
The latest US Producer Price Index (PPI) data for September is an important development for financial markets, especially for Bitcoin, Ethereum, altcoins, the US dollar, and Federal Reserve policy expectations.
When producer inflation comes in higher than economists expect, it can signal that businesses are facing increased costs, potentially putting additional pressure on consumer prices. This may make the Federal Reserve more cautious about cutting interest rates. However, the actual market impact depends on the reporte
Geopolitics
Will Russia capture Oleksiievo-Druzhkivka by...?
March 31, 2027
19%5.26x
December 31
10%10.00x
$9.84K 24H+1 more
BTC+0.36%
ETH-0.28%
🔥 $HBAR
After rebounding from recent lows, bullish rebound signs have emerged! Buyers entered near the $0.082 support zone, pushing the price back up to around $0.087. If bullish momentum continues and resistance is broken, HBAR could continue to rebound to higher levels. 🚀Take Profit: 0.11572Stop Loss: 0.08125Go Long $HBAR 👇
post-image
HBAR+2.01%
Can stablecoins also have a directional bias? Bottom line: yes, but only for mean reversion within an extremely narrow range, and $U currently has a clear edge in relative sideways strength.
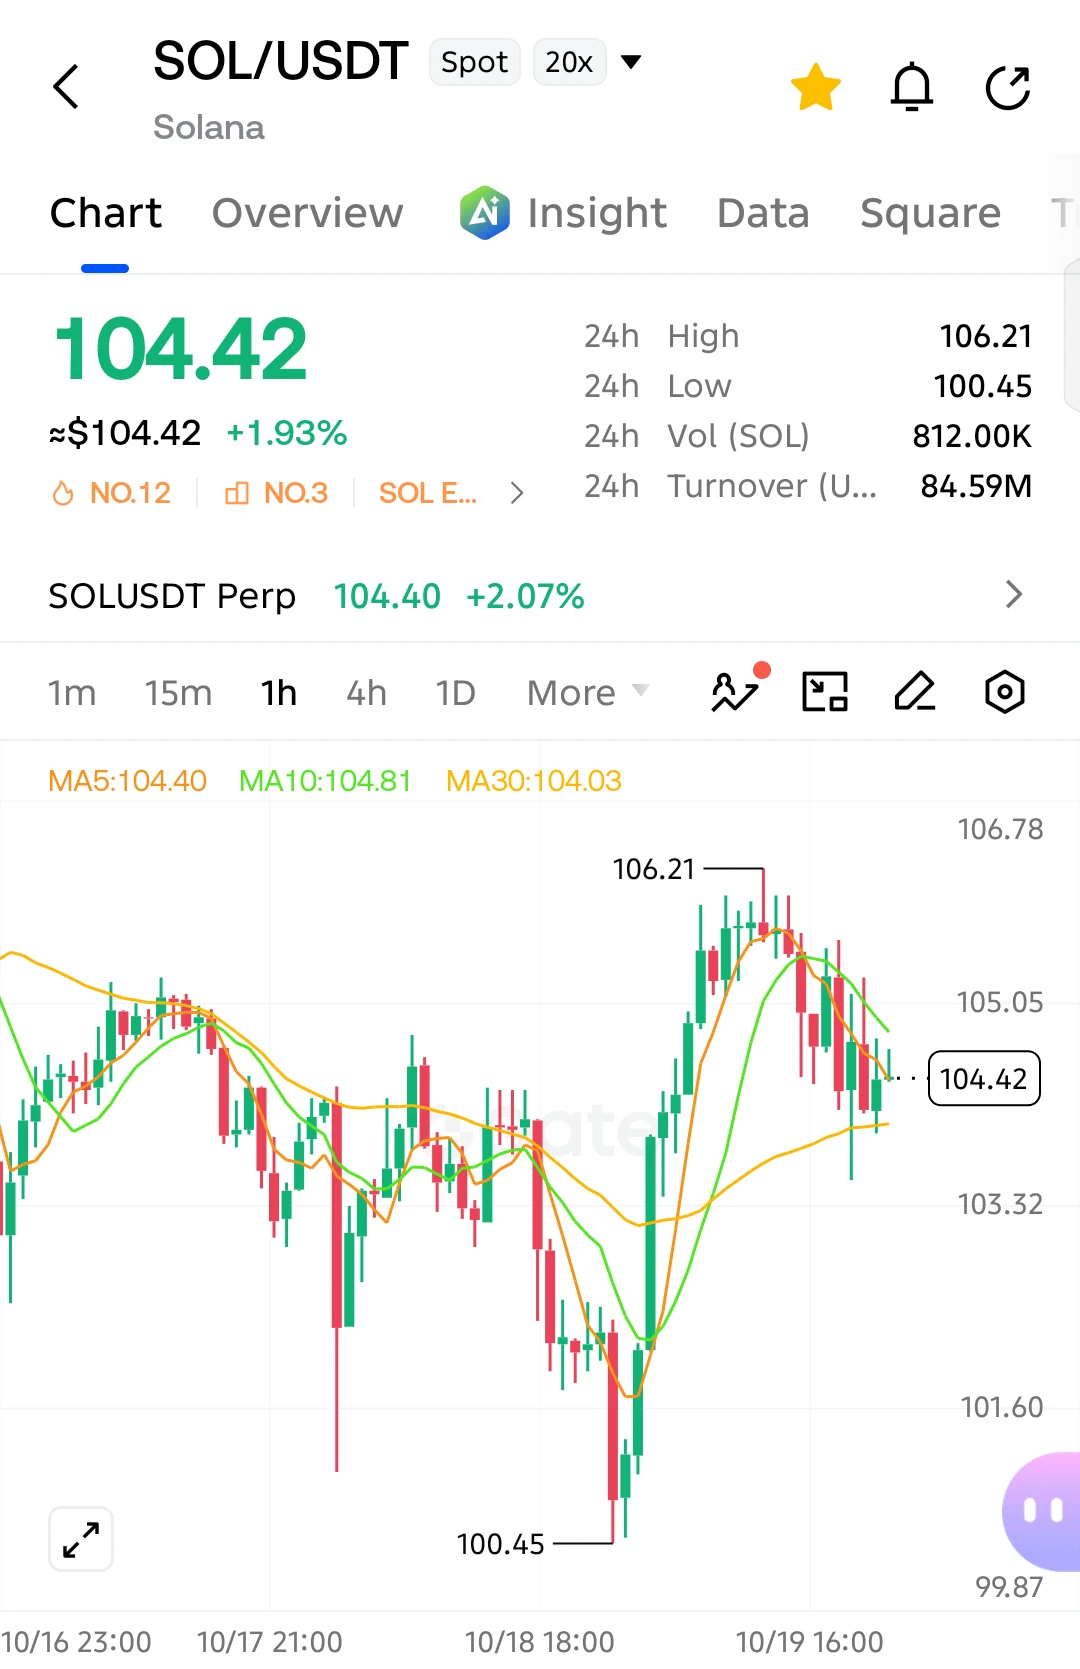
Sector comparison: $SOL is trading at 103.48, with MA5 below MA20, RSI at 44.7, bearish MACD, a funding rate of -0.0022%, and a range of about 3.89% over 30 candles; $APT is trading at 0.7936, down 5.56% over 24h, with RSI at just 37.2, bearish MACD, and a range of about 10.99%. Both are below their moving averages, with weak momentum. By contrast, $U is trading at 1.0007, with MA5=1.00064 above MA20=1.
post-image
SOL-0.40%
APT-5.51%
  • 3
🌐 ONEA NETWORK—Technology should adapt to people’s lives.
The best technology isn’t necessarily the technology with the most features.
It’s technology that makes everyday life simpler.
Consider digital payments today. Users may need to switch between different apps, manage multiple wallets, understand transaction fees, and navigate unfamiliar processes.
Technology is advancing quickly, but the user experience can still be complicated.
⚡ The next step is to make the experience simple.
Imagine digital services that are easier to use, transactions that no longer require so many unnecessary steps
post-image
#BTC跌破8.2万 Technical read at $81,668: what the chart says about 81K and 80K
BTC is trading near $81,668, and the question on everyone's screen is whether 81K can hold or 80K gets tested next. Here is the technical picture, level by level, with no guesswork.
Where we came from
Early October looked bullish. BTC ran toward $87,000, then was rejected near that level on October 5, which triggered a cascade of leveraged long liquidations. The week's high was $84,323.70 on October 12, and the low was $79,841.60 on October 15, right after the hot CPI (3.7% year over year, core 2.6%). That is a 5.6% we
post-image
Falcon_Official
#BTC跌破8.2万 Bitcoin at $81,570: Has the CPI Shock Been Priced In, or Is $80,000 the Next Test?
Bitcoin’s move below $82,000 has shifted the market’s focus from the possibility of a $90,000 rally to the strength of the current support structure. Trading near $81,570, BTC is facing a combination of renewed US inflation pressure, changing Federal Reserve expectations, and uncertainty over leveraged positioning. The critical distinction is whether the market has already absorbed the inflation shock or whether another round of selling could follow.
September CPI Changed the Macro Picture
The US Bureau of Labor Statistics reported that headline CPI increased 3.7% year over year in September, accelerating from 3.4% in August. Monthly inflation reached 0.6%, compared with 0.4% previously. Core CPI, excluding food and energy, rose 2.6% annually and 0.3% monthly.
Energy was a major contributor. Gasoline prices climbed 9.1% in September, accounting for more than half of the monthly increase in headline CPI. The energy index advanced 5.2% during the month, while shelter costs increased 0.4%.
These figures complicate the outlook for monetary easing. Persistent inflation can keep interest rates restrictive for longer, potentially supporting the dollar and Treasury yields while reducing investors’ appetite for risk-sensitive assets.
However, the inflation report does not automatically guarantee another rate hike. The Fed must evaluate incoming economic data, employment conditions, and the persistence of price pressures before determining its next move.
Why BTC Fell Below $82,000
Bitcoin’s decline reflects the sensitivity of crypto valuations to macroeconomic expectations. When inflation exceeds forecasts, markets may reassess the timing of rate cuts or the possibility of further tightening. Higher expected borrowing costs can make speculative positions less attractive, particularly when leverage is elevated.
Market reporting following the CPI release showed Bitcoin falling to approximately $80,247 before trading around $80,743 in the subsequent session. BTC has since approached the $81,570 level referenced here, but a recovery from the lows alone does not confirm a trend reversal.
The key question is whether buyers are returning through sustained spot demand or whether the rebound is primarily driven by short covering. These two scenarios can produce similar price action initially but have different implications for durability.
The $81,000–$80,000 Support Test
At approximately $81,570, Bitcoin is close to an important psychological area. The $81,000 region deserves attention as a near-term reference, while $80,000 is the next major round-number level traders may monitor if selling pressure resumes.
A sustained recovery above $82,000, supported by stronger spot volume and improving market breadth, would help repair the short-term structure. If BTC repeatedly fails to reclaim that level, sellers may retain control and the market could revisit lower support.
A break below $80,000 would increase downside risk, but it would not automatically establish a prolonged bearish trend. Confirmation would require examining subsequent price acceptance, trading volume, and whether buyers defend the breakdown area.
These levels are technical reference points, not guaranteed turning points.
Liquidations and Leverage: The Hidden Risk
During sharp declines, leveraged long positions can face liquidation as collateral becomes insufficient. Forced selling can amplify downward momentum, creating a feedback loop in which falling prices trigger further position closures.
Open interest helps distinguish between different forms of selling pressure. If BTC declines while open interest contracts sharply, traders may be closing positions or being liquidated. If open interest rises during the decline, new positions may be entering the market, although the direction of those positions cannot be established from open interest alone.
Funding rates provide additional context. Persistently positive funding during weakening price action may indicate that long exposure remains crowded. A reduction in funding and leverage could help stabilize market conditions, but it would not independently confirm a bottom.
Is the CPI Shock Already Priced In?
Markets often react to the difference between expectations and actual data, not simply to whether a headline looks positive or negative. Some of the inflation risk may already be reflected in Bitcoin’s decline, but that cannot be established from price alone.
If Treasury yields stabilize, the dollar loses momentum, and BTC reclaims $82,000 with credible spot demand, the market could begin recovering from the initial shock. If inflation concerns intensify and leveraged positions continue unwinding, $80,000 may come into focus instead.
The most important signal is confirmation across macroeconomic conditions, spot activity, and derivatives positioning.
At $81,570, Bitcoin is at a decision point rather than a confirmed bottom. Preserving capital, controlling leverage, and waiting for price confirmation are more defensible approaches than assuming either an immediate rebound or an inevitable breakdown.
repost-content-media
BTC+0.36%
Don't fall into the trap of self-justification,
Regularly ask yourself about your core position: if you didn't hold it today, knowing the information in front of you, would you still be willing to buy it?
post-image
Remember...
$SUI is being built for humans.
It's being built for the AI Agent wave that's STILL coming.
post-image
SUI-2.16%
A Bitcoin whale dormant for 12 to 13 years suddenly awakens, transferring 416.69 BTC for an unrealized profit of about $33.71 million!
On October 18, two long-dormant wallets transferred BTC worth about $33.82 million to the same address. These assets were originally worth about $105,400, representing an astonishing gain over more than a decade.
But a whale transfer doesn’t necessarily mean a sell-off. What’s really worth watching is where the funds go next: a transfer to a private wallet may not affect the market, while funds flowing to an exchange could signal potential selling pressure.
The
post-image
BTC+0.36%
A Brief Analysis of BTC’s Short-Term Trend Based on Dow Theory, Chan Theory, Elliott Wave Theory, Volume-Price Relationships, Order Flow, and Price Action (Strategy Recommendations)
Comprehensive Assessment
Dow Theory shows a converging triangle, with lows rising four times against capped highs
Chan Theory shows four rising bottom fractals + price testing the upper edge of a micro-range
Elliott Wave Theory: at the end of a contracting triangle; an upside breakout projects to 84,400+ based on a 55% measured move
Volume-price relationship: record-low volume + positive Delta + signs of accumulati
BTC+0.36%
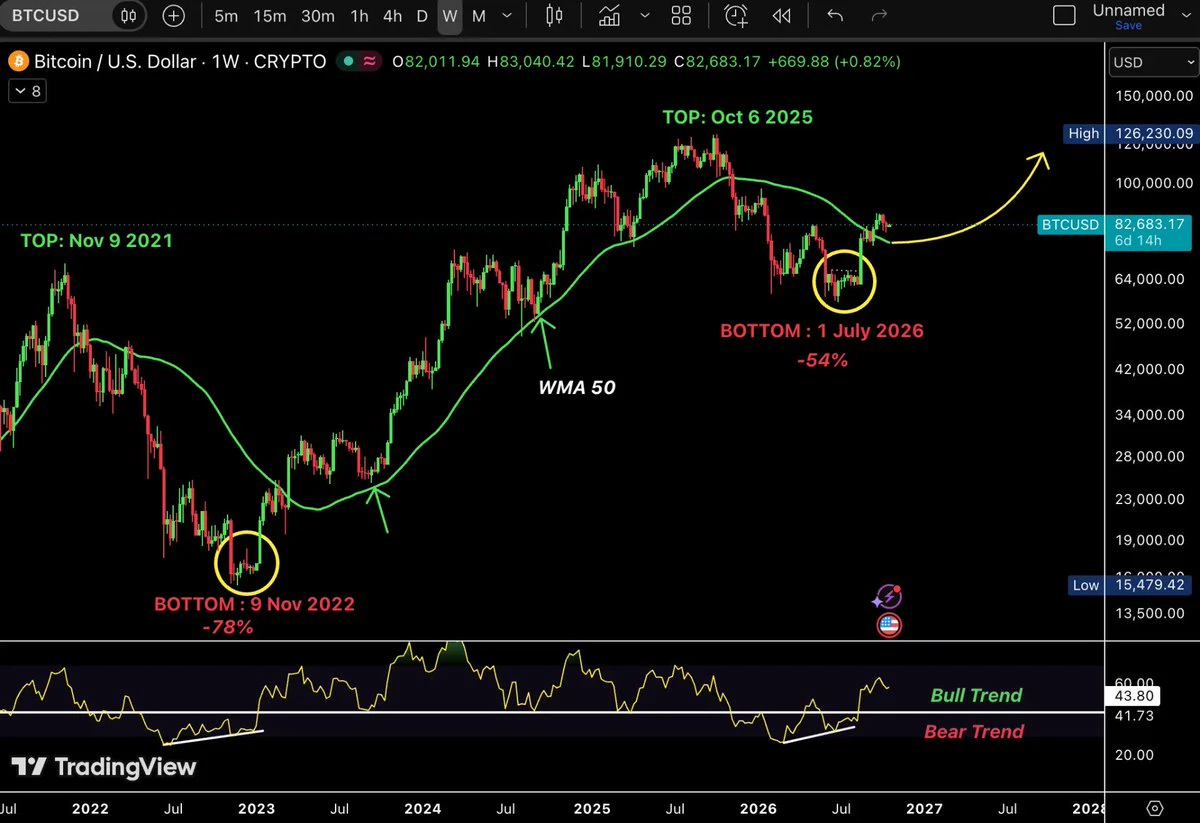
A major rally is imminent—hold tight to the wheel#btc $BTC
post-image
BTC+0.44%
🧧 First Post, First Reward! Earn up to 10 USDT on Gate Square!
New users 100% win! Climb the leaderboard and split 15,000 USDT!
Limited rewards—the more & better you post, the more you earn!
3 Key Rewards:
1️⃣ First-Post Bonus: 100% win rate, up to 10 USDT Red Packets.
2️⃣ Daily Top Picks: 3 creators daily get a 100 USDT coupon + official interact.
3️⃣ Monthly Board: Share 10,000 USDT & Gate merch (T-shirts, umbrellas, mugs).
✍️ Share market insights, trade recaps, or hot topics—any thought counts!
Post Now 👉 www.gate.com/post
Details: https://www.gate.com/announcements/article/102256
  • 2
$BR This wick was beautifully drawn by the market maker. After sweeping 0.3541, it shot straight back to 0.4684. A 22.68% 24-hour range and 112.5M in trading volume: retail investors see a massive surge; I see a script.
Let’s run through the market maker’s playbook: place fake buy orders around 0.35 to prop up the market and get panic sellers to capitulate, then use wash trading to pump volume and push past 0.45, triggering short stop-losses, before using the 22% gain to stoke FOMO. The 24-hour high of 0.5370 is a test level. There isn’t much overhead supply, but the 0.50–0.53 range is crowded
BR+23.37%
🌈 #GateLiveStreamingInspiration -October 18
Go live with the following topics now to receive extra official support and promotional exposure!Today's Topic Recommendations:
🔹 Vitalik compares the costs of BTC mining and AI inference: electricity costs account for nearly half of the cost, while the latter relies more on computing power capital expenditure.
🔹 Arthur Hayes: The so-called quantum threat in cryptography is "nonsense"; users only need to pay attention to wallet management.
🔹 A new perspective on AI-driven fraud prevention: Actively allowing oneself to be scammed in order to gathe
post-image
BTC+0.36%
  • 7
  • 4
#每周来晒 #美国9月PPI大超预期 The week after the double inflation beat: what the market actually did
Two hot inflation reports landed in two days, and the verdict is in. Stocks fell, bonds steadied, the Fed odds cooled and Bitcoin held its ground. Here is the final scorecard as of Sunday, October 18, followed by an if-then framework for next week.
What the data said
September CPI rose 3.7% against 3.6% expected, and producer prices rose 1.3% on the month and 6.3% on the year. The surprise sat in the details, since core PPI rose 0.7% against a 0.3% forecast.
How each market responded
US stocks: tech took
BTC+0.36%
MU-5.66%
AMD-5.98%
DOW+0.96%
GLD-0.16%
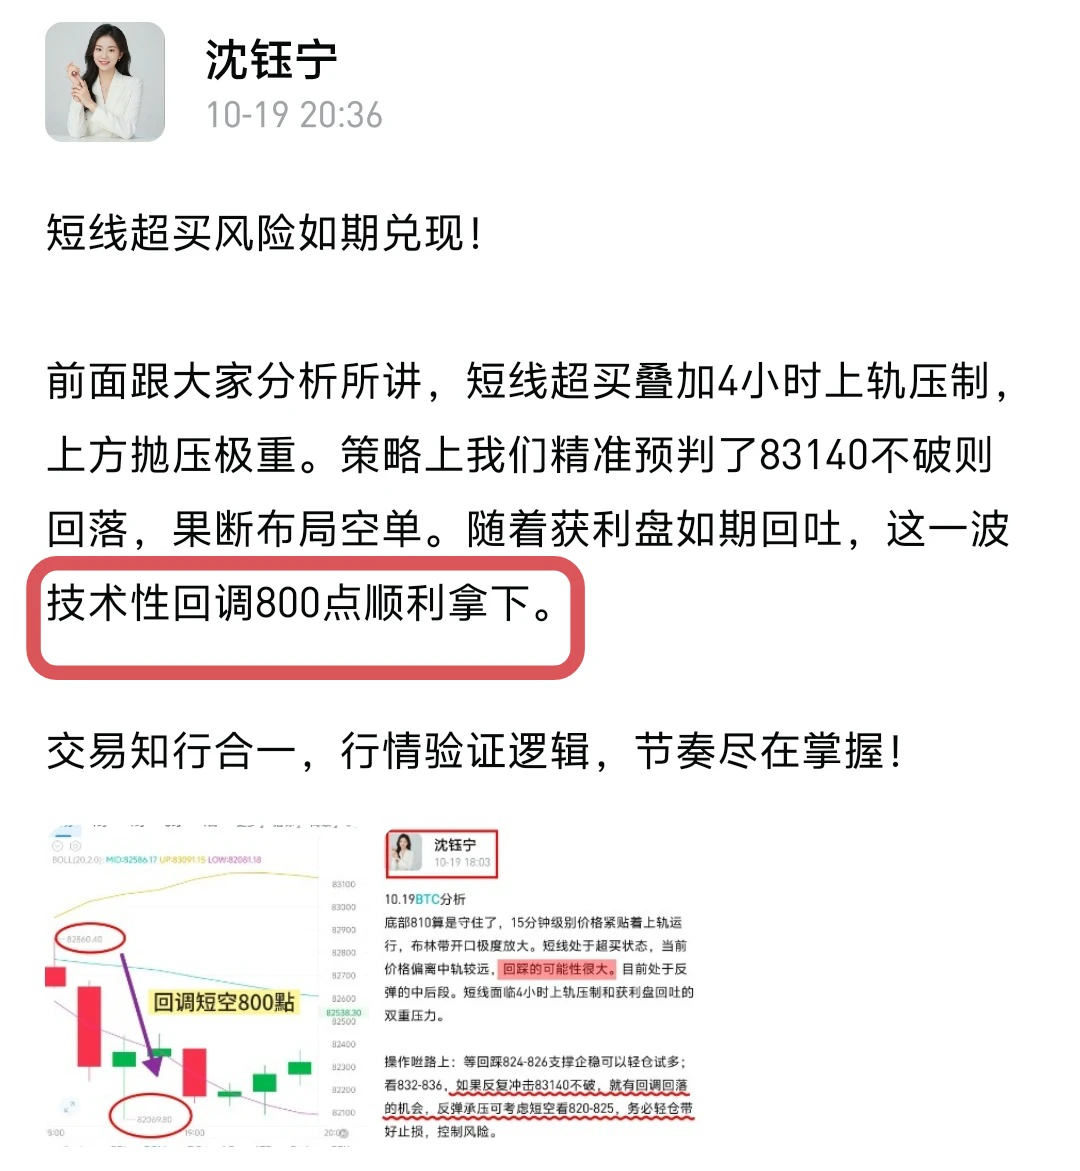
Positioned a day in advance, the market played out as expected✅
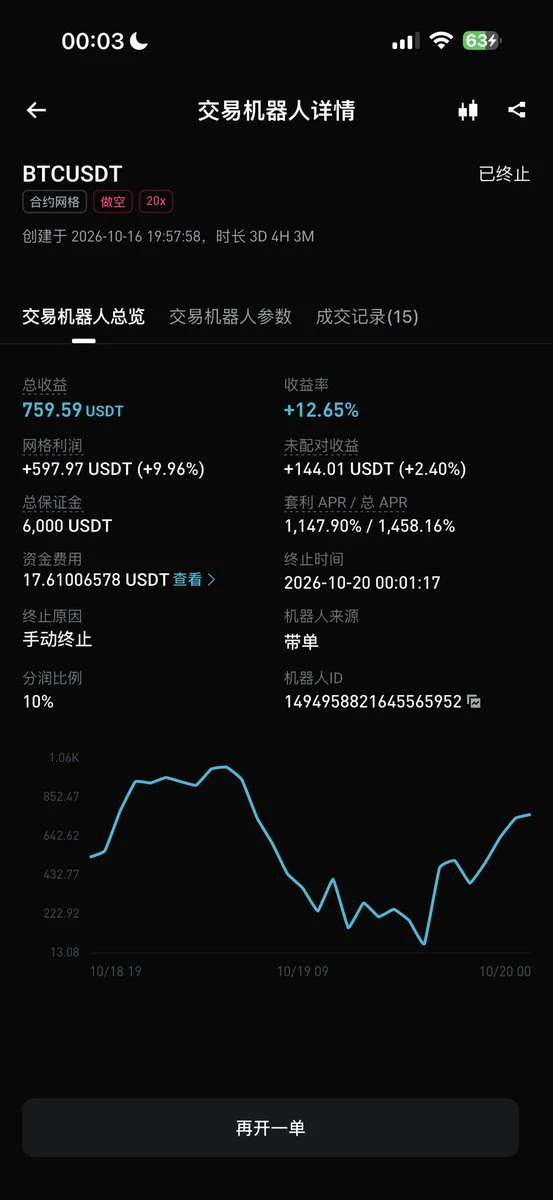
Yesterday morning, I publicly shared a strategy calling for shorting BTC's rebound in the 81800-82000 range, targeting 80800-80500.
The market precisely touched the entry zone before coming under pressure and moving lower, bottoming at 80754 and perfectly reaching the second take-profit zone. The short position was successfully closed,
All forecasts played out exactly as expected. The trend doesn't lie; levels were published in advance, no hindsight calls—results speak for themselves.$BTC ‌#美国9月PPI大超预期
YangGuangbit
Yang Guang Bit | October 17 $BTC — Oil prices surge as tech stocks plunge; favor shorting rallies in line with the trend
【Today's Plan】
Entry: Place short positions on a rebound into the 81,800–82,000 range
Stop-loss: Above 82,300
Take-profit targets:
First target: 81,200–81,000
Second target: 80,800–80,500
【Key Takeaways】
BTC turned lower from last night's rebound high of 82,900, pressured by a surge in international oil prices and a sharp drop in U.S. tech stocks. It fell below 81,000 late at night and is currently trading around 81,520. The 4-hour moving averages are fully aligned bearishly, with price below all of them; the weak trend remains intact. On the news front, Trump said Iran's nuclear facilities could be targeted, while the U.S. and Israel held secret talks on strike plans; Brent crude surged to $110, stoking risk aversion. Fed Chair Warsh said he would not prejudge the rate decision, and expectations of an October rate hike fell below 15%. ETF net outflows on the on-chain CPI day exceeded 3,100 BTC, as institutional capital remained cautious. Weekend liquidity is thin. The intraday plan is to favor shorting rallies, with light short-term longs at support; avoid chasing one-way moves and stay aligned with the trend throughout. No trend-driven crash is expected.
$BTC ‌#比特币短线站上8.2万美元
repost-content-media
BTC+0.44%
Tomorrow I start a 3 week run, if all goes well I’ll get my own Peterbilt
post-image
Crypto Trade Today
live-cover
LIVE894
Load More

Join 40 M users in our growing community

⚡️ Join 40 M users in the crypto craze discussion

💬 Engage with your favorite top creators

👍 See what interests you

Trending Topics

USSeptemberPPIBeatsExpectations

91.35k Views1.93k Discussing

US September PPI came in at 6.3% YoY, well above the 5.3% market expectation, pointing to renewed producer-side inflation pressure. Weekly jobless claims were 199K, broadly in line with forecasts. Could hotter inflation further reduce room for rate cuts, and what does it mean for $BTC, US stocks, and gold?

GateWCTCS9GlobalTradingCompetition

37.87k Views6.7k Discussing

GateBTCAndETHFuturesVolumeRanksTop3

53.8k Views1.83k Discussing

View More