Square
Following
Hot
News
Notifications
Profile
Share your thoughts
placeholder
Article
$DODOX This spot coin is unaffected by the broader market. It's surged sharply, so when the market makers want to pump it, it can rise no matter how badly the broader market crashes.
post-image
DODOX
DODOXDODOX
Pump.Fun
MC:$2.22KHolders:87
32.76%
U.S. stocks are falling, A-shares are falling, gold is falling, Bitcoin is falling—the whole world is falling. At this moment, there is no safe haven in global capital markets; there is nowhere to run…
The myth of U.S. stocks over the past two years has been propped up entirely by AI. Now storage prices have been slashed to 30% of their former levels, the AI bubble is deflating, and faith in valuations is collapsing. The Fed is becoming even more hawkish, and uncertainty over the Democrats taking office has pushed capital to the brink of panic…
Global capital is doing the same thing: selling r
post-image
GLDX-0.40%
PAXG+0.37%
BTC-0.67%
Trenches
FIONA
F
bade
b
FIONA
B34n...pump
Market Cap
$.
Change
.
24h Vol
$.
Holders
.
PIEVERSE
P
bade
b
PIEVERSE
0x0e...25a9
Market Cap
$.
Change
.
24h Vol
$.
Holders
.
mihao
m
bade
b
mihao
4Cxj...pump
Market Cap
$.
Change
.
24h Vol
$.
Holders
.
CLAUDIA
C
bade
b
CLAUDIA
2j5S...W2ZM
Market Cap
$.
Change
.
24h Vol
$.
Holders
.
IDOL
I
bade
b
IDOL
0x3b...ab07
Market Cap
$.
Change
.
24h Vol
$.
Holders
.
$SKYAI Will it pump in seconds
post-image
SKYAI-7.58%
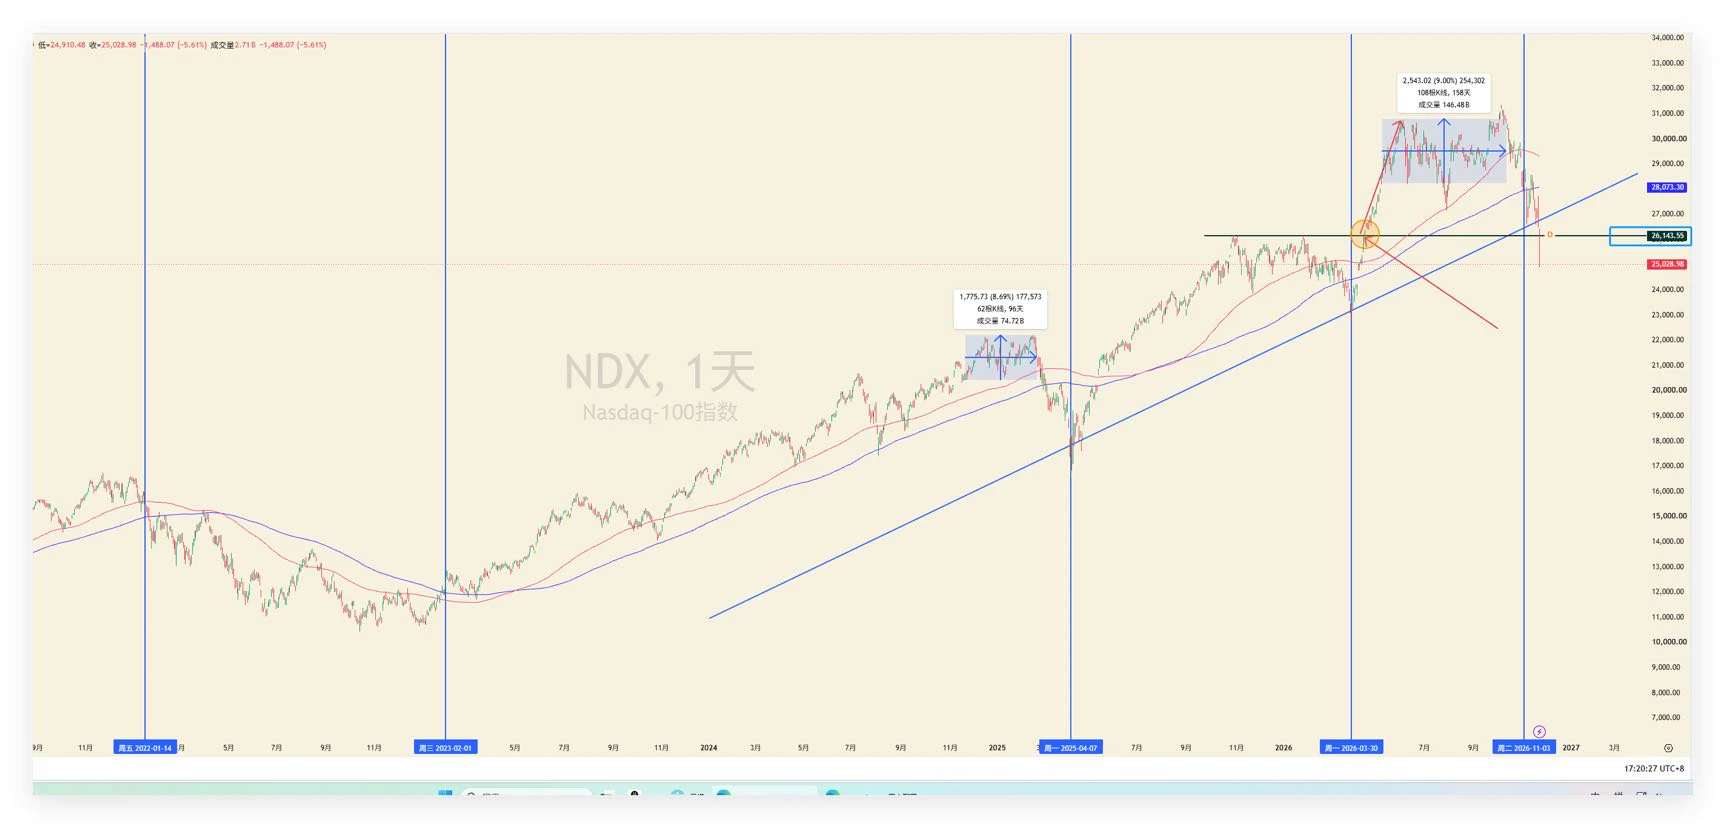
$NAS100 This time is different: the daily chart shows that the bearish signal is now more clearly confirmed.
This time, the price failed to hold after reclaiming MA200, and broke below the blue trendline, around the 26,000 level marked by the black horizontal line! 26,000 is undoubtedly significant as the starting point of the previous breakout rally.

For now, the bearish signal is simply clearer on the daily timeframe; this could be the beginning of a larger-scale correction.
This is just the signal shown on the chart. Market conditions can change in an instant, so more attention should be p
post-image
NAS100-4.60%
  • 4
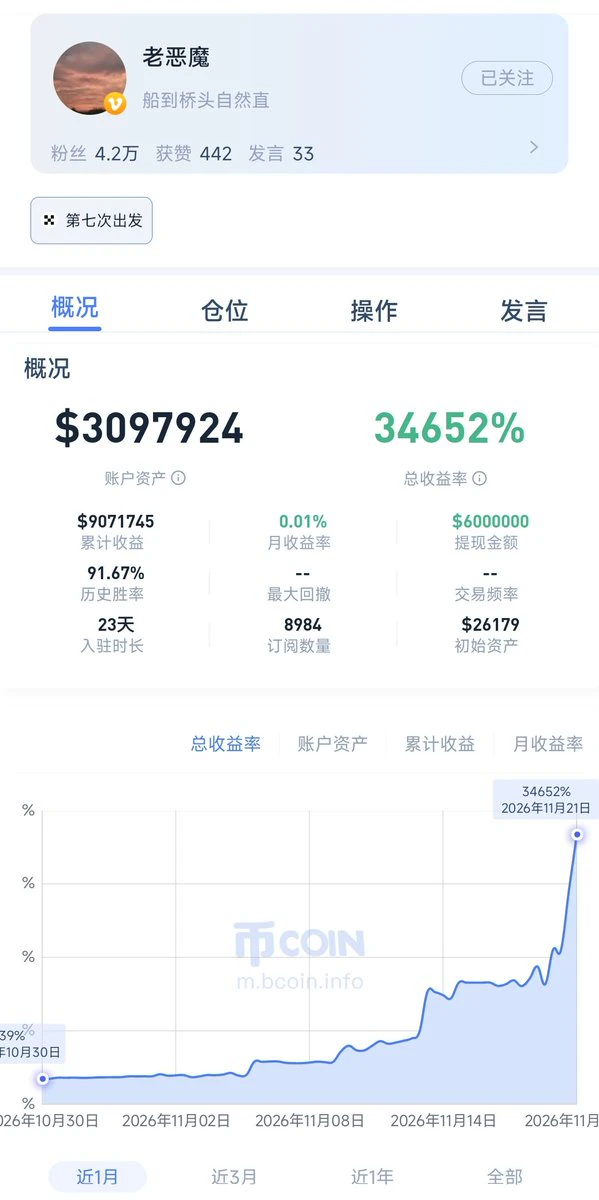
🚀 23 days, 280x.
Starting capital: $26k; account assets now stand at $5.67 million. 💰
Cumulative profits of $7.34 million, with $1.7 million already withdrawn and locked in. ✅
Historical win rate: 75%; 8,496 subscribers. 👀
This isn't a simulated account—it's a live one. 🔥
Making this much comes down to two things:
First, daring to bet. 💪 Shorting all the way down, adding to the position as the price fell, and sticking firmly to his direction. 📉
Second, a favorable market. 🍀 There was barely any meaningful pullback; prices kept plunging, moving perfectly in line with his position. 📉
Ple
post-image
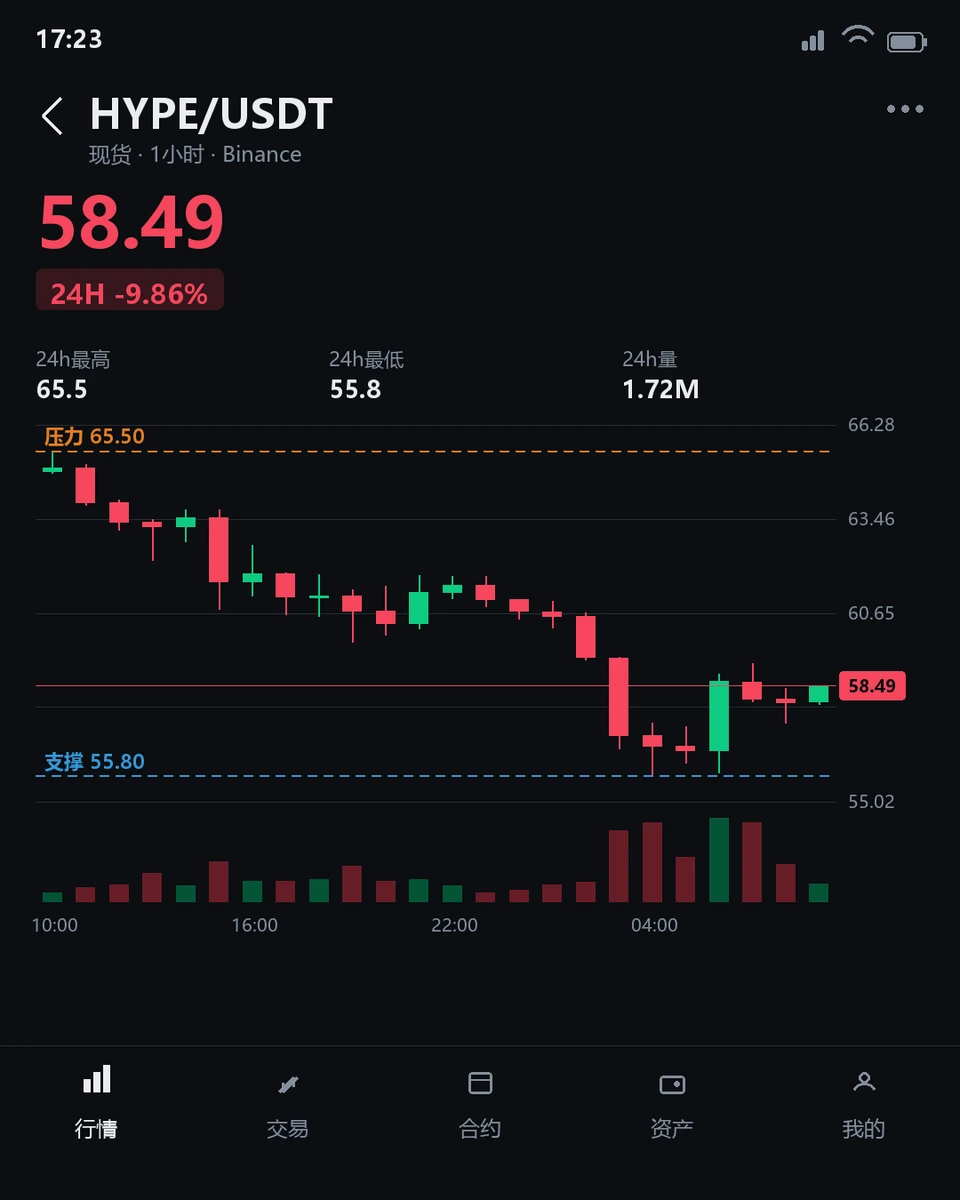
$HYPE Oversold ≠ Bottom: A Clash Between Rebound Demand and Structural Weakness

$HYPE is currently trading at $58.34, down 10.90% over the past 24 hours, with an intraday range of 55.8 to 65.55. The 1-hour RSI14 is 37.51 (neutral to weak), while the 4-hour RSI14 is just 19.99 (deeply oversold), showing a clear divergence between the two timeframes. This structural contradiction reveals the core tension in the current market: the battle between fading short-term momentum and an intermediate-term trend that has yet to bottom.

The key point to watch is that support on both the 1-hour and 4-hour
post-image
HYPE+0.24%
Arbitrum One’s Stablecoin Market Cap Increased by $327.4 Million Over the Past 7 Days
live-cover
LIVE1,523
BTC-0.67%
SOL-0.77%
ETH-1.26%
The White House chief of staff said Trump accomplished more in two years than any president in American history. Put that way, even George Washington would have to look up from the quarter. With names like Washington, Lincoln, and Roosevelt right there, “any president” sweeps up more than two centuries in one go. It’s certainly a bold claim.

My first reaction wasn’t whether I believed it. It was how convenient the claim was: no list to put together, no point-by-point comparisons, no explanation of what metric to use—tax reform, unemployment, the stock market, or Supreme Court appointments? Th
post-image
  • 2
  • 2
solana:So11111111111111111111111111111111111111112 got stopped out of my long yesterday.
I'm watching the 12H candle close here, there might be a potential bullish sweep.
I'm looking for a move up into the breaker resistance at $70.40-$72.70 for a short.
SOL-0.77%
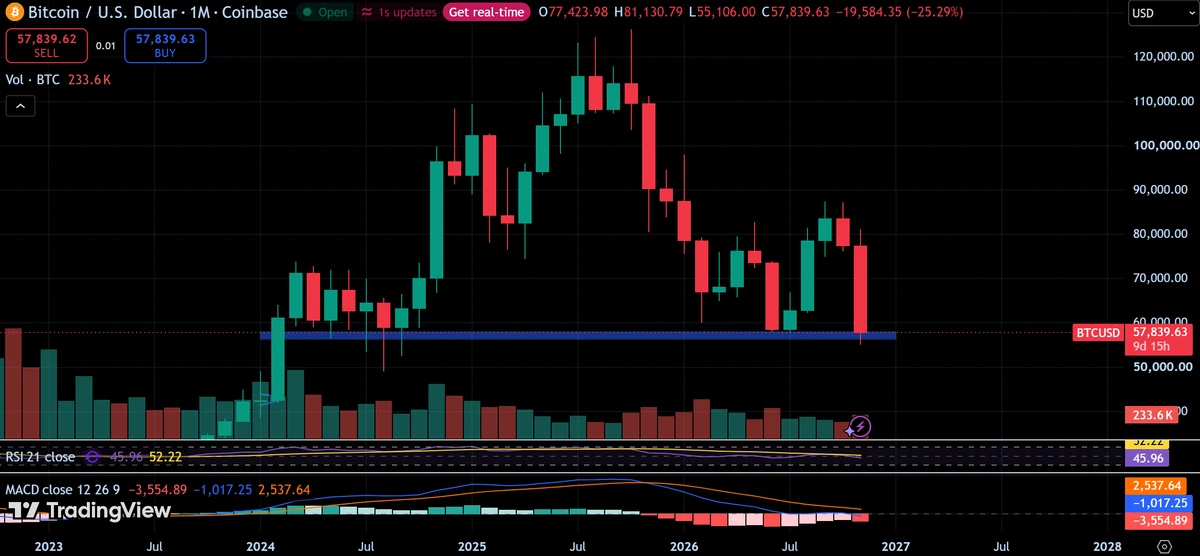
$BTC is sitting on the biggest support on the chart, the $57K to $58K band that has held since early 2024.
It wicked down to $55K and reclaimed, so buyers are defending it. Hold it on the monthly close and the range stays intact. Lose it and there is a lot of air below.
Down 25% on the month. Not calling a bottom before the candle closes, but this is the level that matters.
post-image
BTC-0.67%
What do you call precision? Do you understand the value? After BTC broke above 58000 overnight and confirmed the move, another short on the rebound to 59300 targeted below 55500! It precisely surged to 59370 in the morning, then selling pressure poured in, taking it to a low of 55100—the anticipated 4200-point move was banked!
ETH was also targeted in sync: short at 1640 resistance, target 1510. The pullback reached 1536, banking more than 90 points. Every step stayed ahead of the market!#BTC跌破6万美元关口 $BTC ‌$ETH ‌
BTC-0.65%
ETH-1.23%
$PARTI Bulls are in control! After breaking above 0.037070 on the 15-minute chart, PARTI is showing fresh bullish momentum. Buyers stepped in aggressively, with two consecutive strong green candles pushing the price from 0.036890 to 0.037920. A clean break above 0.038000 could open the way for a further move toward 0.040186 and 0.041334. A drop below 0.037070 would invalidate this view. Will the bulls push the price to new highs? $NEAR $ZEC
post-image
PARTI-1.06%
NEAR+1.17%
ZEC+1.16%
$UNI 4.435, 24H -8.12%. It just tested 4.188 and bounced, but volume is only 0.67x the average—this rebound is incredibly weak. The 4h RSI at 25 is oversold, but that can’t overcome the weak trend. For now, keep an eye on 4.188, where support converges with the intraday low. If it breaks and can’t reclaim that level on volume, watch out for a second leg down. A rebound would first need to reclaim 4.806, which is a long way off. Not investment advice.
#UNI #Uniswap
post-image
UNI+3.05%
🩸 Bloody Friday.

$BTC plunged to $55,500 ⚡🔻

Yesterday, the market experienced a major shock. Bitcoin lost key levels, and altcoins followed suit. But let’s break down exactly what triggered this drop.

1. The U.S. stock market plunged sharply 📉

Tech companies and the artificial intelligence sector came under pressure. The Nasdaq 100 fell about 5.5% in a single day, while Nvidia shares lost around 14%.

Investors began reducing their exposure to risky assets. Cryptocurrency also came under this pressure.

2. Investors are pulling money out of Bitcoin ETFs

In a single day, U.S. spot Bitc
BTC-0.67%
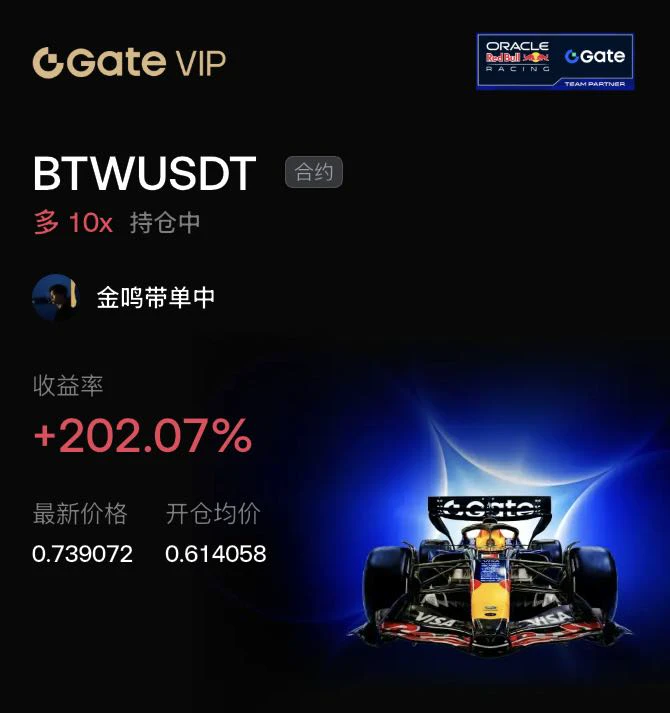
Guys, this $BTW long was opened at 0.614. It’s now at 0.739, 10x, 202%.

I didn’t make the money—it had just fallen hard. Its high on October 14 was 2.752; now it’s just over 0.6, down more than 70%.

Yesterday, the whole market was in the red, but it rose 11% against the trend, while Bitcoin fell 4.75% over the same period.

When something moves against the trend in a weak market, there’s usually money in there supporting it. That’s why I dared to hold.

But this is just a rebound trade—don’t treat it as a reversal. Take the profit and get out. $ETH #黄金逼近3500美元关口
post-image
BTW-7.75%
ETH-1.23%
  • 1
Everything is falling$GNS below $0.3$DEXE below 1.1, and BERA is crashing hard. I’m still not selling DEXEPriceAnalysis
post-image
GNS-6.46%
DEXE-4.14%
$BLESS 😂😂It crashed in under half an hour—another great payday this round. Still dumping on rising volume; short the rebound and break to new lows💰💰💰
post-image
BLESS-2.00%
Rebao is doing pretty well too.
He left Xiaoxia and became self-sufficient.
He’s already making 100k a month without relying on crypto.
post-image
I’ve come into this world twice, and both times I chose to defend my homeland.
market prediction
live-cover
LIVE1,885
BTC-0.67%
SOL-0.77%
XRP-1.15%
USDC+0.01%
HYPE+0.24%
Load More

Join 40 M users in our growing community

⚡️ Join 40 M users in the crypto craze discussion

💬 Engage with your favorite top creators

👍 See what interests you

Trending Topics

BTCBreaksBelow60K

2.1M Views29.4K Discussing

BTC fell below $60,000 on November 20 for the first time since July, alongside a tech stock selloff and broader pressure on risk assets. Will $60K become resistance, or can BTC quickly reclaim it? What price or volume signals would convince you that selling pressure is easing?

GateDirectIPOPhase3ANTAllocates92100Shares

750.8K Views4.8K Discussing

NvidiaDropsNearly14Percent

315.2K Views7.5K Discussing

View More