Square
Following
Hot
News
Notifications
Profile
Share your thoughts
placeholder
Article
$PIEVERSE A brutal one-day shakeout: down 19.14% in 24 hours to 1.6925, with a low of 1.6781 and trading volume of 113.6 million—retail traders couldn't generate this kind of selling volume; this is a chain reaction of leveraged liquidations.
First, let's compare the current data with the three historical halving bull-market cycles. In the 12th month after the first halving, altcoins generally pulled back 15-25% before resuming their climb; in the 10th month after the second halving, a similar intraday wick of around 20% appeared, followed by a recovery over the next two weeks; during the thir
PIEVERSE+0.50%
  • 6
  • 1
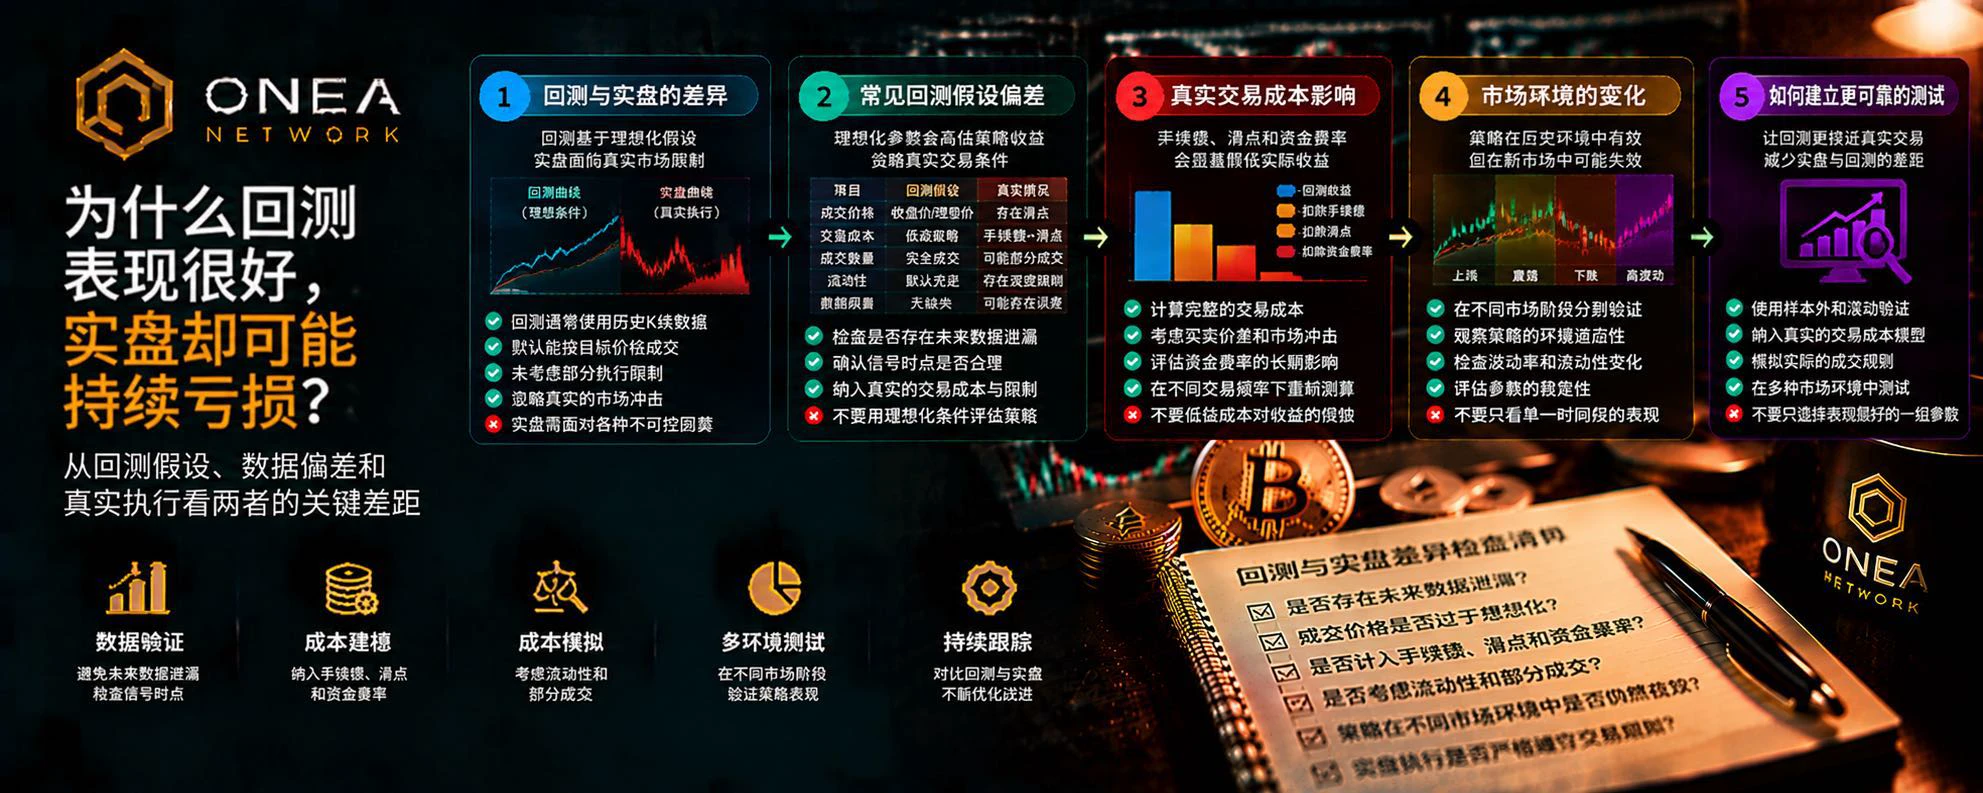
Why Can a Strategy Perform Very Well in Backtests but Lose Money Continuously in Live Trading?

A trading strategy may perform excellently on historical data, with a high win rate, a beautiful equity curve, and a small maximum drawdown.

But once deployed in the real market, the results can be completely different: execution prices are unfavorable, trading costs keep rising, returns gradually shrink, and losses may even become persistent.

So where exactly does the problem lie?

Often, the issue is not that backtesting is worthless, but that we treat backtest results as a guarantee of live per
post-image
Trenches
mihao
m
bade
b
mihao
4Cxj...pump
Market Cap
$.
Change
.
24h Vol
$.
Holders
.
PIEVERSE
P
bade
b
PIEVERSE
0x0e...25a9
Market Cap
$.
Change
.
24h Vol
$.
Holders
.
HOLD
H
bade
b
HOLD
4iJ7...pump
Market Cap
$.
Change
.
24h Vol
$.
Holders
.
X
X
bade
b
X
9VZe...pump
Market Cap
$.
Change
.
24h Vol
$.
Holders
.
DacityCoin
D
bade
b
DacityCoin
DKYc...pump
Market Cap
$.
Change
.
24h Vol
$.
Holders
.
Why do some traders review their trades every day and trade for a long time, yet never improve their performance?

They record every trade, study every loss, and even keep adjusting their strategy parameters.

But months later, the problems remain: losses keep recurring, trading rules are repeatedly revised, historical backtests look increasingly impressive, yet live trading shows no clear improvement.

The problem may not be a lack of effort in reviewing trades, but a flawed review method.

I. Remembering only profitable trades while overlooking the details of failures

It is easy for people
post-image
Support and resistance levels are the most fundamental and practical concepts in technical analysis. Many traders study candlesticks and indicators every day, yet overlook an important question: at which price levels are buying and selling forces likely to shift?

First, a support level is an area where buying pressure may increase as the price falls. When the price approaches this area, some buyers may start entering the market, slowing the decline. But a support level does not mean the price definitely won’t break below it.

Second, a resistance level is an area where selling pressure may in
post-image
BTC-0.67%
BTC breaks below 71000 with 600 million in long possition
live-cover
LIVE2,186
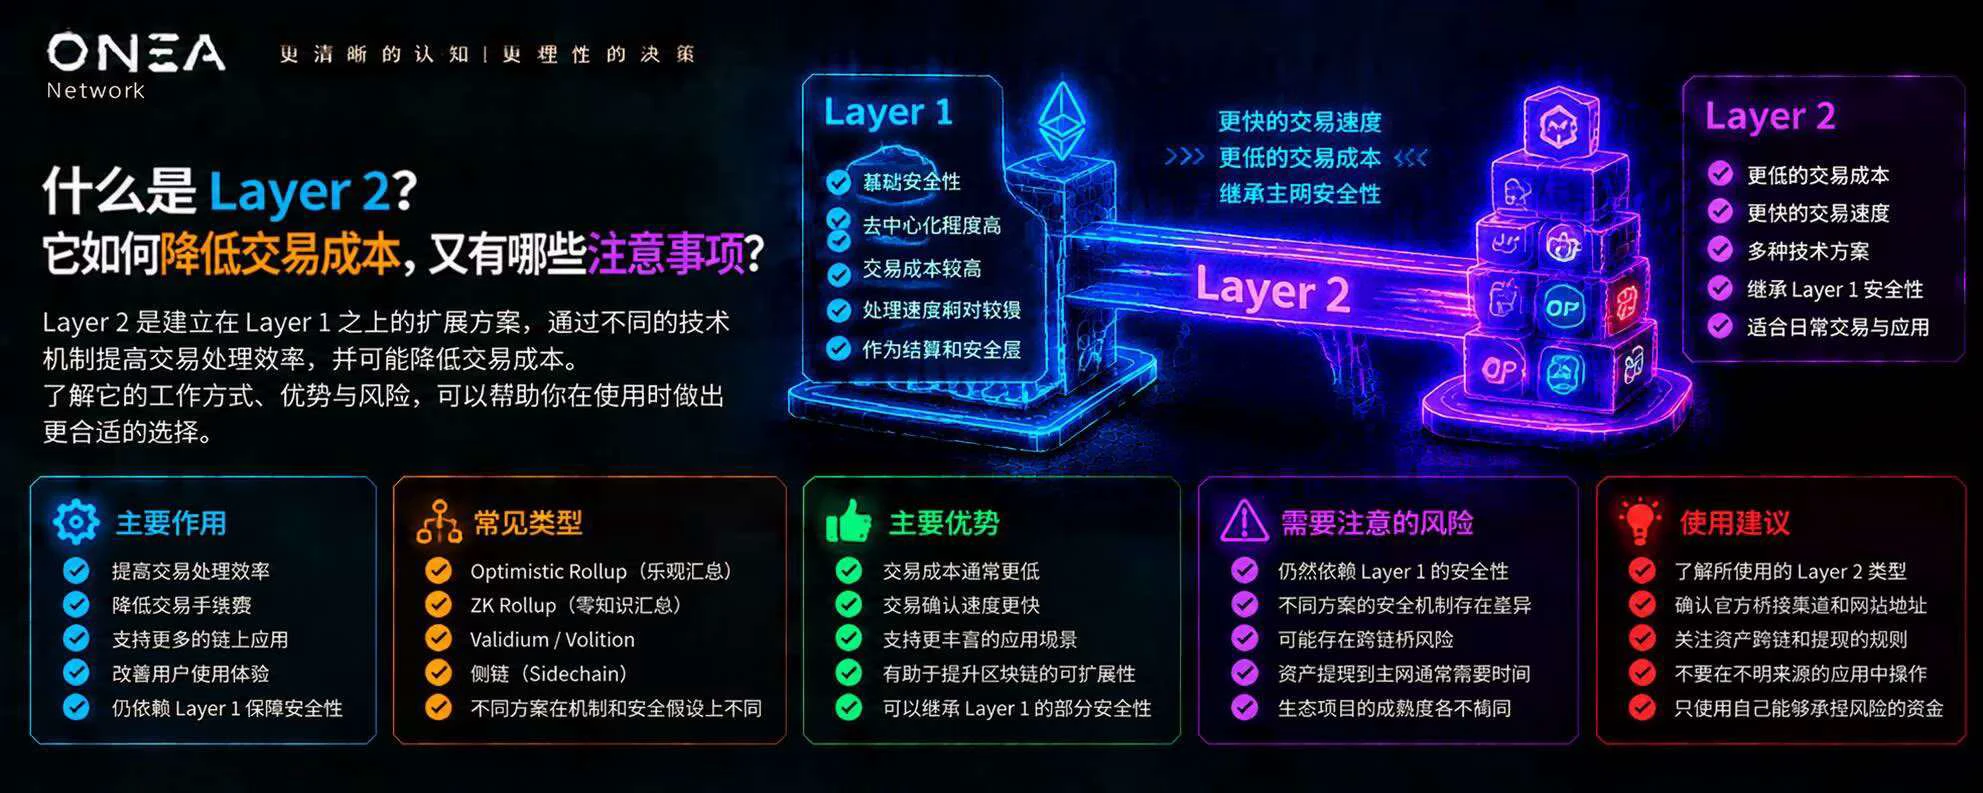
What Is Layer 2? How Does It Lower Transaction Costs, and What Are the Risks?

In the Web3 world, you may have encountered situations like this: when the network is congested, even a simple on-chain transaction may require a high fee.

To improve transaction processing efficiency and reduce user costs, Layer 2 (second-layer scaling solutions) have gradually become an important part of the blockchain ecosystem.

But what exactly is Layer 2? Why can it make transactions cheaper? And what should you be aware of when using it?

1. What Is Layer 2?

Simply put, Layer 2 is a scaling solution built o
post-image
ETH-1.26%
Good moornings chat <3
What’s the plan for today?
post-image
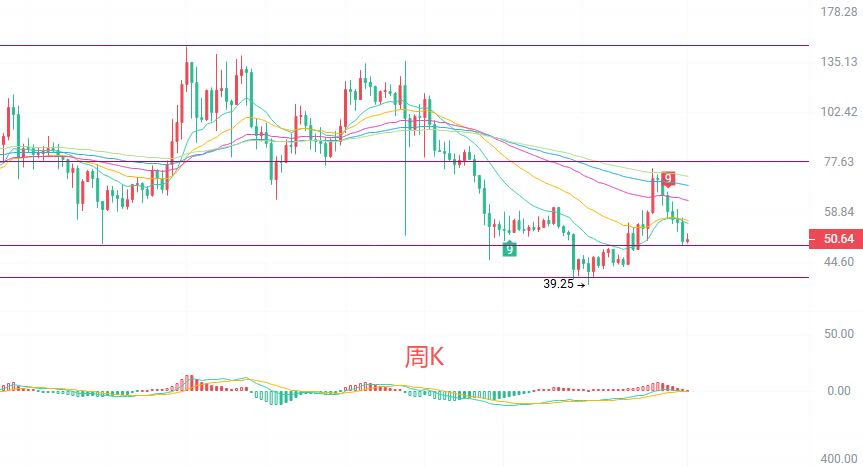
LTC market notes: Spot can enter with the first tranche; keep two tranches for adding

This recent pullback has been grinding. LTC fell from a high of 74.99 to around 50.5, and each rebound has failed to hold. In this market, it’s not about who can predict best, but who can control their hands and stick to discipline.
Daily: Closed at 50.53, a small bearish candle, with a 1.78% range. Price remains below the moving averages, including EMA15 at 53.36, EMA30 at 55.73, and EMA60 at 56.73; the medium-term structure is weak. The Bollinger lower band is at 49.21, with the current price near it. MACD
post-image
LTC-0.09%
Can There Be a Sharp Pullback in a Bull Market? How to Distinguish a Normal Correction from a Trend Reversal?
Many traders in the cryptocurrency market have experienced this: BTC rises for a while, then suddenly sees a sharp drop. Some consider it a normal correction and continue holding; others think the bull market is over and rush to sell.
But how can you tell?
First, watch the market structure. In a healthy uptrend, prices typically form progressively higher highs and higher lows. Even if a pullback occurs, as long as key lows are not decisively broken, the upward structure may still be in
post-image
BTC-0.67%
Bitcoin and Ethereum are in danger—is a major crash coming
post-image
BTC-0.67%
⏰ 100% win rate, no trading required for new users—Social's 26th Growth Points Lottery is underway!
Win multiple high-value vouchers and trade stocks and crypto tokens, with prizes up to 5,000 USDT!

🎁 Lucky draw prizes: a 5,000 USDT position experience voucher, a Gate desktop stand, and $SPCX waiting for you to claim!
🚀 Get in fast: Complete Square, Livestream, and Hot Chat tasks in Social [Events Center], and earn 300 points to enter the draw!

Try your luck today! 👉 https://www.gate.com/activities/pointprize?now_period=26
$BTC $SOL $XAU
post-image
BTC-0.67%
SOL-0.77%
XAU+0.38%
  • 12
  • 2
A truly mature trader is not someone who gets it right every time, but someone with a set of rules to control losses even when they get it wrong.

After entering the cryptocurrency market, many people keep looking for more accurate indicators, better entry signals, and higher win rates.

But one question is often overlooked:

If your judgment is wrong repeatedly, can your account still withstand it?

A complete trading risk management system should include more than just stop-losses. It should cover the entire process, from planning and execution to review.

Step 1: Define your trading goals a
post-image
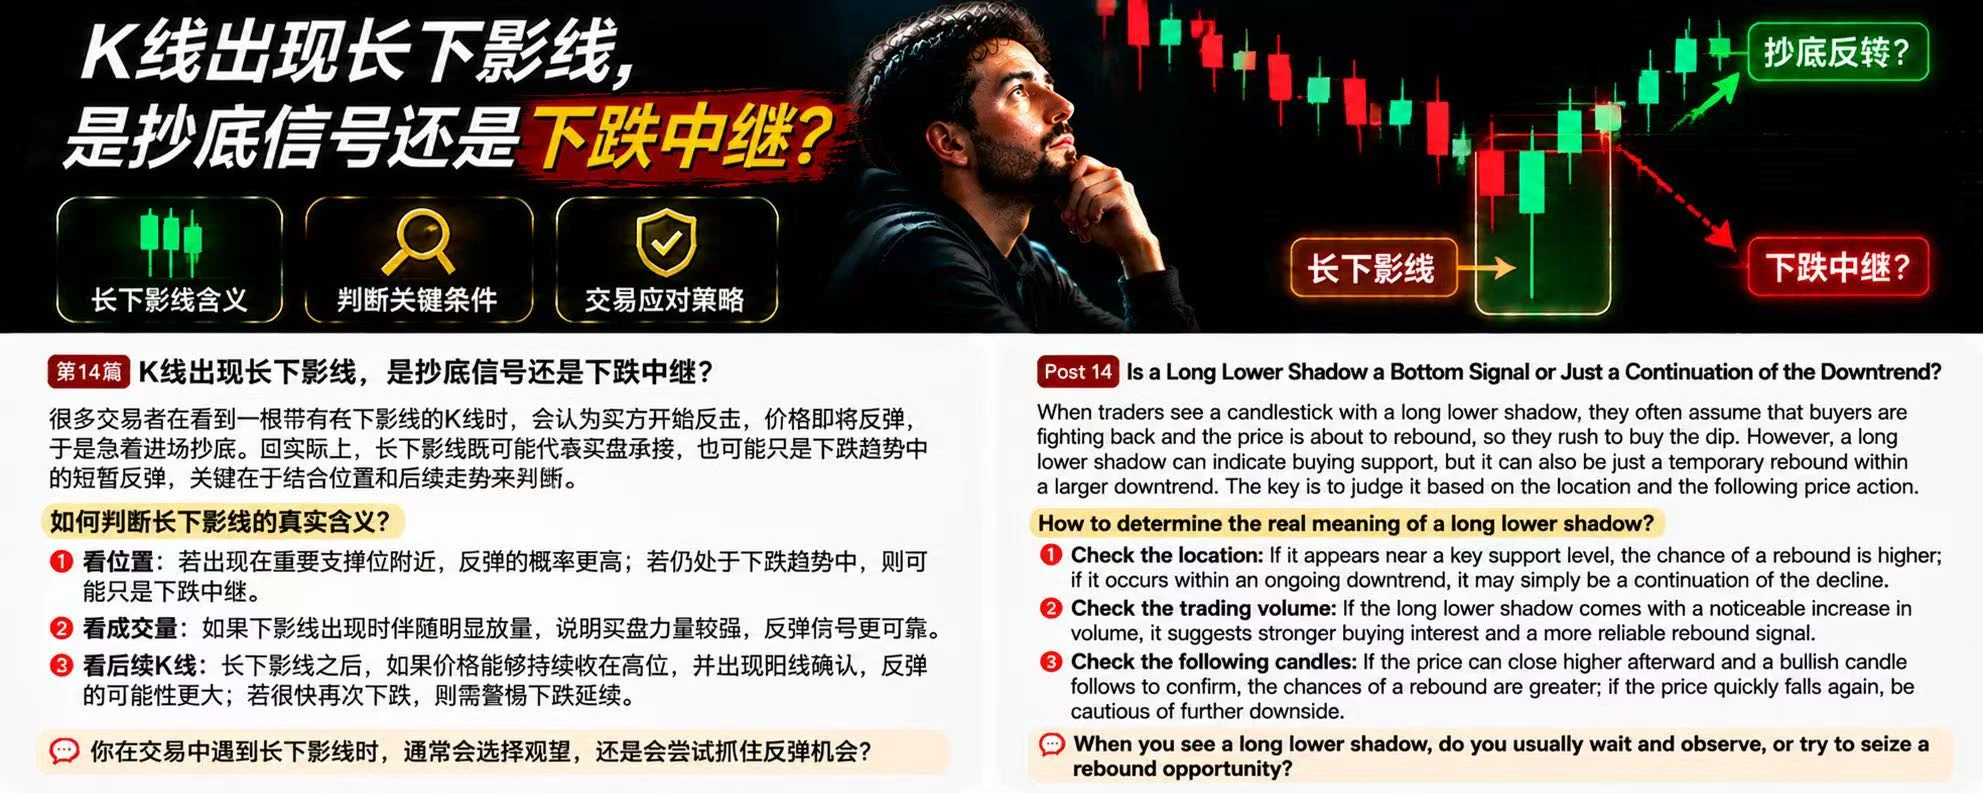
In BTC trading, many people see a candlestick with a long lower wick and assume buyers are starting to fight back and the price is about to rebound, so they rush in to buy the dip. But in reality, a long lower wick does not necessarily mean a trend reversal; it could also be just a brief bounce during a decline.

So, how should you judge?

First, look at where it appears. If a long lower wick appears near an important previous support level, it suggests that strong buying may have stepped in after the price fell to this area, making the rebound signal relatively more significant. But if it app
post-image
BTC-0.67%
⏰ LIVE IN 1 HOUR · 10:00 UK
Are we back to the BEAR MARKET? Live TA with Dan @connectioncapit, ex-Coin Bureau head of research.
Join us and bring your questions 👇

#Bitcoin #BTC #Crypto
post-image
BTC-0.67%
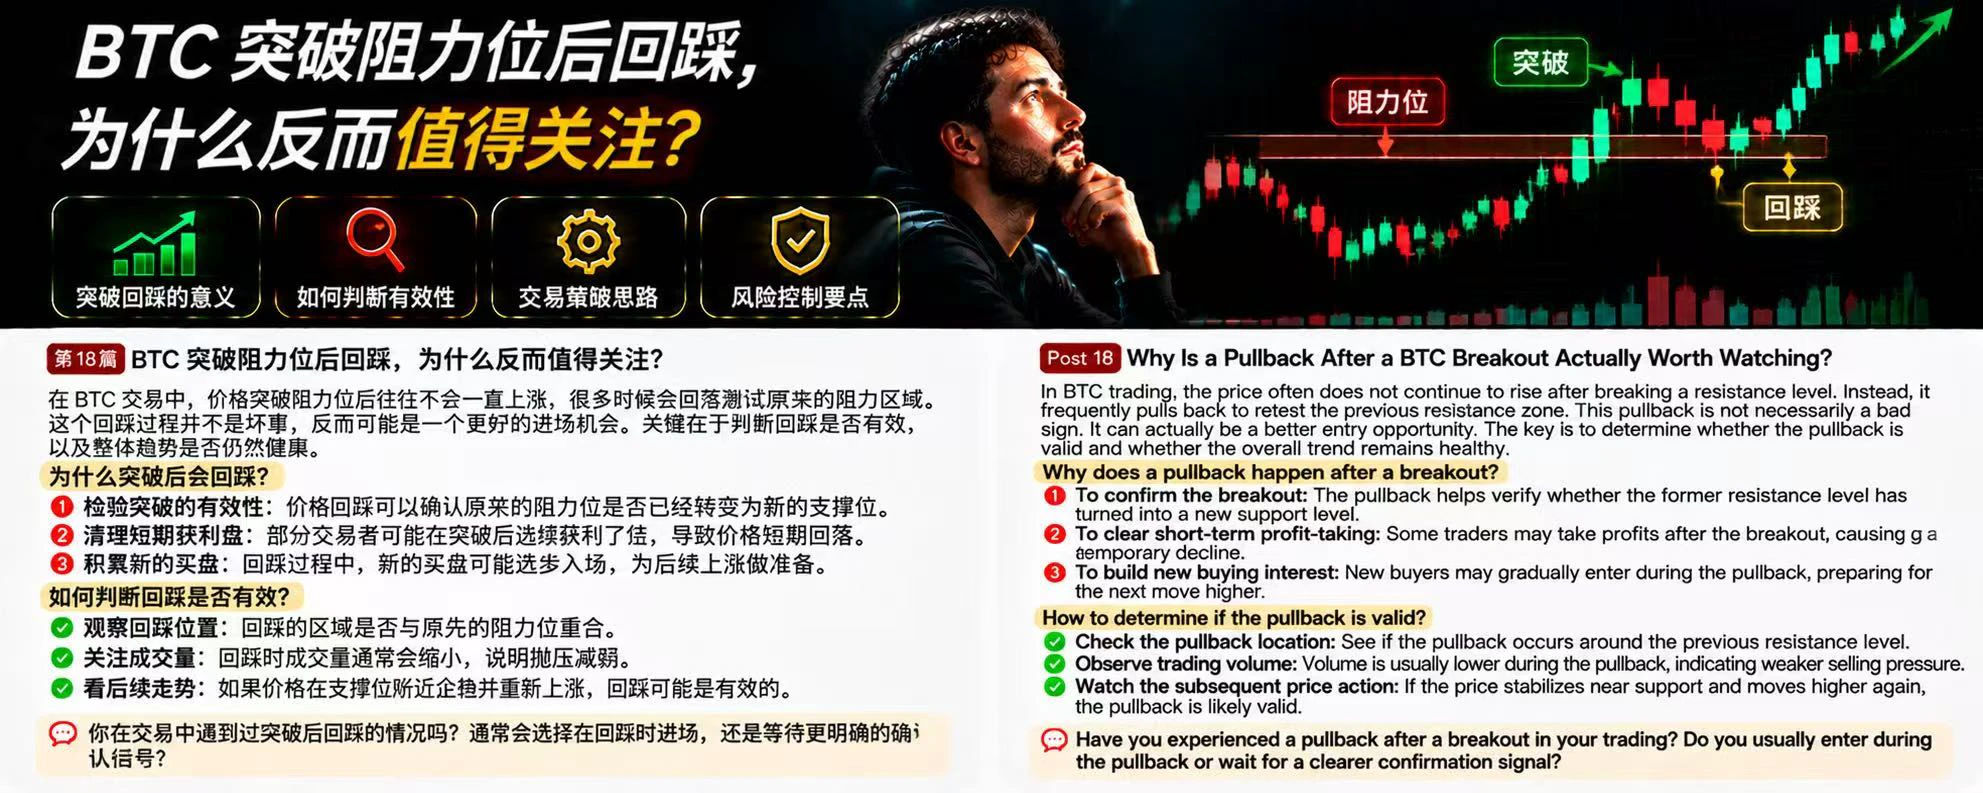
In BTC trading, many people see the price break through an important resistance level and immediately chase the rally, afraid of missing out on gains. But experienced traders often pay attention to another important signal after a breakout: the retest.

Why is a retest after a breakout worth watching?

First, it helps verify whether the breakout is valid. Once the former resistance level is broken, it may turn into new support. If the price pulls back to this area but does not break significantly below it, that may indicate the market is reconfirming the level’s role as support.

Second, it ab
post-image
NEW MARKET UPDATE
live-cover
LIVE2,107
No long position; entered gold at 4058, stop-loss at 4050
post-image
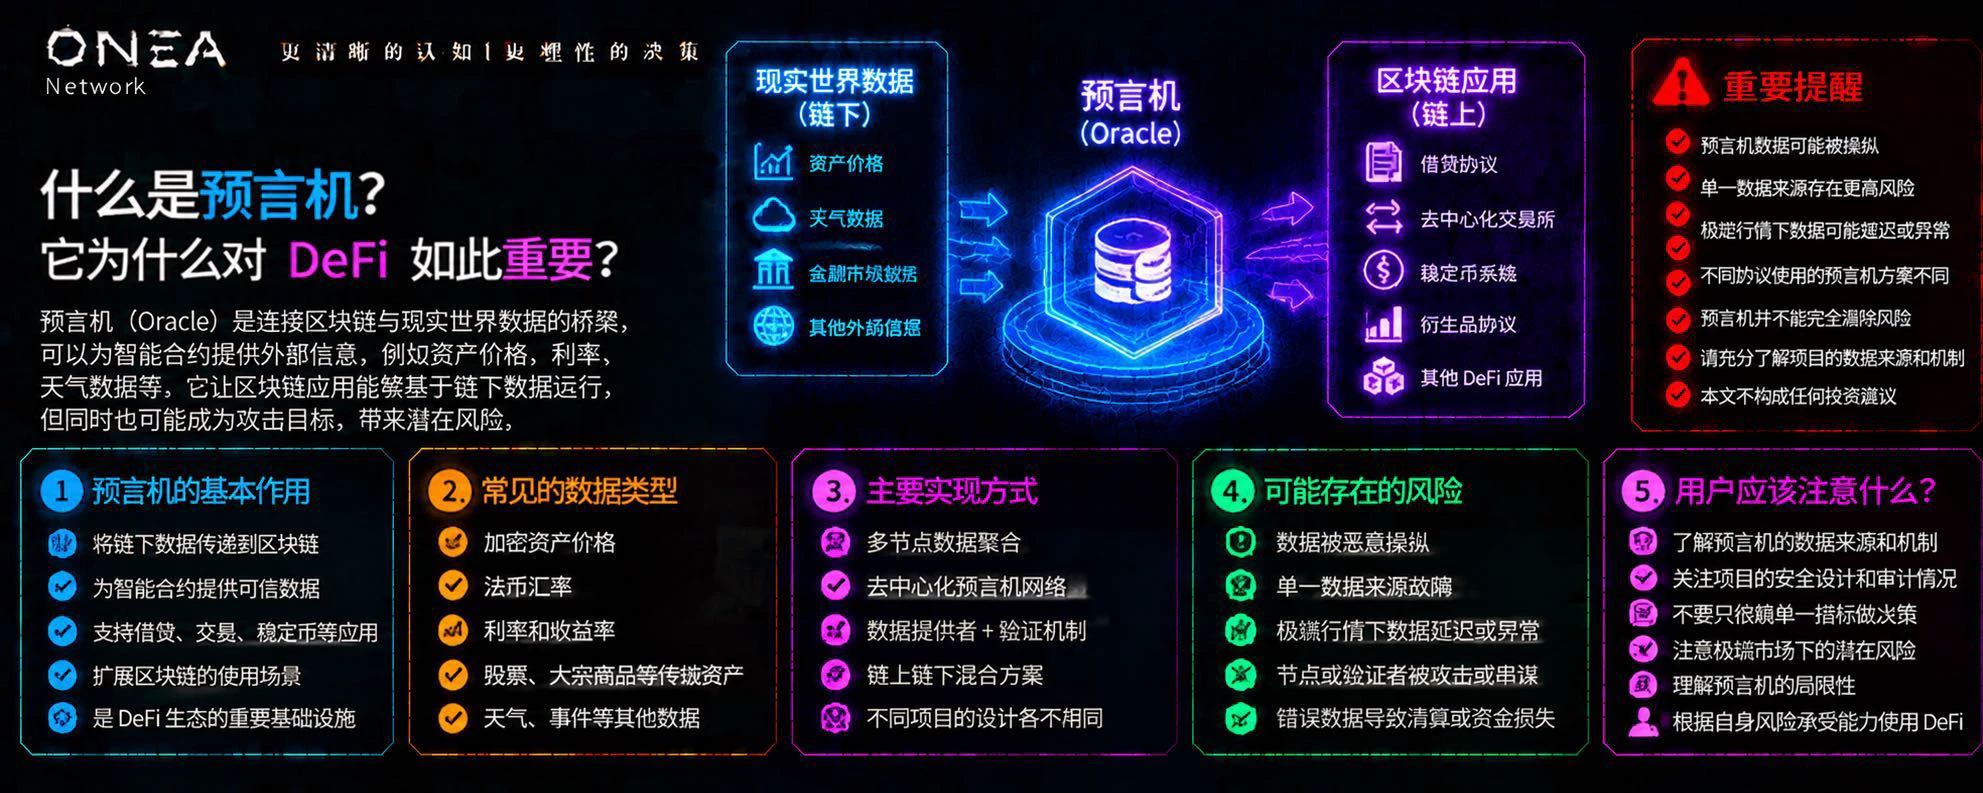
Why Aren’t DeFi Prices Determined by the Blockchain Itself? Understanding the Risks Behind Oracles

In the DeFi world, price data can affect whether a loan is completed successfully, whether a collateral asset is liquidated, and even whether a stablecoin protocol operates normally.

But the blockchain itself cannot directly know the real-world price of BTC, foreign exchange rates, or changes in the weather.

So how do smart contracts obtain this information?

The answer: oracles.

They are critical infrastructure connecting blockchains with external data, and a risk factor that many DeFi appli
post-image
BTC-0.67%
ETH-1.26%
Filecoin Onchain Cloud now has a record 156 paying customers, up 35.65% in the past 90 days from 115.
Filecoin Pay, its payment rail, also hit a record 160 active payers.
@Filecoin
FIL-2.00%
CLOUD-0.80%
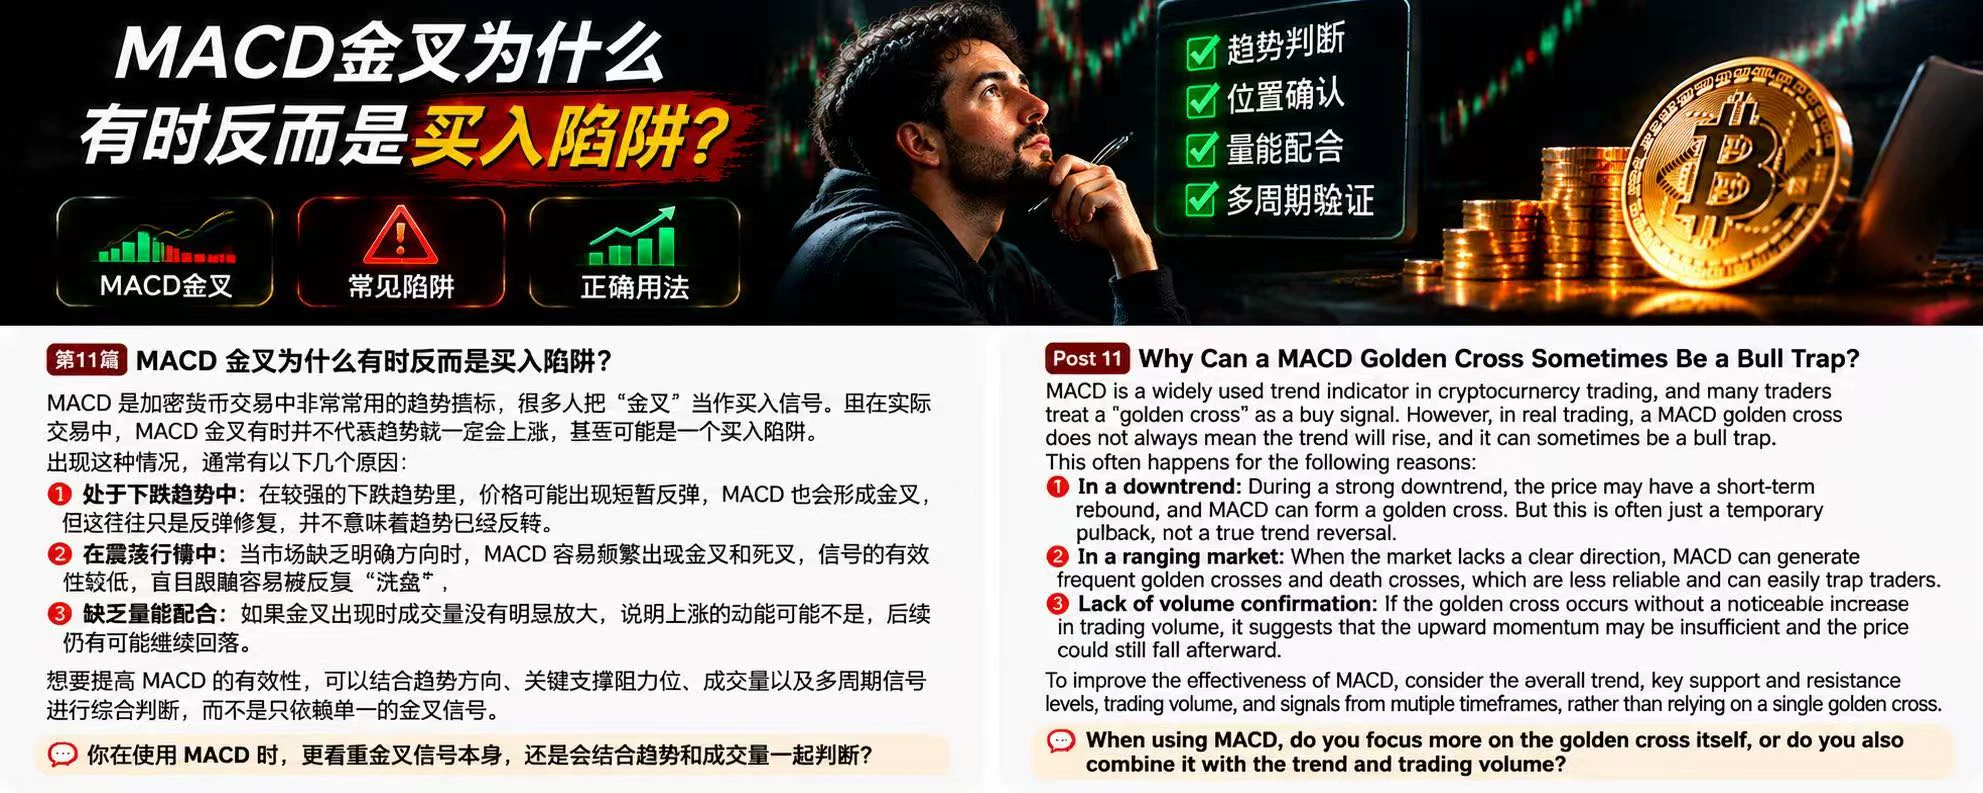
After seeing BTC rise, many traders expect a price pullback to get a better entry. But a retest is not always an opportunity; sometimes it may signal that a downtrend is starting again. The key is to determine whether support is holding and whether the overall market trend remains healthy.

First, assess the strength of the support level. If a price zone has seen rebounds multiple times in the past, it may indicate strong buying demand there. When the price returns to this zone, watch closely to see whether buyers step in again.

Second, watch for changes in trading volume. If volume gradually
post-image
Load More

Join 40 M users in our growing community

⚡️ Join 40 M users in the crypto craze discussion

💬 Engage with your favorite top creators

👍 See what interests you

Trending Topics

GateGlobalComplianceExpansion

15.89k Views351 Discussing

Gate continues to expand its global compliance footprint, now covering 81 regulated jurisdictions across Europe, North America, Asia, and Oceania. From MiCA and U.S. state-level MTLs to Japan’s FSA, Dubai, and Australia-related regulatory approvals, global exchanges are entering a new stage of compliance competition. Do you think regulatory strength will become as important as products and liquidity for exchanges in the future?

USOctoberCPIBeatsExpectations

87.04k Views2.65k Discussing

AnthropicIPOValuationCouldReach1.4T

12.22k Views1.61k Discussing

View More