



Square
Following
Hot
News
Profile
Share your thoughts
placeholder
Article
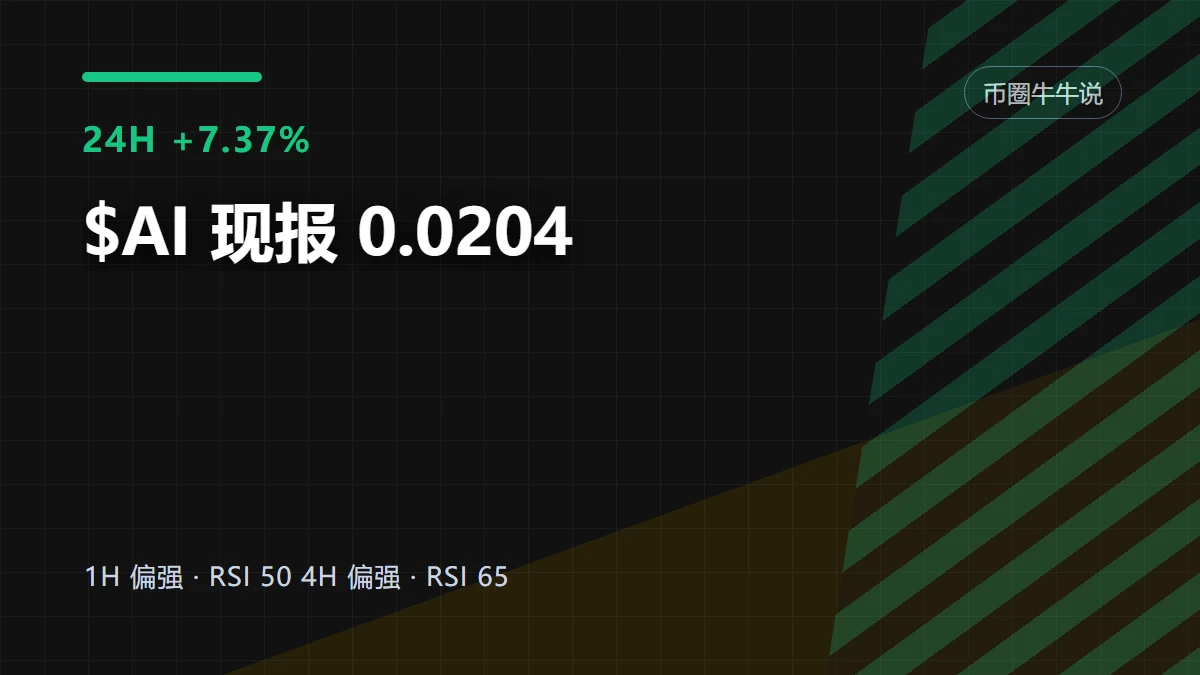
$AI Up 7.37% over 24 hours. The 1-hour and 4-hour trends are both strong, but trading participation is only 0.00x. Price has already moved, while volume has yet to weigh in.
The current price is 0.0204 USDT, with an intraday high of 0.0214 and a low of 0.0188. 1-hour support is at 0.0188, and resistance is at 0.0214.
Trading participation of 0.00x means there is almost no additional capital confirming the price move. The candles look orderly, but the move’s staying power should be discounted.
My view is that this strength looks more like an unconfirmed push higher than a continuation that has
post-image
[New Streamer] Market Prediction
live-cover
LIVE1,881
Trenches
Kimchi
K
bade
b
Kimchi
CSoc...pump
Market Cap
$.
Change
.
24h Vol
$.
Holders
.
CNPY
C
bade
b
CNPY
0xc6...ddd2
Market Cap
$.
Change
.
24h Vol
$.
Holders
.
AGT
A
bade
b
AGT
0x5d...e274
Market Cap
$.
Change
.
24h Vol
$.
Holders
.
kimchi
k
bade
b
kimchi
B1Y2...pump
Market Cap
$.
Change
.
24h Vol
$.
Holders
.
ZIG
Z
bade
b
ZIG
0x8c...1145
Market Cap
$.
Change
.
24h Vol
$.
Holders
.
#每周来晒 #美股财报季
I’m most bullish on Microsoft. Among the Big Five, it has the shortest distance between AI investment and revenue: Azure’s quarterly growth is 43%, and Copilot’s shift from fixed-seat to “seat + usage” billing means AI revenue is beginning to have the structural characteristic of automatically expanding with usage frequency. By contrast, Alphabet’s cloud business is growing quickly, but its capital expenditure for a single quarter ($44.9 billion) has already exceeded operating cash flow, sending free cash flow negative for the first time; Amazon’s capital expenditure is set to su
post-image
MSFT-2.10%
AMZN-4.49%
NVDA-4.31%
AAPL+1.22%
  • 2
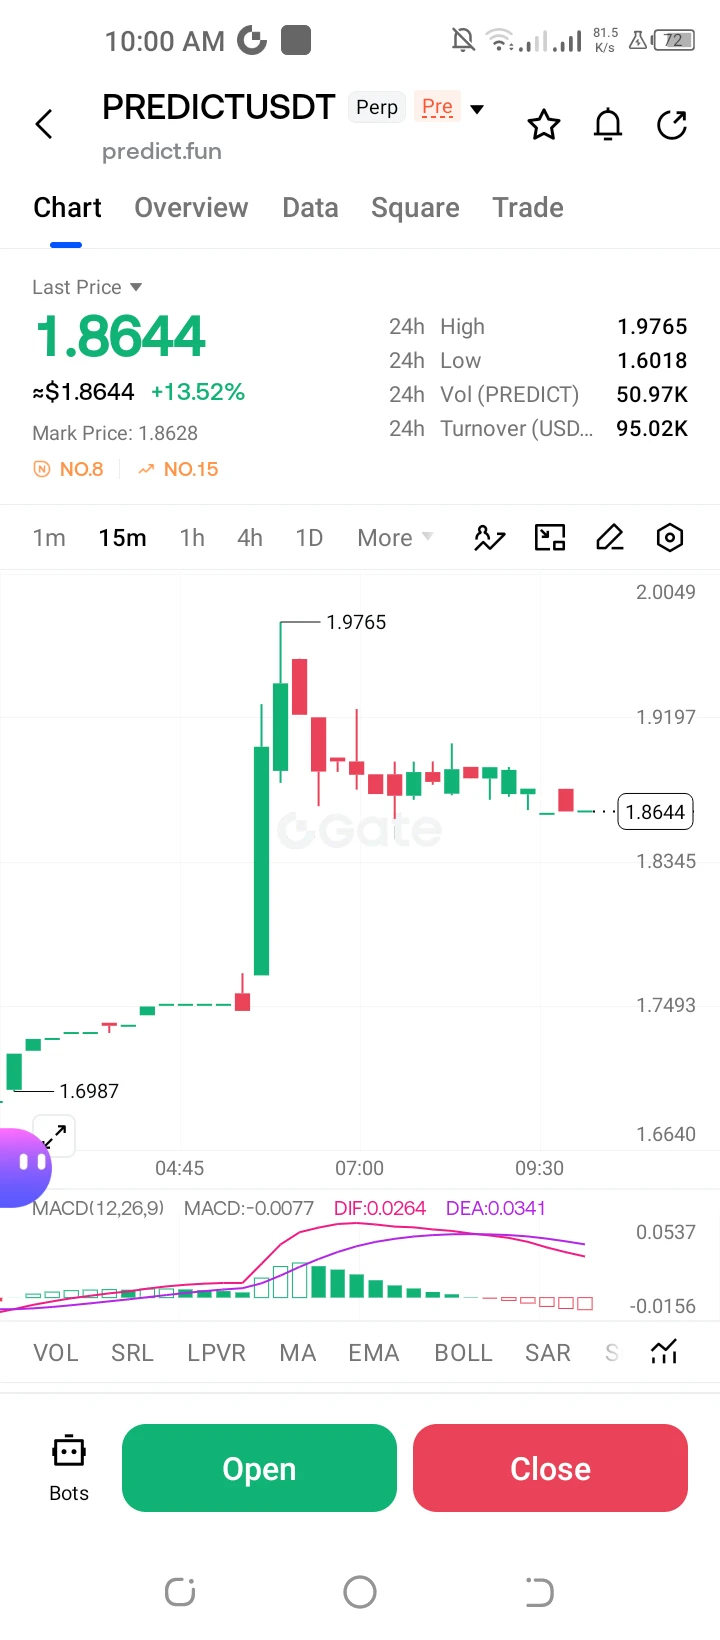
**$PREDICT /USDT Perp – "Extended Downtrend – Short"**
Trading Plan Short $PREDICT
Entry: 1.8800
SL: 1.9197
TP1: 1.8345
TP2: 1.7493
PREDICT is up +13.52% but rejected below the 1.9197 level after the 1.9765 high. MACD is negative; targeting the 1.8345 low.
#ShareWeekly
post-image
PREDICT+15.95%
MARKET UPDATE
live-cover
LIVE1,962
📊 U.S. Earnings Season Is Here | Post to Win Up to 100 USDT!
Join Gate Square’s Share Weekly special!
🎁 Rewards
New users: Guaranteed red packet
Weekly leaderboard: Up to 100 USDT
📌 How to Join
1️⃣ Sign up: https://www.gate.com/campaigns/6244
2️⃣ Post with #ShareWeekly and #USEarningsSeason
💬 This Week’s Topic
Tesla and Meta have reported earnings, with Microsoft, Alphabet, Amazon, Apple, and NVIDIA in the spotlight. Which tech giant are you most bullish on? Can AI investments drive lasting growth, and do earnings beats always mean higher stock prices?
👉 Join the discussion: https://www.
Gate_Square
📊 U.S. Earnings Season Is Here | Post to Win Up to 100 USDT!
Join Gate Square’s Share Weekly special!
🎁 Rewards
New users: Guaranteed red packet
Weekly leaderboard: Up to 100 USDT
📌 How to Join
1️⃣ Sign up: https://www.gate.com/campaigns/6244
2️⃣ Post with #ShareWeekly and #USEarningsSeason
💬 This Week’s Topic
Tesla and Meta have reported earnings, with Microsoft, Alphabet, Amazon, Apple, and NVIDIA in the spotlight. Which tech giant are you most bullish on? Can AI investments drive lasting growth, and do earnings beats always mean higher stock prices?
👉 Join the discussion: https://www.gate.com/post/topic/USEarningsSeason?topic_id=208350

repost-content-media
TSLA-3.10%
MSFT-2.10%
AMZN-4.49%
AAPL+1.22%
NVDA-4.31%
bitcoin:native Update
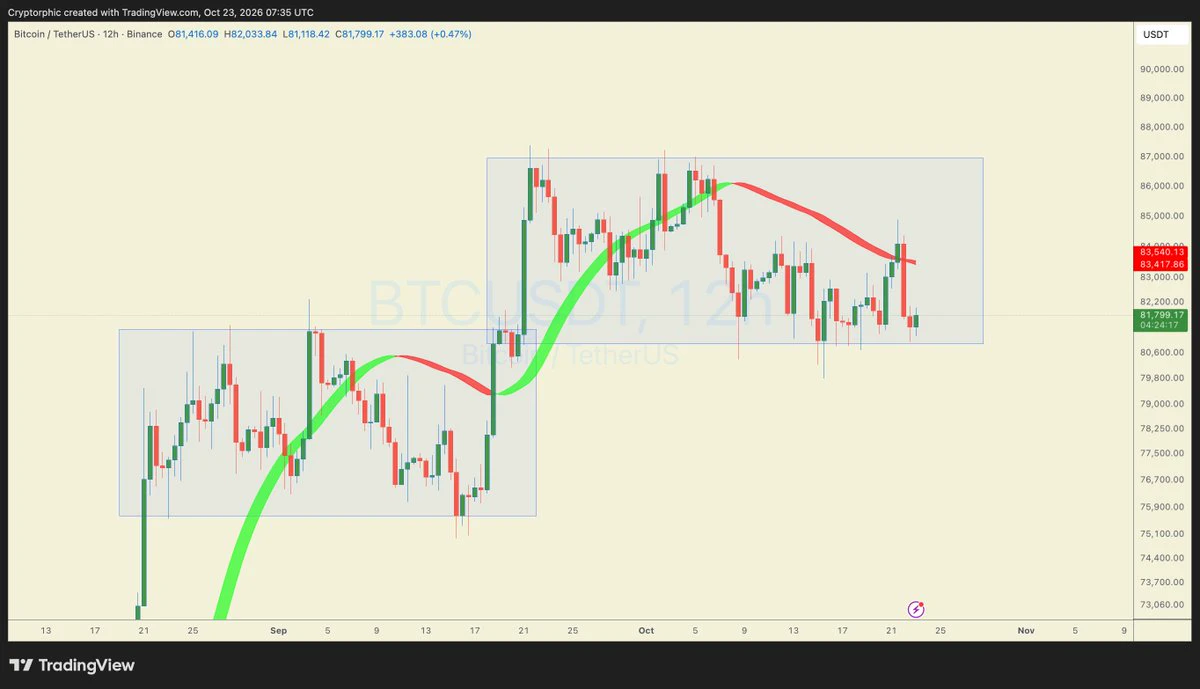
#BTC is still stuck in a range, and the latest rejection near $83.5K shows that sellers are defending the upper area. Price has slipped back toward $81K–$80.5K, which is the support zone I’m watching closely.
For now, there’s no clear directional move. A reclaim of $83.5K could open the door for another attempt toward $85K–$87K, while losing the lower range support would put the $80K level at risk.
I’m waiting for BTC to show its next move rather than jumping in while it’s still ranging.
DYOR. NFA.
post-image
BTC-0.33%
After all my hard work,
I finally got it,
guys 🥱
post-image
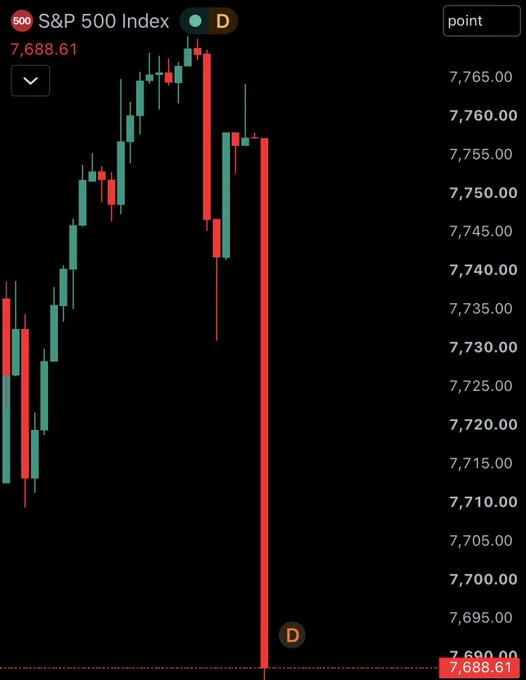
US stocks are plunging...
All I see is opportunity.
post-image
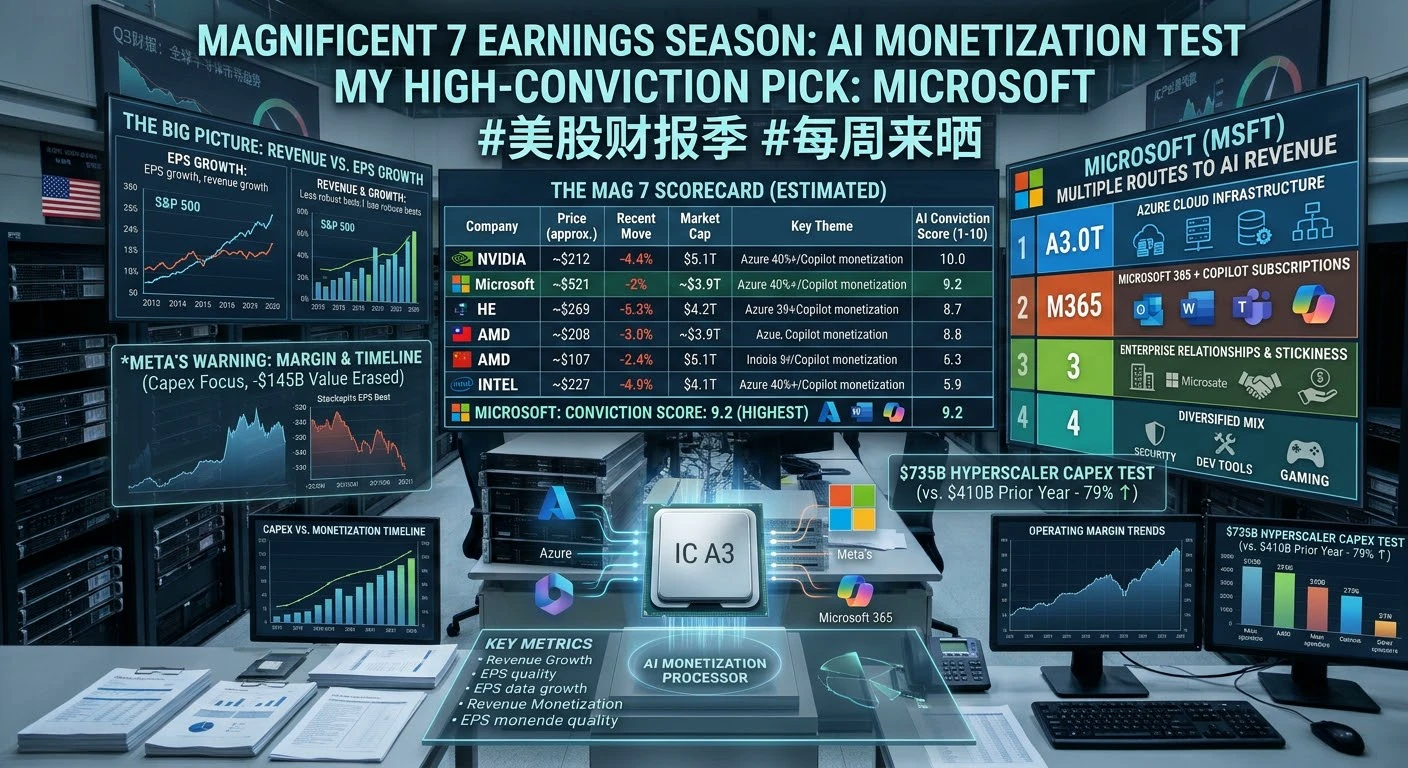
#Magnificent 7 Earnings Season: Microsoft Is My Highest-Conviction Pick
The Big Picture
Earnings season isn't just about EPS beats anymore—it's a test of whether massive AI investments can deliver real revenue, margins, and free cash flow. Early S&P 500 reports show strong earnings growth but less impressive revenue beats. That gap tells you something important: cost cuts and buybacks are doing heavy lifting, not always organic demand.
---
The Mag 7 Scorecard
Company Price (approx.) Recent Move Market Cap Key Theme
NVIDIA ~$212 −4.4% $5.1T AI accelerators, data-center demand
Apple ~$348 +1% ~$
post-image
MSFT-2.10%
NVDA-4.31%
AAPL+1.22%
AMZN-4.49%
TSLA-3.10%
#每周来晒 #美股财报季
U.S. Earnings Season Spotlight: Mag 7 Under the Microscope – AI Spend, Beats, and the Reality Check
U.S. earnings season is in full swing this October 2026, with the Magnificent 7 (and close peers) delivering the key signals on growth, AI investment returns, and market appetite. After a mixed start to Q3 reporting—S&P 500 early results showed strong overall EPS growth but more modest revenue beats—the focus has sharpened on Meta, Tesla (both reported Oct 21 after close), and the upcoming slate of Microsoft, Alphabet (around Oct 28), Amazon (Oct 29), Apple (early November), and N
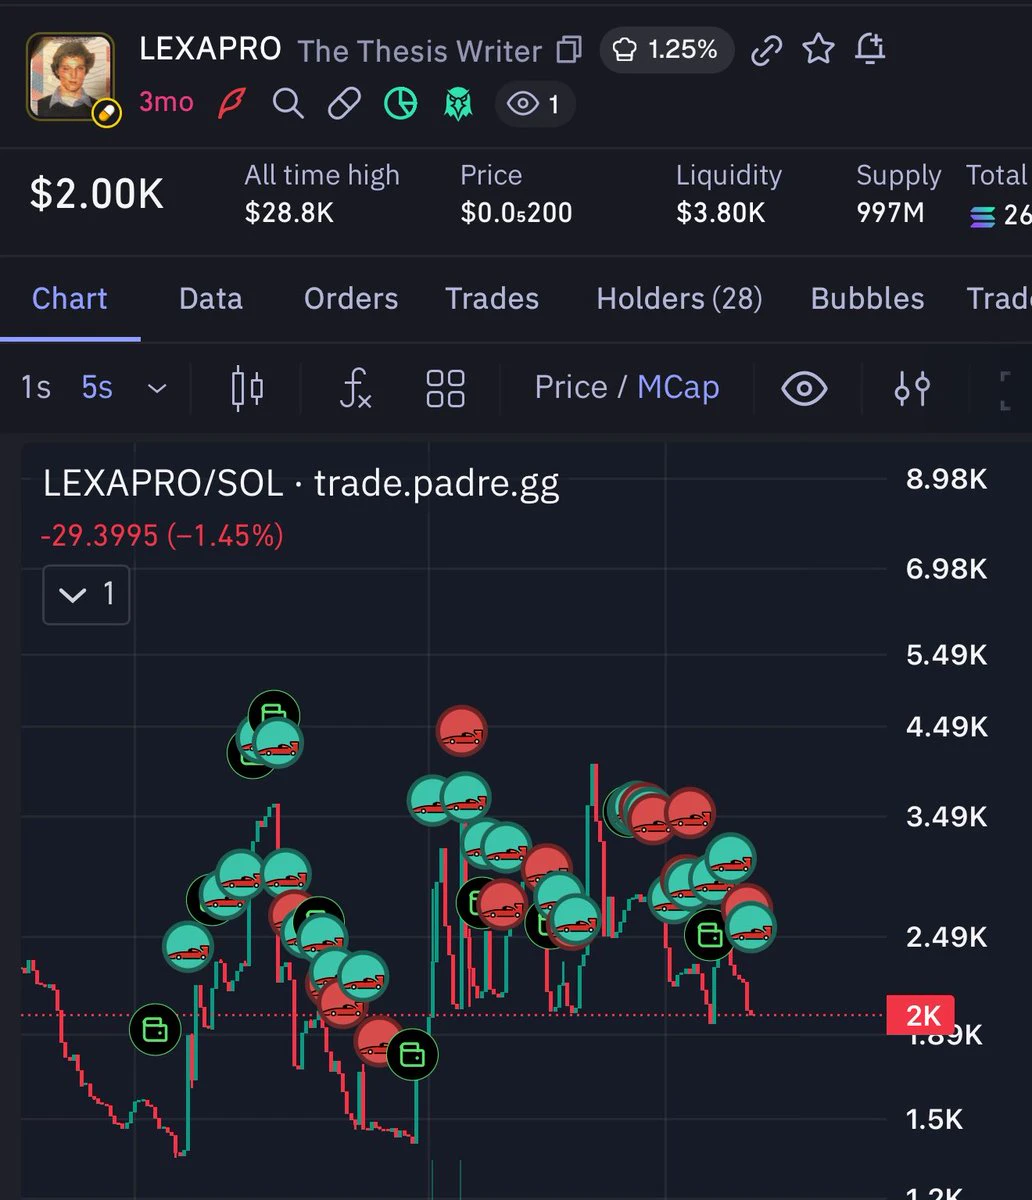
Genuinely why the fuck is Lexapro buying and selling $7 of his own token?
post-image
How can you tell whether a trading strategy has a genuine statistical edge rather than making money through luck?
In trading markets, one of the easiest things to misjudge is treating making money as evidence that a strategy works.
A string of winning trades could mean the strategy has an edge, or it could simply have encountered market conditions that suited it.
So how can you distinguish between the two?
The key is not how much a few trades earned, but whether the strategy has a repeatable positive expectancy after costs under sufficiently reasonable testing conditions.
1. First, understand
post-image
Friends who entered at high prices have probably been restless lately.
  Everyone wants to climb high and take in the view, but once you’re truly standing on the summit, you realize the wind is strong and the path is treacherous. Looking back, the steps down the mountain are longer than you imagined. The numbers on your screen rise and fall, and the cost-basis line stands like a hurdle. It’s hard to sell at a loss, but holding on stubbornly wears you down. Anyone who’s been there knows this feeling of being stuck in limbo.
  “Where the stream ends, I sit and watch the clouds rise.”
  In a diff
post-image
BTC-0.33%
ETH-0.26%
  • 1
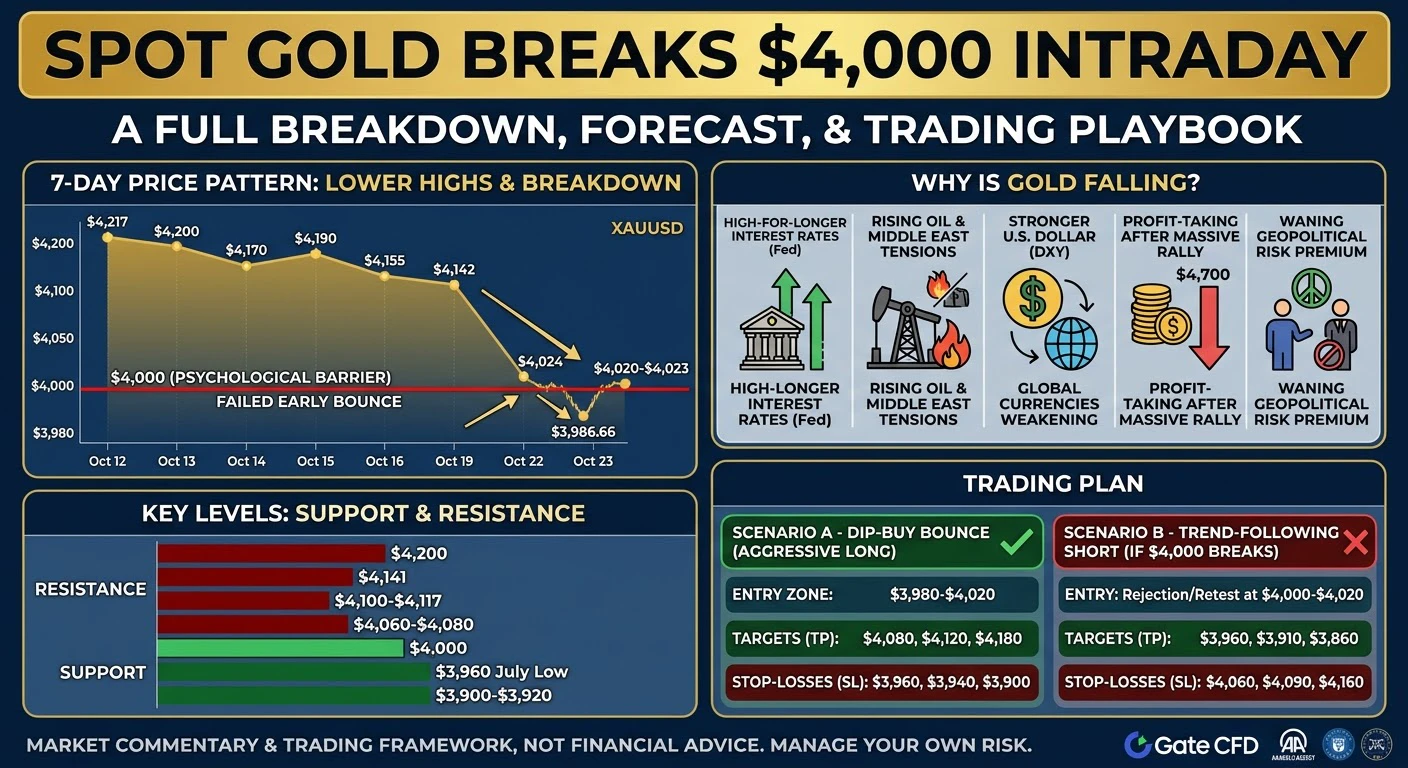
#SpotGoldFallsBelow$4000 #ShareWeekly
Spot Gold Breaks $4,000 Intraday — A Full Breakdown, Forecast, and Trading Playbook
Friday, October 23, 2026 — Spot gold briefly slipped below the psychological $4,000 barrier during the Asian session, touching an intraday low near $3,986.66 before buyers stepped back in. At the time of writing, the metal is hovering around $4,020–$4,023 per ounce.
This shakeout capped a brutal week: after closing Wednesday near $4,141, gold fell roughly 2.8% on Thursday to settle around $4,024, and the downward pressure carried into Friday. Measured against the late-Aug
post-image
XAU-1.58%
XAG-3.53%
  • 1
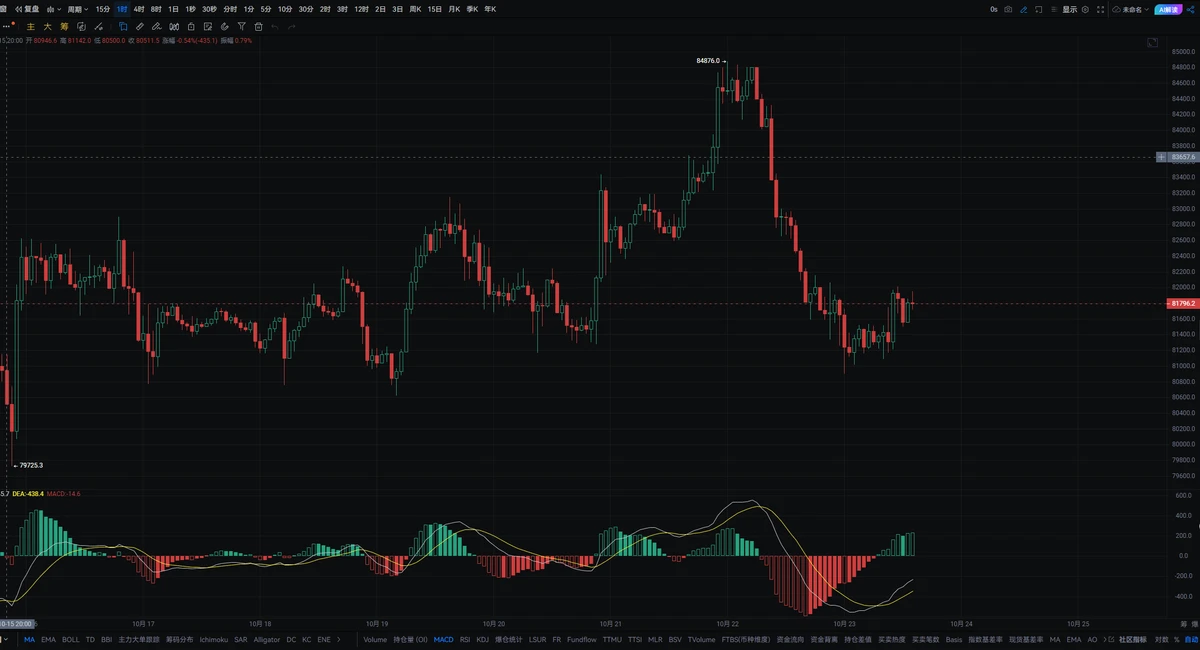
#BTC The current price is 81800, and the market remains in a weak, choppy pattern. After the earlier pullback, bulls have yet to gather enough strength to drive a rebound. On the 4-hour chart, the price continues to face pressure below the resistance zone, and each modest attempt to move higher tends to meet selling pressure. The short-term tug-of-war between bulls and bears remains relatively evenly matched.
On the daily chart, the overall trend has shifted lower. Market sentiment is cautious, and investors are largely sitting on the sidelines. The key resistance zone above is likely to limit
post-image
BTC-0.33%
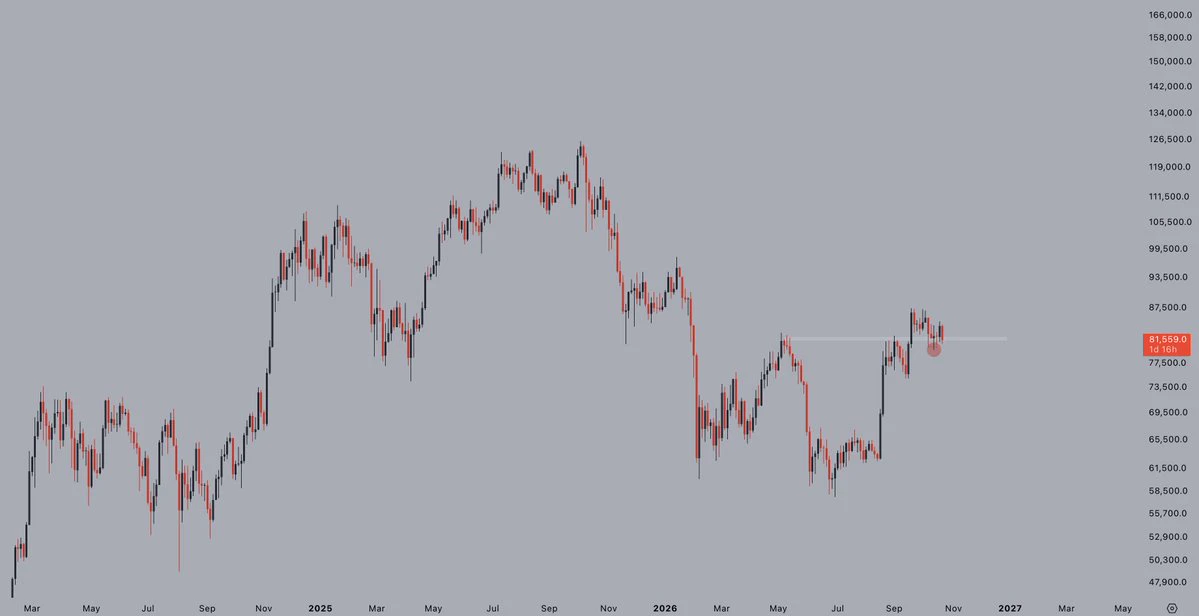
$BTC is still chopping above the May highs.
Patiently waiting to see if we get another dip to buy, and if we don't -- all good too.
They're not going to shake me out here.
post-image
BTC-0.33%
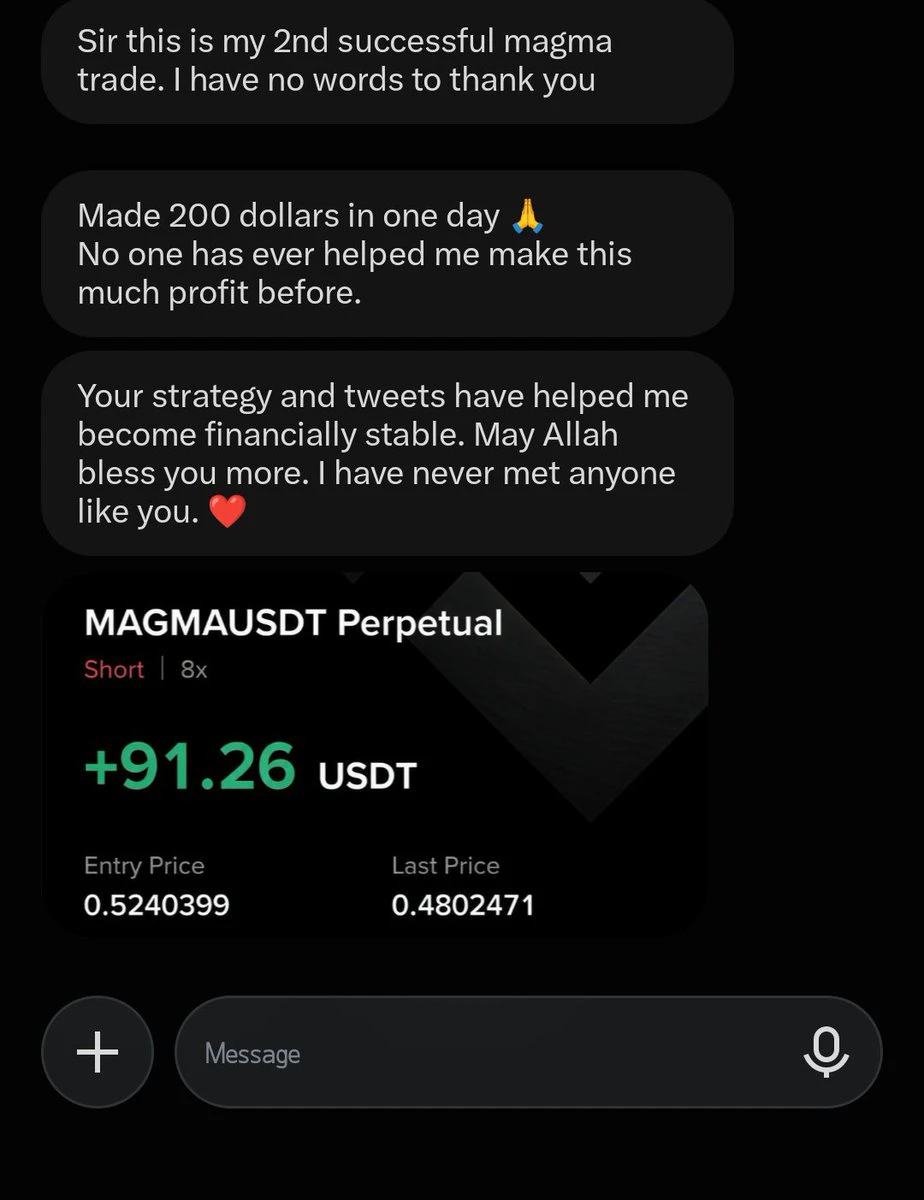
READ THIS FEEDBACK CAREFULLY. IT MAKES ME SO HAPPY. ❤️
He made $200 in just one day by following tweets and strategy.
Almost 50 people took the $MAGMA trade, making thousands of dollars in profit.
A day earlier, 92 people followed $DOOD tweet and took the trade. They all ended up in profit.
I HIDE NOTHING. EVERYTHING IS PUBLIC.
Those who know my value are standing with me.
I CAME HERE WITH A PURPOSE, AND I'M HERE TO FULFILL IT.
Otherwise, nobody gives this much time for nothing in return.
But seeing people happy is ENOUGH FOR ME.
post-image
MAGMA+1.01%
DOOD-12.81%
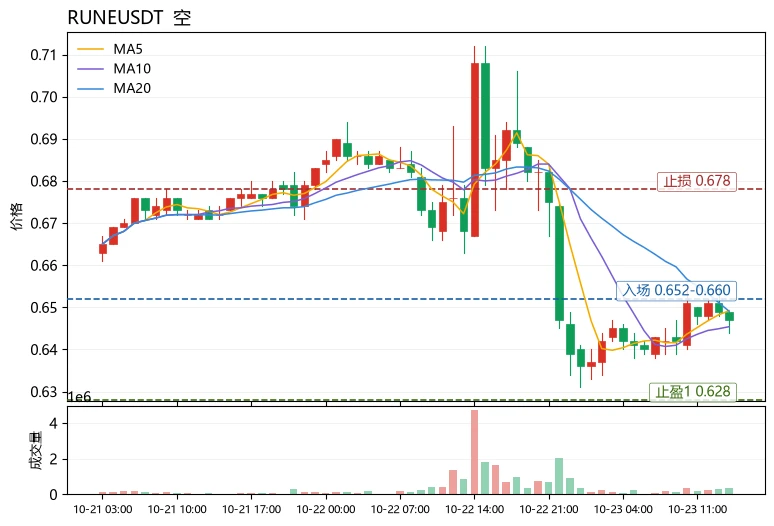
Many people use “it has fallen so much, it should rebound” as a reason to enter, treating price like a spring. $RUNE It fell 8.62% over 24h to 0.647, with an amplitude of about 12.52% across 30 candles, so volatility is still high; the funding rate remains at +0.0082%, meaning longs are still paying, which suggests the process of flushing out excess may not be over. MA5 is only slightly above MA20, indicating a flattening rather than a bullish alignment. RSI is 43.1, neutral to weak; the MACD histogram is positive but has limited momentum. The price is between the middle and lower Bollinger B
post-image
RUNE-4.78%
DOGE+1.28%
IOST-5.19%
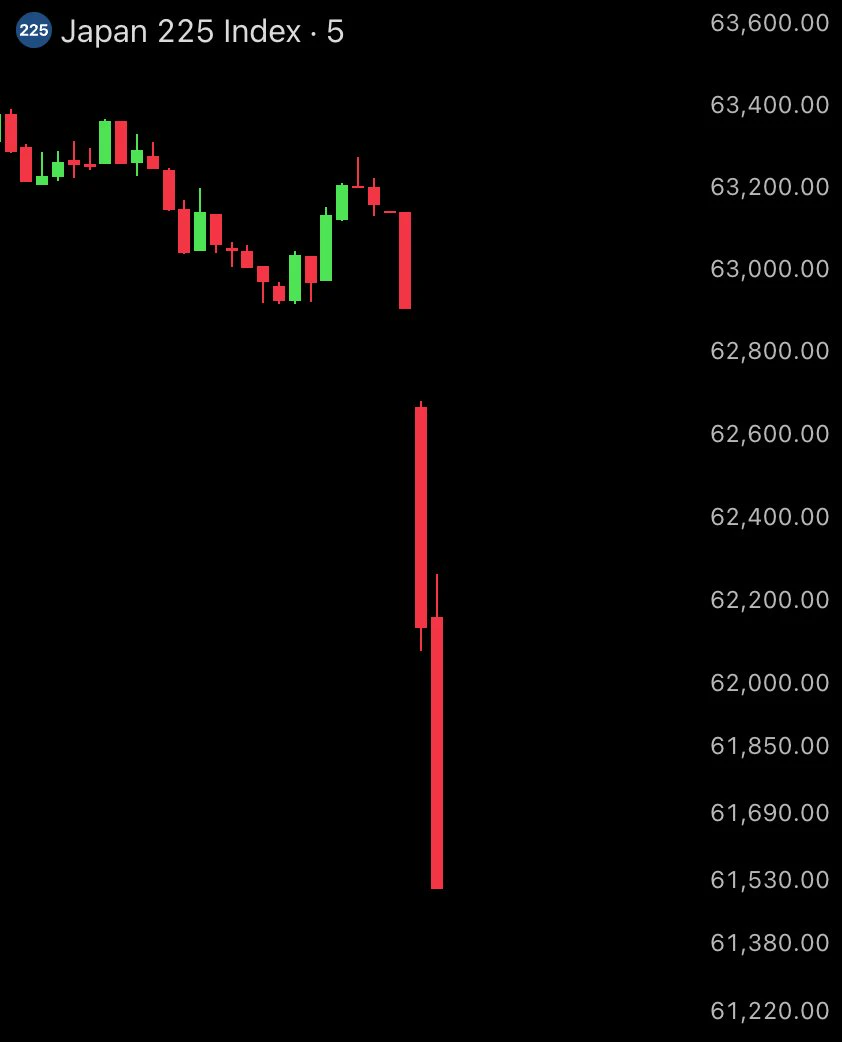
The Nikkei plunged after inflation came in above expectations.
#bitcoin #kripto
post-image
BTC-0.33%
Load More

Join 40 M users in our growing community

⚡️ Join 40 M users in the crypto craze discussion

💬 Engage with your favorite top creators

👍 See what interests you

Trending Topics

USEarningsSeason

4.51k Views2.73k Discussing

The U.S. Q3 earnings season is in full swing, with major tech companies including Tesla and Meta reporting results. Market focus is shifting beyond revenue and profit toward AI spending, capital expenditure, margins and forward guidance. Which company’s earnings are you watching most closely?

GateWCTCS9GlobalTradingCompetition

404.74k Views7.58k Discussing

BTCDropsBelow81000

46.25k Views37.97k Discussing

View More