Square
Following
Hot
News
Profile
Share your thoughts
placeholder
Article
BTC UPDATE
live-cover
LIVE17
Let’s start with a term: weekend gold prices.
The $XAU on screen isn’t gold moving now; it’s quotes with no takers shifting around.
Only 5.97 million traded in the last hour, compared with 150 million in a single hour a few days ago.
“Breaking above 4205 means a new rally.”
I’ve heard that twice in the past three days. Here are the numbers:
1. 4205.65 was touched only once, at 10-16 22:00, and it hasn’t gone higher since.
2. Since then, over the past 34 hours, it has steadily ground back to 4164.07.
3. The 24-hour range is 4157.36 to 4173.66, a spread of 0.39%.
With a range this narrow, it’s
post-image
XAU-0.19%
Trenches
AGT
A
bade
b
AGT
0x5d...e274
Market Cap
$.
Change
.
24h Vol
$.
Holders
.
CNPY
C
bade
b
CNPY
0xc6...ddd2
Market Cap
$.
Change
.
24h Vol
$.
Holders
.
COVENANT
C
bade
b
COVENANT
0xcd...de79
Market Cap
$.
Change
.
24h Vol
$.
Holders
.
Q
Q
bade
b
Q
0xc0...0589
Market Cap
$.
Change
.
24h Vol
$.
Holders
.
Gato
G
bade
b
Gato
55A3...pump
Market Cap
$.
Change
.
24h Vol
$.
Holders
.
Something doesn't look right. $AVA is currently at 0.3957, up 34.73% in 24 hours, but look at this candle—the low was 0.2810, the high was 0.4226, a 50% swing, with $72.9M in trading volume. This isn't normal turnover; someone's aggressively sweeping up.
Three possibilities: first, someone positioned early in the derivatives market, with spot buying helping push the price up; second, low-priced holders have finished rotating their positions, and the whales are testing the selling pressure above; third, it's a pure sentiment-driven short squeeze, with 24-hour volume piling above $70M as short-
AVA+37.11%
Most people are watching silver and waiting for a breakout. I think it needs to take a dip first. That congestion zone from a year ago still hasn’t overlapped with anything, leaving a small gap in the structure. If it really moves up from here, that would be interesting. The iHnS on gold lines up too. The hardest part of trading isn’t calling the direction—it’s waiting for a signal you can actually understand. So what’s the takeaway? I haven’t figured it out yet either. If you’re keeping an eye on this, give me a follow.
post-image
XAG-0.23%
GLDX-0.86%
PAXG-0.20%
XAU-0.19%
#DOGE #WCTCS9 Dogecoin May See Its First Major Daily Death Cross of 2026: Is a Potential Trend Reversal Coming?
A potential trend reversal could offset bearish pressure and invalidate the current pattern.
Dogecoin could see its first daily death cross of 2026 as moving averages suggest they will converge in the coming days. The daily 50-day moving average is currently trending downward, while the daily 200-day moving average is flattening, highlighting the potential for a death cross. Dogecoin saw its first daily golden cross since 2026 in October, but profit-taking in the crypto market drove
post-image
ThisIsTranslateContent:
#DOGE #WCTCS9 Dogecoin may see its first major daily death cross of 2026: Is a potential trend shift approaching?
A potential trend shift could counter bearish pressure and invalidate the current setup.
Dogecoin could see its first daily death cross of 2026, as moving averages point to convergence in the coming days. The daily 50-day moving average is currently sloping downward, while the daily 200-day moving average is flattening, highlighting the potential for a death cross. Dogecoin saw its first daily golden cross of 2026 in October, but profit-taking in the crypto market drove its price down to a low of $0.077. Bears seem to be making an aggressive effort to negate this bullish signal, with the possibility of a death cross drawing near.
The timing of a death cross remains uncertain, as a trend shift could counter the bears’ push and invalidate the current pattern. At the time of writing, Dogecoin was up 3.19% over the past 24 hours to $0.081, after briefly selling off as investors weighed higher-than-expected inflation data and the latest remarks on interest rates from Fed Chair Kevin Warsh.
Inflation data released this week was strong: the Producer Price Index released Thursday showed wholesale prices rose 6.3% year over year in September, the biggest increase since 2022. The Consumer Price Index also rose in data released Wednesday. Fed officials responded in September by approving the first rate hike in more than three years; markets expect the Fed to hold rates steady in October and hike again in December.
Could a trend shift be coming? The last time Dogecoin saw a death cross on the daily chart was in November 2025, followed by months of selling until a golden cross appeared recently. This has focused market attention on price action in case a death cross ultimately appears again.
Crypto analyst Ali recently posted a contrarian take on X, sharing three reasons to be bullish on Dogecoin.
First, the TD Sequential indicator has previously marked potential turning points for Dogecoin several times, and this time it issued a buy signal on the daily chart as the price neared $0.081.
Second, URPD data shows that about 36 billion DOGE previously traded near $0.081.
Third, whales appear to be buying near this support level, having accumulated 600 million DOGE since October 12.
If $0.081 holds and Dogecoin rebounds, Ali identifies the $0.16 to $0.17 range as a potential profit-taking zone. $DOGE
repost-content-media
DOGE-1.74%
‍#每周来晒 #WCTCS9
Preview of Next Week’s Major Financial Events
2026-10-19 (Monday)
10:00 China’s Q3 GDP, September industrial value added, fixed-asset investment, and total retail sales of consumer goods
22:00 US October NAHB Housing Market Index
2026-10-20 (Tuesday)
09:15 China’s October LPR quotation 17:00 Eurozone October ZEW Economic Sentiment Index 20:30 US September housing starts and building permits
22:00 US September pending home sales index MoM
NVIDIA GTC conference (10.20–10.22)
2026-10-21 (Wednesday)
16:00 UK September CPI YoY
22:30 US EIA crude oil inventories for the week ending O
post-image
NVDA-1.42%
TSLA-2.17%
SPGI+1.13%
Everyone, $AVA is showing signs of rejection after a sharp rally, with resistance strengthening around $0.383–$0.400. If sellers take control, a deeper pullback may follow.
$AVA — Short entry: $0.3830–$0.3900 Take-profit 1: $0.3600 Take-profit 2: $0.3400 Take-profit 3: $0.3142 Stop-loss: $0.4112 Will AVA pull back further, or break back above resistance?
post-image
AVA+37.16%
Set it up this way to automatically clean up 99% of comments.
Next week: October 19 (Monday) — October 25 (Sunday) Daily Macro + Geopolitical Preview

Sources: CCTV, Cailian Press, Federal Reserve website, public schedules

✅October 19 Monday
📊Macro: The Financial Street Forum Annual Conference opens, with senior officials from the PBOC, SAFE, and CSRC delivering policy speeches; the Federal Reserve holds a closed-door discount rate meeting
🌍Geopolitics: Ukraine-U.S. talks may begin; the European Parliament opens discussions on Black Sea shipping security

✅October 20 Tuesday
📊Macro: China announces its LPR loan prime rate; closed-door meeting of F
Online Lending Life with a market cap of 110k—are you sure you don't want to buy?
$PI If you insist on holding and refuse to sell, capital will insist on staying out of the market. The price will keep fluctuating, wearing you down until you’re completely broke—then let’s see if you’ll finally cut your losses. Capitalists have plenty of money and no urgency. But you’re poor and need money for all sorts of things; you can’t wait.
Someone asked, “When will it go up?” A rise may only happen after all of you have sold the coins you’re holding.
post-image
PI-1.05%
  • 3
BTC at $81,303, ETH at $2,392, SOL at $103: Volume-price differences across three bearish candles
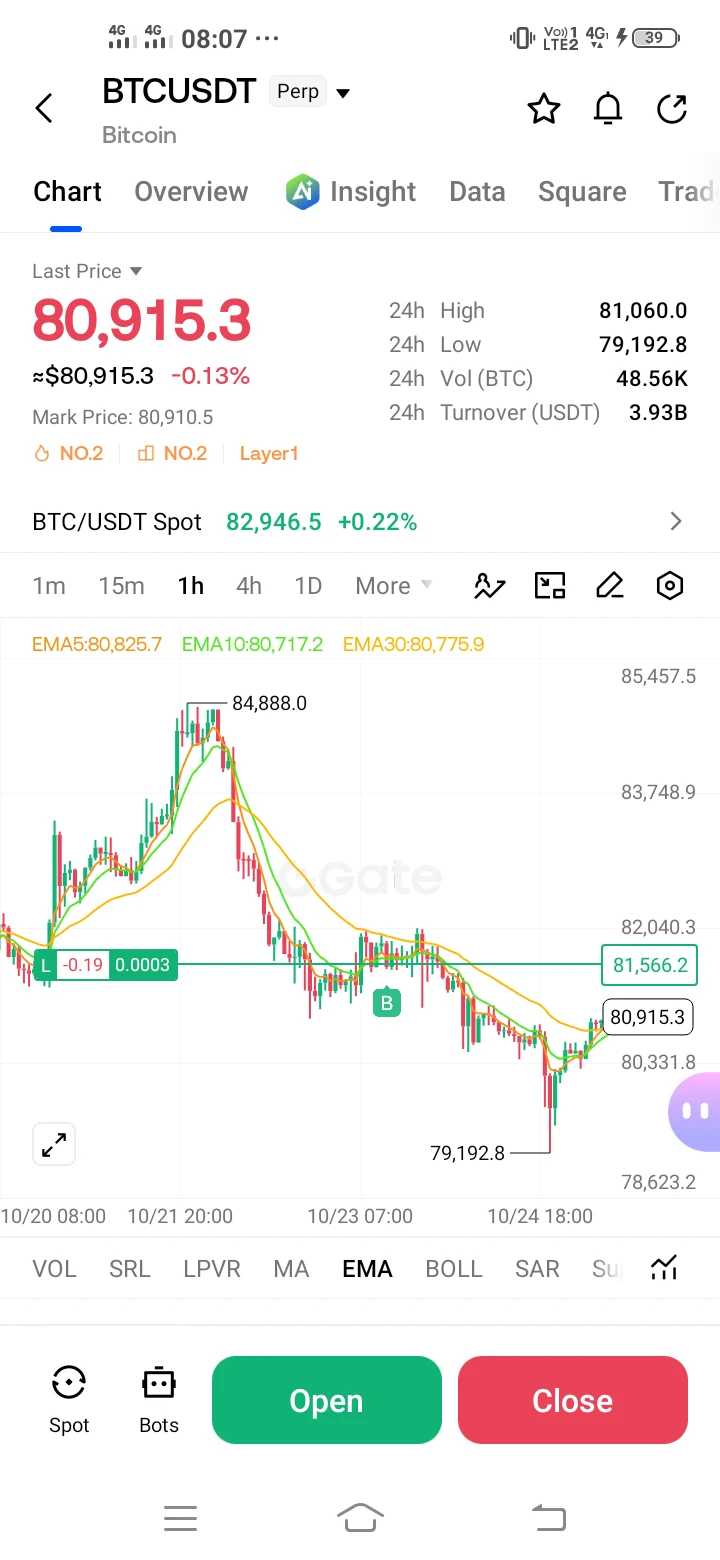
📊 Gate spot snapshot (October 17, 23:08 UTC): three bearish candles, but the declines are nowhere near the same magnitude: BTC -0.54%, ETH -1.33%, SOL -1.35%. BTC edged down, while ETH and SOL fell more than twice as much.
First, BTC. The current price is 81,303.2 USDT, with a 24-hour high of 81,791.5 and a low of 80,817.0. The day's range is less than 1.2%, with a trading volume of 233 million USDT. The price is hovering in a narrow range just above 81,000, and the 80,817 low has not been breach
post-image
BTC-0.21%
ETH-0.88%
SOL-1.08%
$USD1 has reached 1.0003USDT, but hourly trading participation is only 0.30x, making the move look somewhat weak. The price has moved, but volume has not followed. In this situation, focusing only on candlestick colors can easily lead you to overestimate the move’s staying power. The price has already broken above the 1-hour support at 1.0001, while the 1-hour resistance at 1.0004 still lies ahead. This looks more like a tentative breakout than the start of a genuine trend.
If 1.0004 is actually broken, the credibility of this rally will improve significantly. But low participation currently u
post-image
USD1-0.01%
Why are you diving so fast, $BTW ? You were doing just fine a minute ago.TP: 2.23SL: 2.5683Also active:$AVA : Current Price 0.4065 - 24h Change: +38.59%$ETH : Current Price 2,400.35 - 24h Change: -0.83%
post-image
BTW+25.95%
AVA+37.11%
ETH-0.88%
market update
live-cover
LIVE29
#日韩股集体大跌
KOSPI +3.3%: A relief bounce or the start of a recovery?
My initial assessment: This appears to be a potential relief rally; however, a single strong session is not enough to confirm a broader recovery. The key question is whether semiconductor stocks can sustain this rebound following the sharp sell-off, or if the gains are merely driven by short covering and bargain hunting.
The gains seen in Samsung Electronics (+3.6%) and SK Hynix (+3.4%) are particularly significant, as the South Korean market is highly sensitive to semiconductor sentiment and the global AI-memory trade.
What is
post-image
ybaser
#日韩股集体大跌
KOSPI +3.3%: A relief bounce or the start of a recovery?
My initial assessment: This appears to be a potential relief rally; however, a single strong session is not enough to confirm a broader recovery. The key question is whether semiconductor stocks can sustain this rebound following the sharp sell-off, or if the gains are merely driven by short covering and bargain hunting.
The gains seen in Samsung Electronics (+3.6%) and SK Hynix (+3.4%) are particularly significant, as the South Korean market is highly sensitive to semiconductor sentiment and the global AI-memory trade.
What is driving the recovery?
1. The sell-off may have overshot the fundamentals
On October 15, the KOSPI fell by 7.57%, closing at a six-month low following seven consecutive days of losses. During this sell-off, Samsung and SK Hynix lost 23.9% and 31.5% of their value, respectively—creating an opening for bargain hunters to return.
2. Memory chip fundamentals remain supportive
Analysts continue to highlight tight memory supply, robust demand related to artificial intelligence, and expectations for rising DRAM prices. This supports the view that the sell-off was driven more by sentiment and positioning than by a collapse in earnings expectations.
3. Global risk appetite has improved
A recovery in U.S. equities, combined with easing concerns regarding AI-related credit risks, has helped fuel a rebound in Asian technology stocks. However, concerns regarding returns on investment in artificial intelligence, financing costs, and interest rates have not dissipated.
A relief rally or a sustainable recovery?
Bullish scenario — a lasting recovery
* The KOSPI remains above its recent low.
* Samsung and SK Hynix continue their recovery.
* Foreign investors return as net buyers.
* Earnings forecasts and expectations for memory chip prices remain robust.
Bearish scenario — a short-lived rebound
* The index rises toward a resistance level and then reverses.
* Foreign investors continue to sell Korean stocks.
* U.S. bond yields rise, or renewed concerns regarding AI valuations weigh on chip stocks.
* Samsung and SK Hynix fall back below their recovery levels.
What should investors watch for next?
The most critical indicator is not the magnitude of the initial rebound, but whether buying pressure is sustained.
Indicator Bullish interpretation
Foreign investor flows Consistent net buying
Samsung and SK Hynix Gains sustained over several sessions
Memory chip pricing Continued strength in DRAM and HBM
U.S. Treasury yields Stabilization or decline
Earnings expectations Maintenance of upward revisions
A key distinction: On October 16, the KOSPI recorded an intraday gain of up to 3.17%, but closed the day up 2.05% at 5,668.05. Consequently, the sharp intraday rally made the final gain at the close appear more significant than it actually was.
My View
Short-term: Cautiously optimistic
A recovery is possible.
Oversold conditions and attractive entry points could support further gains, though volatility is likely to remain high.
Medium-term: Conditional
Not yet confirmed.
A more substantial recovery would require the stabilization of foreign investor inflows, supportive earnings data, and a more durable improvement in sentiment toward the global technology market.
In summary: I view the 3.3% move not as proof that the downtrend has ended, but as a promising first step. Earnings expectations for the semiconductor sector provide a firmer foundation for this recovery—moving it beyond a mere technical rebound—but the market must demonstrate that buyers are willing to hold their positions, even amidst renewed volatility.
A key factor to watch in the near term will be the earnings outlooks from SK Hynix and Samsung Electronics, set to be released on October 28 and October 29, respectively. These reports could prove decisive in determining whether the recent sell-off was an overreaction or if it reflects a more fundamental reassessment of the AI-driven memory market.
$MU ‌
$SNDK ‌$NVDA ‌
repost-content-media
  • 3
#NEARJumpsNearly10% #ShareWeekly
INFLATION SHOCK, BITCOIN AT $82K, NEAR’S RALLY, AND NVIDIA: WHAT COMES NEXT FOR THE CRYPTO MARKET?
The financial markets are entering a critical phase where inflation, Federal Reserve policy, technological innovation, and speculative trading are shaping investor sentiment. The latest U.S. Producer Price Index (PPI) data has challenged expectations of a smooth monetary easing cycle, while Bitcoin’s recovery toward $82,000, NEAR Protocol’s nearly 10% surge, and renewed meme-coin speculation reveal a market full of contrasting signals.
1. U.S. PPI: Inflation Rema
BTC-0.21%
NVDA-1.42%
MEME-3.50%
TSLAX-0.80%
TOKEN-2.05%
2015 — Buy
2016 — Hold
2017 — Sell
2018 — Bear market
Cycle 3 (2019-2022)
2019 — Buy
2020 — Hold
2021 — Sell
2022 — Bear market
Cycle 4 (2023-2026)
2023 — Buy
2024 — Hold
2025 — Sell
2026 — Bear market ← We are right here
Cycle 5 (2027-2030)
2027 — Buy
2028 — Hold
2029 — Sell
2030 — Bear market
post-image
  • 1
solana:EEpng77ZPn9FT4xsRjwuxNCcMBYq3HTwEscyTpump buy now big break out is near
This is another solana:Hg5Ja55T5wESq4vyFoiVCMeHXtGyVA69X2UHq8hgpump coin it will 10x
post-image
SOL-1.08%
🤖 NEW PREDICTION MARKET: Can Gemini 4 Argon (High) finish first on Oct. 19?
Gemini 4 Argon (High) leads at 93.5% in the Oct. 17 snapshot. Rivals need an eligible Text Arena entry; the noon ET ranking decides the result.
post-image
Load More

Join 40 M users in our growing community

⚡️ Join 40 M users in the crypto craze discussion

💬 Engage with your favorite top creators

👍 See what interests you

Trending Topics

USSeptemberPPIBeatsExpectations

91.35k Views1.93k Discussing

US September PPI came in at 6.3% YoY, well above the 5.3% market expectation, pointing to renewed producer-side inflation pressure. Weekly jobless claims were 199K, broadly in line with forecasts. Could hotter inflation further reduce room for rate cuts, and what does it mean for $BTC, US stocks, and gold?

GateWCTCS9GlobalTradingCompetition

37.87k Views6.68k Discussing

GateBTCAndETHFuturesVolumeRanksTop3

53.8k Views1.81k Discussing

View More