Square
Following
Hot
News
Profile
Share your thoughts
placeholder
Article
🌐 ONEA NETWORK—Building around real needs.
Where does the value of a digital ecosystem come from?
It’s not just technology.
Not just attention.
And not just how many platforms it connects.
The question worth considering is actually quite simple:
Can it solve problems people face in real life?
Users want more convenient payments.
Businesses want to reach customers more effectively.
Creators want to serve audiences around the world.
Communities want to build meaningful connections.
Everyday users want digital experiences that are simple and reliable.
These needs don’t disappear when market tren
post-image
$EACC is about to be delisted, and its market cap will soon hit zero. Going long on this dumbass shit cost me a few hundred bucks—fucking disgusting. The scumbag market maker has already cashed out, making less than $2 million. What a fucking lack of vision
post-image
EACC-15.49%
Trenches
AGT
A
bade
b
AGT
0x5d...e274
Market Cap
$.
Change
.
24h Vol
$.
Holders
.
CNPY
C
bade
b
CNPY
0xc6...ddd2
Market Cap
$.
Change
.
24h Vol
$.
Holders
.
Q
Q
bade
b
Q
0xc0...0589
Market Cap
$.
Change
.
24h Vol
$.
Holders
.
Gato
G
bade
b
Gato
55A3...pump
Market Cap
$.
Change
.
24h Vol
$.
Holders
.
TSI
T
bade
b
TSI
AcV6...pump
Market Cap
$.
Change
.
24h Vol
$.
Holders
.
Hey babes, good morning and happy weekend
Feels like autumn is deepening
Leaves cover the ground🍂
A sudden realization:
Time is the best answer~
What are you all planning to do today?
post-image
AI top-up free agent recruitment ends today🎉
Register on the website to automatically unlock premium agent wholesale prices
Plus 111r
pro5x 630r
pro10x 1050r
30-day warranty, invoices supported🧾, upgrades supported
Those with resources but no supply can set up a sub-site. Due to the large number of current users, setting up a sub-site costs 10 yuan. The blogger operates the store and provides an independent domain name; you only need to add your markup and sell
Portal:
#USSeptemberPPIBeatsExpectations
🚨 US September PPI Beats Expectations: A Major Signal for Markets! 📊🇺🇸
The latest US Producer Price Index (PPI) report is attracting significant attention across global financial markets as producer inflation comes in stronger than expected. This development puts inflation trends, Federal Reserve policy, Treasury yields, the US dollar, and risk assets back in the spotlight.
📈 Why Does PPI Matter?
The Producer Price Index measures changes in the prices businesses receive for their goods and services. Because producer costs can influence consumer prices ove
post-image
BTC+0.36%
ETH-0.28%
  • 4
  • 1
#KOSPIJumps3.3% 📈🇰🇷 | South Korea’s Stock Market Strikes Back!
After a brutal sell-off, South Korea’s KOSPI delivered a powerful rebound on October 16, climbing as much as 3.31% to 5,738.18 during the session. The bounce followed a 7.57% plunge the previous day that rattled investors and triggered a temporary trading halt.
🔍 What Fueled the Recovery?
🇺🇸 Wall Street offered relief: Gains in US equities helped restore some confidence across Asian markets.
💻 Chip stocks bounced: Samsung Electronics and SK Hynix recovered as investors r
post-image
  • 1
#美股存储板块跌幅扩大 Friday's session gave me a clear answer on how deep this storage selloff really is, so I rebuilt my sector notes from the numbers. Here is where I stand after the close on October 16.
The damage is big. Micron fell 5.63% on Friday and 14.6% on the week, while SanDisk dropped 6.85%, Western Digital about 7% and Seagate more than 7%, with the storage chip index down 17.6% on the week. SanDisk closed at $1,299.30, its seventh lower close between October 8 and October 16. Against its June high close of $2,335, that is about 44% lower by my math.
The bigger picture is even harsher. Six
Falcon_Official
#美股存储板块跌幅扩大 The Nature of the U.S. Tech Pullback Is Shifting: From Valuation Repricing to Credit-Chain Repricing
Many people are still viewing U.S. stocks through the old “AI pullback = buying opportunity” playbook. But if you only watch the Nasdaq and the Philadelphia Semiconductor Index, you may miss the most important change:
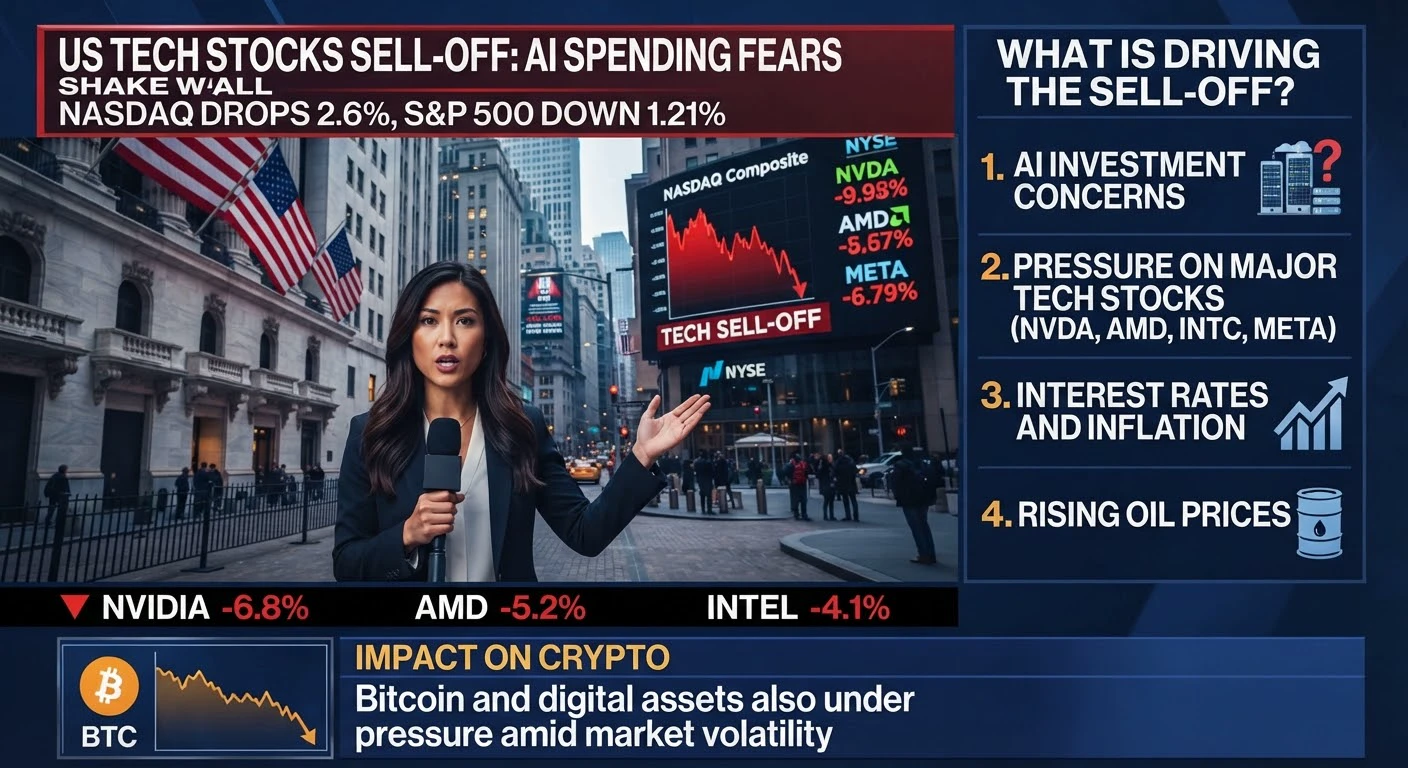
July was “AI valuation/positioning repricing”; October is a triple hit from “the AI credit chain + high interest rates + geopolitics/oil prices.” The latter is closer to a “credit-side preview” of the bursting of the 2000 internet bubble, but we’re not yet in a full-blown bear market.
I. July pullback: Expensive, crowded, but no blowup!
Trigger: Google/Meta/Tesla raised CAPEX forecasts, FCF turned negative, and the market asked, “When will AI spending pay off?”
QQQ fell from a June high of ~$748.65 to a July 29 low of $661.14, a peak-to-trough decline of 11.7%; QQQ fell 6.5% for the full month of July, and SOXX fell 21%.
The 10-year Treasury yield was at 4.6–4.75%; the VIX spiked to 20.66 on a weekly basis (+24%), but the broad VIX did not stay above 22. VXN reached 26, but there was no panic spike.
The S&P edged down, while equal-weight stocks rose; money rotated within equities (tech → Dow/healthcare/consumer). Bonds didn’t rally, and yields rose → this wasn’t a flight to safety, but “semiconductors are too crowded, trim them first.”
Outcome: The 200-day moving average at $645 held, and stocks recovered after August. This was a correction that could be bought.
II. October pullback: From “valuation” to “who can’t repay their loans?”
The logic behind this tech pullback since October is more like:
Borrow at a 15% cost to build compute capacity → rental income can’t cover interest → credit cracks appear first → semiconductor order expectations get cut → quite a few sell-side firms are using the 2000 internet bubble as a reference (the Nasdaq crashed, while long-bond yields fell from 6.5% to the mid-4% range).
Market action: It’s not a broad selloff; “highly leveraged growth + AI infrastructure” are being singled out for punishment. From 10/14–10/16, the Dow rose 0.67% for the week, XLV/energy were strong, the SPX fell ~1.95% for the week, and the Nasdaq fell 4.48% for the week (its worst since June); the Philadelphia Semiconductor Index (SOX) fell for 8 straight days (the longest streak since 2008);
Among individual stocks: CRWV fell 25% for the week, CDS breached 1000bp, and its 5-year default probability was priced at 60%+.
The 10-year Treasury yield fell from 5.3% to 5.07–5.19%, but this was a safe-haven decline as stocks fell and money fled into Treasuries, not a central-bank rescue; the VIX broke above 22, Brent crude topped 110, and tensions in the Middle East and Russia-Ukraine escalated.
Investor sentiment: the CNN Fear & Greed Index fell to 18, but it’s not yet at the extreme “2–4” levels seen in 2018/2020—meaning the market is shifting from “uncomfortably expensive” to “a little worried about credit,” but this is not a COVID-style liquidity collapse.
III. How have similar “credit-side + tech selloff” pullbacks played out historically?
The 2000 internet bubble burst: The Nasdaq was cut in half, then cut in half again from its peak, while the S&P lagged; valuations were hit first, then earnings, then credit, and bonds ultimately entered a bull market. The difference today: major tech issuers aren’t pure concepts; their cash flows/cloud revenues are real. So this isn’t a repeat of 2000, but “the 2000 credit playbook + the 2022 interest-rate playbook.”
The 2022 rate-driven growth selloff: The 10-year Treasury yield surged from 1.5% to 4.3%, QQQ fell 35% from its peak, and SPY fell 25%; the core issue was the “discount rate,” not credit defaults. The 10-year Treasury yield is now above 5%; megacaps are hurting, but banks/consumer/healthcare haven’t collapsed.
2018 Q4 deleveraging: The VIX spiked to 35, QQQ fell about 20% for the quarter, and stocks made a V-shaped recovery after the Fed turned dovish; the Fed isn’t as hawkish now, but inflation + oil prices mean it can’t turn dovish freely.
March 2020 liquidity black hole: The VIX hit 80, and stocks, bonds, and gold all fell together, with the Fed providing a backstop; there’s no COVID-style liquidity freeze now, and CRWV is an individual credit event, not a market-wide counterparty crisis.
Historical rules of thumb
“VIX above 20 + 10-year Treasury yield rising + tech leading declines” → usually the middle of a pullback, not the bottom.
“VIX plateauing at high levels + 10-year Treasury yield starting to fall + semiconductors no longer making new lows” → only then is it a signal to add to QQQ.
Until credit events (CDS widening, high-yield bond spreads widening) stabilize, every QQQ rebound is prone to being sold.
Historical timing reference: the July pullback took 3–5 weeks to recover; with an October-style “credit + rates + geopolitics” combination, a bottom usually isn’t in until the VIX returns to 16–18, CRWV bonds stop falling, and SOXX posts a high-volume candle without making a new low. This often takes 3–8 weeks; if credit spreads widen to Oracle/major tech bonds, it can drag on for a quarter.
IV. The counterintuitive point during earnings season: stock prices are falling, but earnings haven’t collapsed. In the first week of the new 26Q3 earnings season, about 9% of large S&P 500 companies had reported earnings. Stock prices are falling, but earnings haven’t collapsed—the declines reflect “discount rates + credit expectations,” not “current results.”
Companies that have reported: earnings up 29% year over year, revenue up 12.6%;
26Q1 earnings up 28.6%, 26Q2 up 50.4% → the strongest earnings cycle since 2021Q2;
Market pricing for full-year 2026: earnings up 32.8%, revenue up 12.7%;
Q3/Q4 earnings expectations: +29% / +28.6%;
The S&P’s forward P/E is 19.0: below the 10-year average of 19.1 and the 5-year average of 19.8.
This isn’t an “earnings collapse”; the market is getting ahead of three fears:
① AI CAPEX returns in 2027 will fall short of expectations;
② 10-year Treasury yields at 5%+ will discount long-duration assets;
③ AI credit-chain players like CoreWeave will blow up first.
So this is neither 2000 (earnings fraud/disappearance) nor 2022 (earnings downgrades + interest-rate battering). It’s “earnings are very strong, but valuation logic is being repriced for credit risk.”
V. Why is the week of October 19–23 a turning point?
This isn’t an ordinary earnings week. It’s a week to “use real-economy cash flows to rescue tech valuations.”
1) Wednesday’s two pillars: META + TSLA
What to watch for in META:
Will CAPEX be revised higher again, how are advertising/AI monetization progressing, and what is happening with free cash flow?
If it says “we’re continuing to invest more in AI, but ROI is clear” → it eases July-style spending concerns;
If it says “returns are slower than expected” → QQQ could sell off again.
What to watch for in TSLA:
It’s not just a car company; it’s a high-beta proxy for “AI / robotics / energy storage.”
Deliveries, gross margin, FSD, and what it says about Optimus matter more than sales volume.
A weak TSLA → high-beta tech sentiment could collapse again.
2) Industrial / defense / payments: proof that “the non-AI parts of the economy are holding up”
GE, RTX, NOC, LMT, MMM, UNP, CAT names (URI), AXP, COF:
Industrial orders = the temperature of the real economy;
Credit cards (AXP/COF) = consumer resilience and delinquencies;
Defense (RTX/NOC/LMT) = a geopolitical premium, but with budget constraints.
If they hold up, investors will be more willing to stay in SPY / XLI / XLV rather than go back to catch the falling knife in QQQ.
3) Macro anchors
Tuesday: housing starts / existing-home sales → has housing frozen under 5%+ rates?
Thursday: initial jobless claims + leading indicators → are there cracks in employment?
Friday: manufacturing / services PMI → soft landing or a second downturn in manufacturing?
These data will determine whether the 10-year Treasury yield holds 5.0% or surges to 5.3%–5.5%, and will directly determine the discount rates for SPY / QQQ.#WCTCS9
MU-5.66%
STX-7.45%
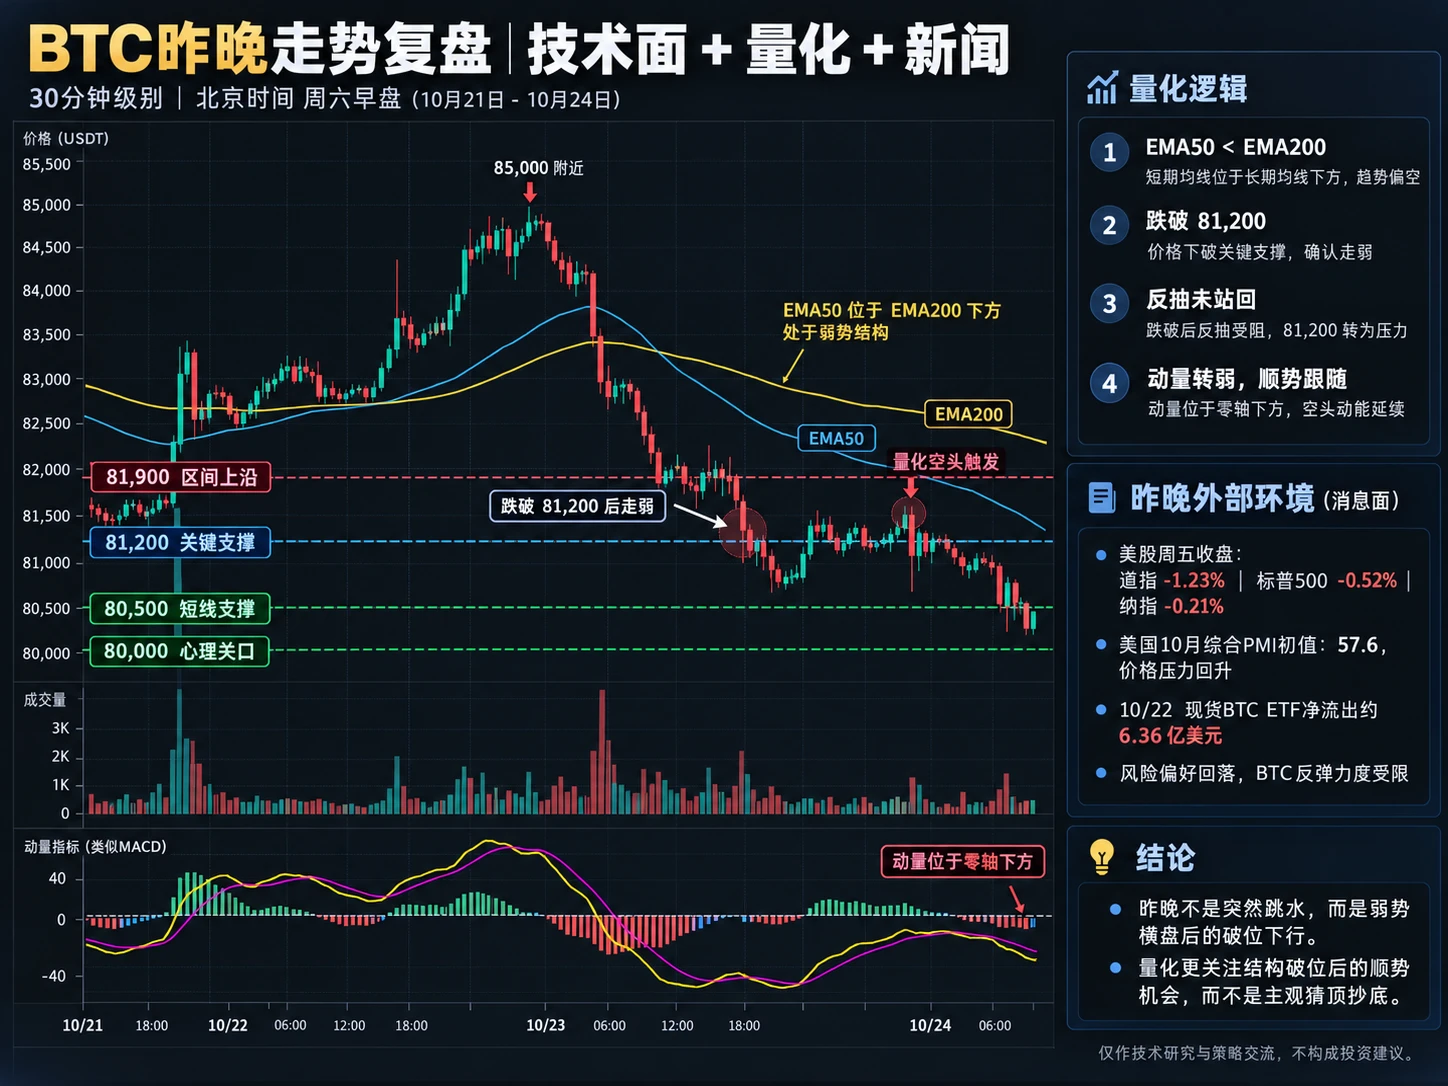
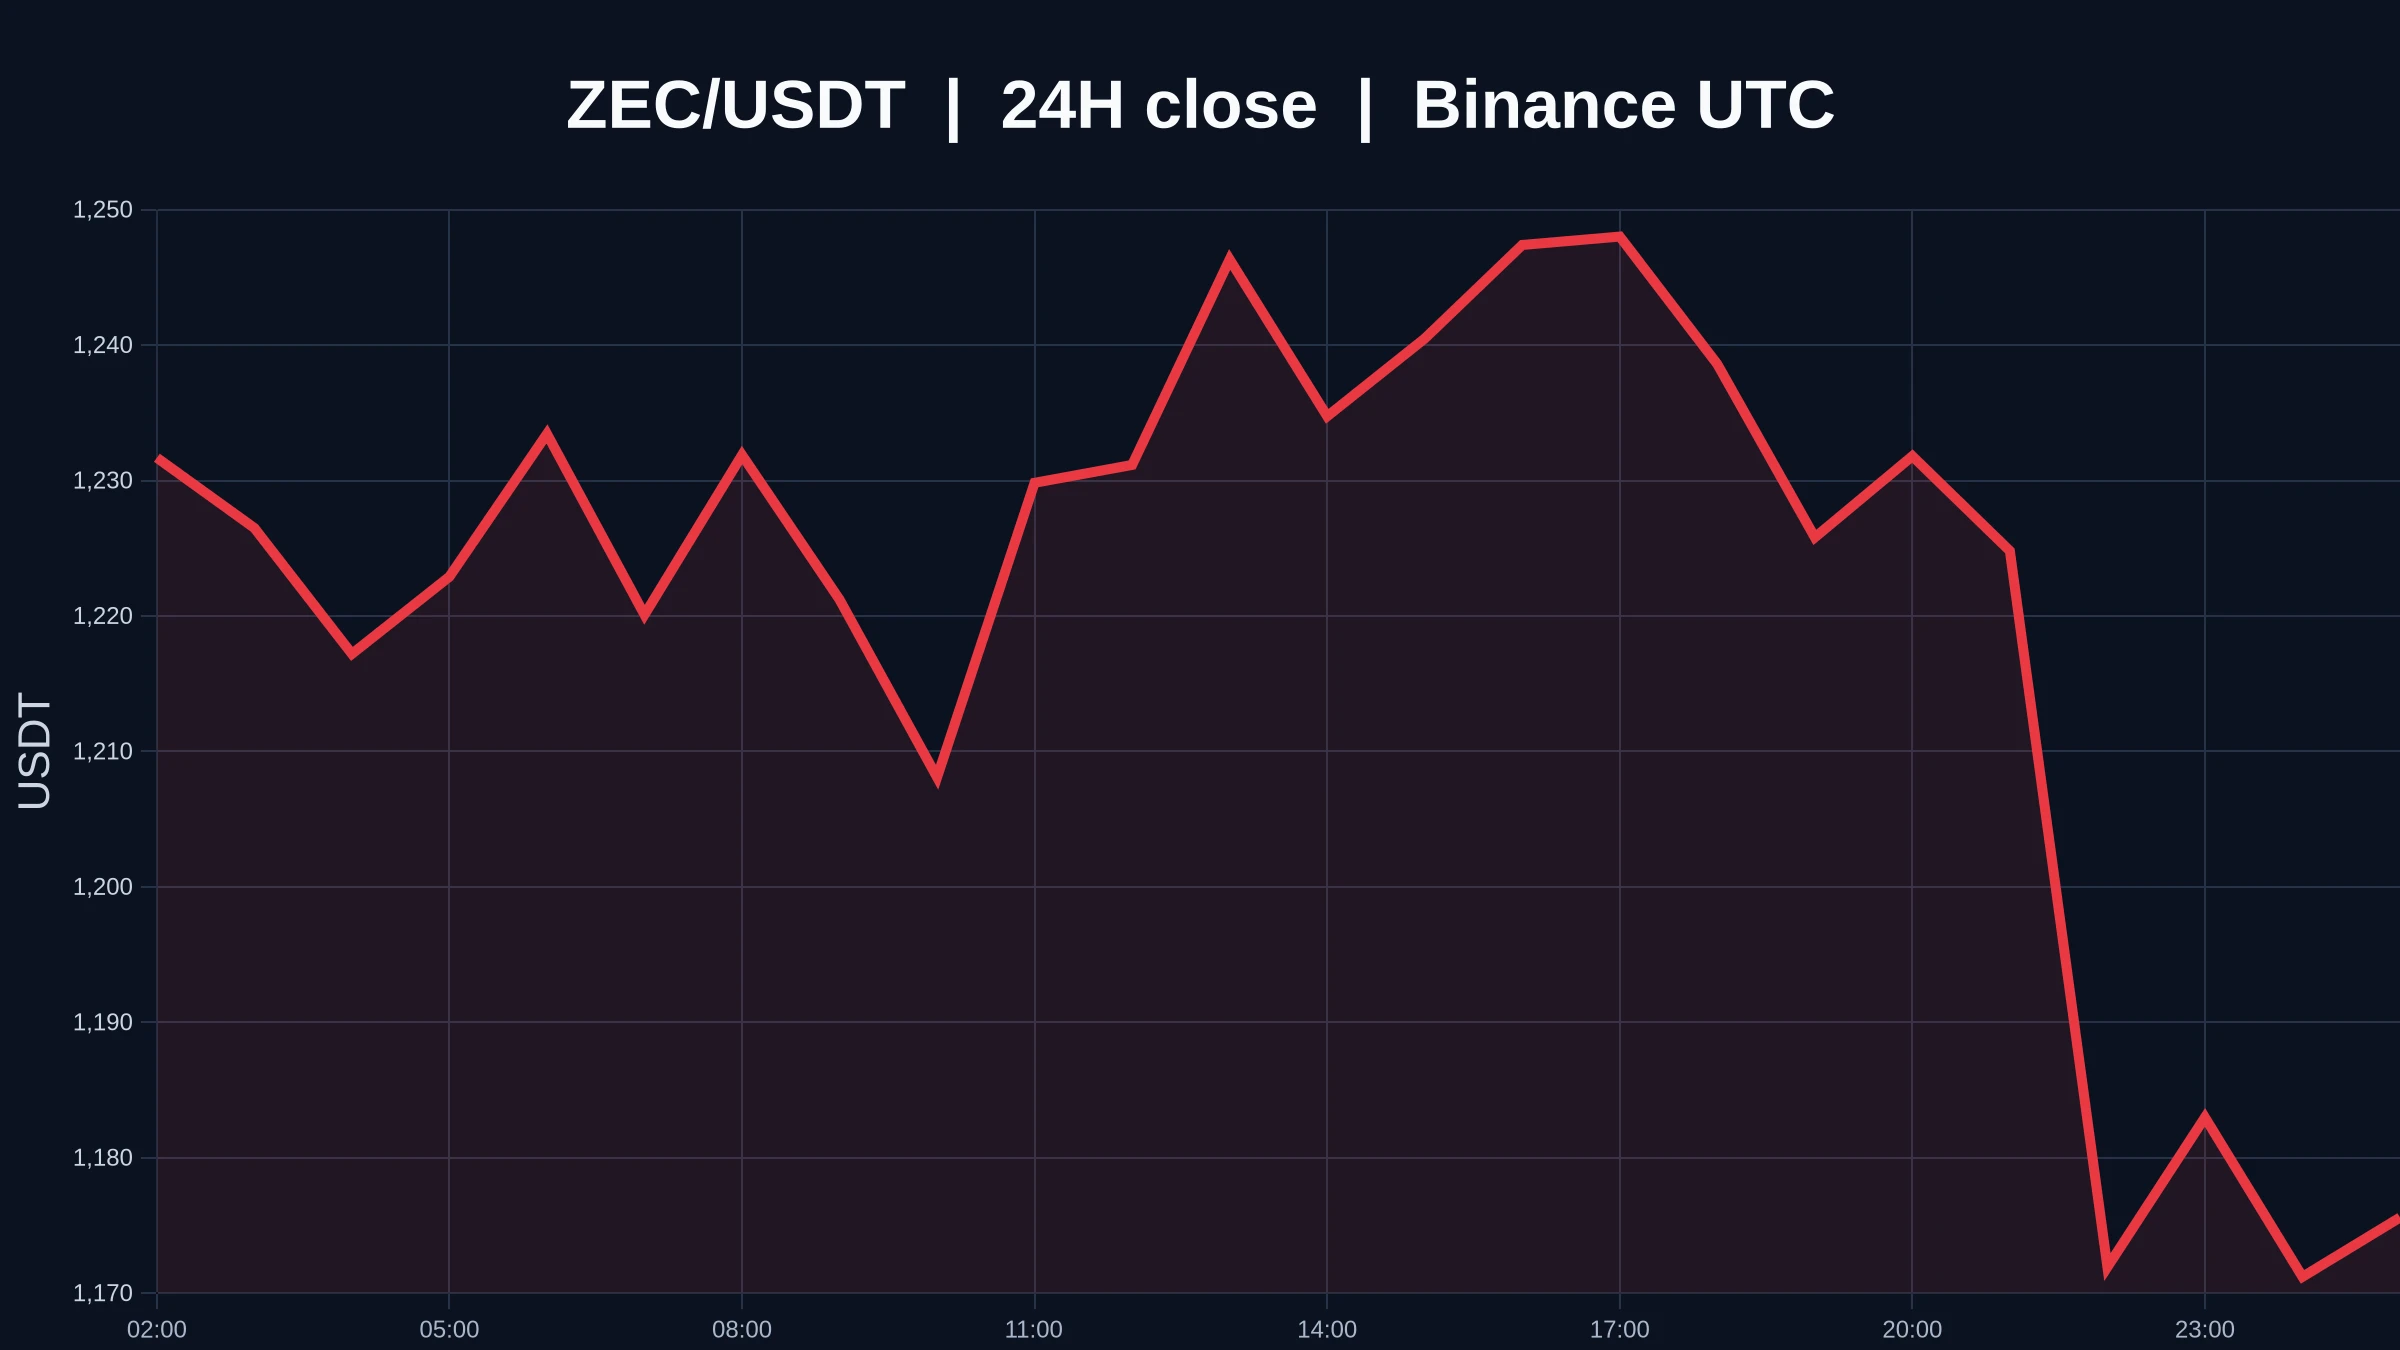
Saturday strategy: BTC long at 81000, in profit; zec long at 1120, in profit; ETH long at 2373, added to the position at 2353, in profit
BTC+0.36%
ZEC-0.03%
BTC Mining vs AI: Who Uses More Power? #GateLiveStreamingInspiration۔
live-cover
LIVE159
Most of the people arguing and cursing here are speculators. If you're a pioneer of mobile mining, just wait if there's no hint; if there is, accumulate if you want or sell if you want—why all the fuss? There are plenty of failed scientist-investors in today's society. From now on, it's no longer the 80/20 rule; it's the 90/10 rule. #pi
PI-0.78%
#Qusdt $Qusdt next t around 0.15
post-image
$BAT Bottom line: The trend has not recovered. Treat the rebound only as a recovery attempt; the bias is bearish. Wait for a rebound into the moving-average resistance zone to scale into short positions, and don't chase the drop.
To judge whether a trend is healthy using moving averages, look at just three things: the price's position relative to the moving averages, the direction of their alignment, and whether they can be decisively reclaimed. MA5=0.17906 is currently below MA20=0.18519, with the short-term average below the long-term average—a bearish alignment. Although the current price o
post-image
BAT-10.24%
HBAR+2.01%
#美股存储板块跌幅扩大
The core question is whether this represents a healthy correction following a rally driven by artificial intelligence (AI), or the beginning of a deeper repricing process within the storage sector. Rather than buying simply because prices have fallen, it would be more prudent to focus on earnings expectations, memory pricing, and whether each company can maintain its profit margins.
My perspectives on storage sector stocks:
* Micron (MU): Monitor demand for DRAM and HBM, memory growth linked to AI, and gross profit margin forecasts. Strong AI demand could bolster earnings, though
post-image
ybaser
#美股存储板块跌幅扩大
The core question is whether this represents a healthy correction following a rally driven by artificial intelligence (AI), or the beginning of a deeper repricing process within the storage sector. Rather than buying simply because prices have fallen, it would be more prudent to focus on earnings expectations, memory pricing, and whether each company can maintain its profit margins.
My perspectives on storage sector stocks:
* Micron (MU): Monitor demand for DRAM and HBM, memory growth linked to AI, and gross profit margin forecasts. Strong AI demand could bolster earnings, though these expectations may already be priced into the stock.
* SanDisk (SNDK): Focus on NAND flash pricing, demand for enterprise SSDs, and the sustainability of any earnings recovery. NAND supply and price cycles can make this stock particularly volatile.
* Western Digital (WDC): Evaluate "nearline" (high-capacity/accessible) HDD demand from AI data centers, cloud computing expenditures, and free cash flow. The factors influencing HDD demand differ from those affecting NAND and DRAM.
* Seagate (STX): As data center storage requirements grow, keep an eye on demand for high-capacity drives, pricing power, and profit margins.
* Track NAND market conditions, enterprise SSD adoption rates, and the company's valuation relative to earnings expectations.
What signs might justify rebuilding a position? I would look at the following three points:
* Stabilization of fundamental indicators: A halt in the deterioration of memory and NAND prices, company forecasts, and earnings estimates.
* Confirmation through price action: Stocks forming higher lows and reclaiming key moving averages, accompanied by stronger trading volume.
* Attractive valuation: Expected earnings growth that justifies the current price, even under less optimistic scenarios.
A decline in a stock price is not, by itself, a buy signal. If earnings estimates are falling faster than the stock price, the valuation may not have actually become cheaper.
Rather than buying the entire storage sector indiscriminately, I prefer to differentiate between individual companies. While AI demand serves as a long-term tailwind, memory, NAND flash, and hard disk drives each have their own unique supply cycles, competitive pressures, and profit margins.
An important distinction: A pullback driven by profit-taking is fundamentally different from one caused by weak forward guidance or falling memory prices. The latter scenario warrants a much more cautious approach. Which of these stocks—MU, SNDK, WDC, or STX—are you following most closely? I can help you compare their valuations, earnings outlooks, technical levels, and the potential factors that could support a recovery.
$MU ‌$SNDK ‌$WDC ‌$STX ‌
repost-content-media
MU-5.66%
SNDK-6.90%
  • 11
  • 1
10.17$ETH
Last night's market action was like riding a roller coaster
Longs launched a fierce attack, then suddenly collapsed, smashing straight through 2400
Upside momentum faded; I cut losses decisively in time, exited at breakeven, and avoided a deep pullback
Price is now stuck in a narrow 2415-2425 range
Moving averages are converging near 2420, with bulls and bears evenly matched
Volatility is under 10 points—the calm before the storm!
The range is tightening and building momentum, with a major one-way breakout imminent
Watch the range closely; once volume expands and direction emerges,
post-image
ETH-0.28%
$FIS • Bullish: Coins moving from exchanges to private wallets means fewer tokens are readily available for sale. If withdrawals are spread across multiple addresses over an extended period, this is generally seen as accumulation or stronger intent to hold, easing short-term selling pressure.
post-image
FIS+26.66%
Too outrageous, $BTW has been pumped way too hard. Lee is preparing to short heavily, anticipating a potential downturn. $AGT Strongly short $Q 🥳🥳🥳
post-image
BTW+15.99%
AGT+9.92%
market updates on today $BTC can BTC breakout 84k again
live-cover
LIVE1,035
Load More

Join 40 M users in our growing community

⚡️ Join 40 M users in the crypto craze discussion

💬 Engage with your favorite top creators

👍 See what interests you

Trending Topics

USSeptemberPPIBeatsExpectations

91.35k Views1.93k Discussing

US September PPI came in at 6.3% YoY, well above the 5.3% market expectation, pointing to renewed producer-side inflation pressure. Weekly jobless claims were 199K, broadly in line with forecasts. Could hotter inflation further reduce room for rate cuts, and what does it mean for $BTC, US stocks, and gold?

GateWCTCS9GlobalTradingCompetition

37.87k Views6.7k Discussing

GateBTCAndETHFuturesVolumeRanksTop3

53.8k Views1.83k Discussing

View More