Square
Following
Hot
News
Profile
Share your thoughts
placeholder
Article
I'm trading on Gate, a top-tier exchange with a 13-year track record. Come join me and dive into the hottest events right now! https://www.gate.com/campaigns/6469?ref=VLARBF1YAG&ref_type=132
post-image
Gold prices pulled back to solid support at the bottom during the early session before rebounding. Those who got in can reduce their positions at the current price first, leaving a small portion to continue targeting 4190-4200! #黄金 #伦敦金 $XAUUSD
post-image
ThisIsTranslateContent:DustyA
October 13 Gold Morning Analysis
Yesterday’s Asian session saw spot gold briefly rise to $4,217 before pulling back from its highs. It then declined steadily during the European and US sessions, reaching an intraday low near $4,154, before edging higher late in the session and ultimately closing near $4,171. On the daily chart, this represented a retracement test of the gains made since last Wednesday.
Fundamentally, gold is still being driven by the tug-of-war between expectations for Federal Reserve rate hikes and the direction of the US Dollar Index. After rebounding yesterday, the US Dollar Index weakened again, but only modestly, failing to provide sufficient upside momentum for gold prices. Meanwhile, US crude oil returned to the $93 level yesterday, while Brent crude rose toward $106. The logic of rising oil prices → stronger inflation expectations → difficulty for US Treasury yields to decline → pressure on gold prices remains unchanged.
Technically, gold prices formed their first bearish candle on the daily chart after two consecutive days of gains, but did not break below the previous breakout platform in the 4150-4160 area. The close also remained firmly above 4170, indicating that this pullback was more of a technical correction than a trend reversal.
In the short-term hourly timeframe, gold prices quickly reclaimed 4170 after retesting 4154, forming a clear long lower-wick structure. The MACD green bars also began to narrow, showing signs of fading bearish momentum; the KDJ indicator formed a golden cross at low levels, while short-term rebound momentum is building.
For today’s trading, it is recommended to focus primarily on buying on pullbacks, with particular attention to whether support in the 4150-4160 area holds. If this area stabilizes and remains unbroken, a small long position may be opened, with a stop-loss below 4140 and a target in the 4190-4200 area.
The above analysis is for reference only and does not constitute any investment advice. Financial markets are highly volatile, and investment involves risks. Please exercise caution when entering the market.#黄金 #伦敦金 $XAUUSD ‌
repost-content-media
XAUUSD+0.40%
#ETH Yesterday’s ETH subscription trade and the precise high-level short position at 2575 shared with everyone in the livestream repeatedly emphasized that ETH had not finished falling; after reducing the position, it could continue to be held. This morning brought us a surprise😂, directly capturing over 100 points in profit!🎉🎉🎉
Congratulations to everyone who kept pace.
ETH-1.42%
  • 1
$ENA Current price is 0.2123, with the two key short-term levels at 0.2072 and 0.2191. The price is currently between MA5 and MA20, with MA5 below MA20, forming a typical unrepaired bearish alignment—this is exactly the method I want to discuss today: using the “relative position + slope” of moving averages to determine whether a trend is healthy, rather than looking only at price gains or losses.
A healthy uptrend requires MA5 to cross above MA20 and continue running above it, with both lines moving upward in sync. ENA’s current MA5=0.2072 remains below MA20=0.2191, indicating that the medium
post-image
CTK-0.67%
Bitcoin’s first price level has arrived. Let’s see whether there’s resistance here—no need to say more.
post-image
BTC-0.28%
#韩股大跌你会抄底吗 #每周来晒 Godlike in the rally, burying investors in the selloff: A complete review of the Korean stock market’s wild ride
Among the world’s major markets this year, South Korea’s stock market has been the most dramatic: In June, the KOSPI index surged to an all-time high of 9,385 points; just four months later, the index fell below 6,500 points, with a maximum drawdown of over 30%. It fell 33% in July alone, the worst monthly performance on record—worse than any single month during either the 1997 Asian financial crisis or the 2008 global financial crisis. The prevailing market explana
  • 2
#GateWCTCS9GlobalTradingCompetition
WCTC S9: 6 Million USDT on the Line — Teamwork, Strategy, and the Pressure to Perform
A trading competition is easy to enter, but staying competitive when every decision affects your ranking is a different challenge. That is what makes WCTC Season 9 interesting to me. With a total prize pool of 6,000,000 USDT, Gate’s global trading competition brings together individual traders, organized teams, and participants competing in fast-paced event contract battles.
What stands out is that this competition is not built around a single way to participate. Different
post-image
GT-1.63%
☀️ GM! Korean stocks are sliding. Time to buy the dip? 📉
KOSPI is under pressure, with Samsung Electronics and SK Hynix among the chip stocks taking a hit.
📌 Today's topic: Korean stocks sell off — opportunity or warning sign?
📉 Temporary pullback or a bigger trend shift?
💻 Are semiconductor giants worth watching at lower prices?
👀 Buying the dip, waiting for stability, or staying out?
Markets move fast. Your perspective matters.
🎁 Share your take on Gate Square and claim a red packet for posting, with bigger bonus red packets dropping at random. Quality posts may also get featured and r
post-image
  • 6
  • 5
#btc
If institutions want to defend the price, let them buy—sell it all to them. They’re stuck with unrealized losses day after day and still have to pay so much interest
They used to bleed retail traders alongside the market makers; now they’re being bled alongside retail traders. Retail traders can hold out forever
But institutions can’t. Blow after blow, all the coins forced onto the market are spat back to the damn market makers
post-image
BTC-0.28%
10.12 Gold Trading Review: Strategy System Continues to Be Validated, Execution Refined and Calibrated Today, gold posted a rise-and-retreat decline, with a clear and smooth intraday trend structure. Four typical trading opportunities emerged in succession: trend-following scalps, countertrend swings, countertrend pattern trades, and trend-following swings, precisely completing a full-scenario live-market validation of the entire strategy system. The review results showed that all preset strategy patterns were accurately validated by the day’s market action: from the trend-following entry logi
PAXG-0.18%
XAU-0.25%
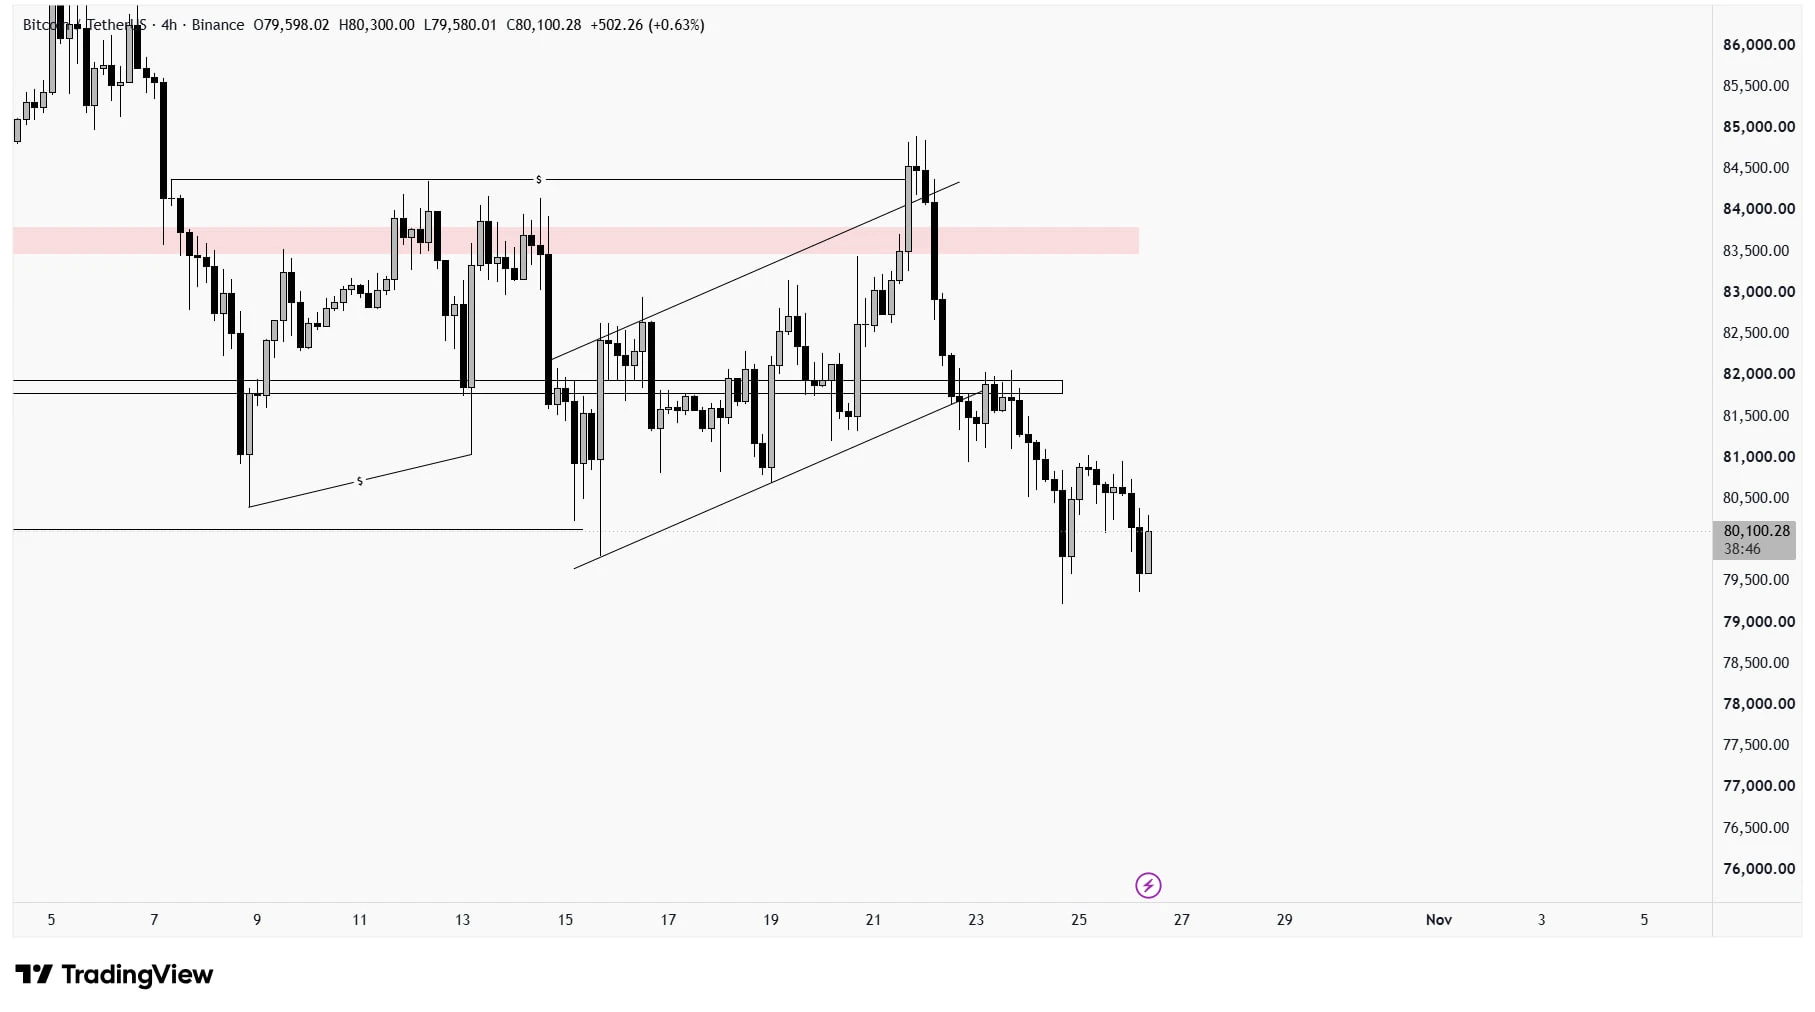
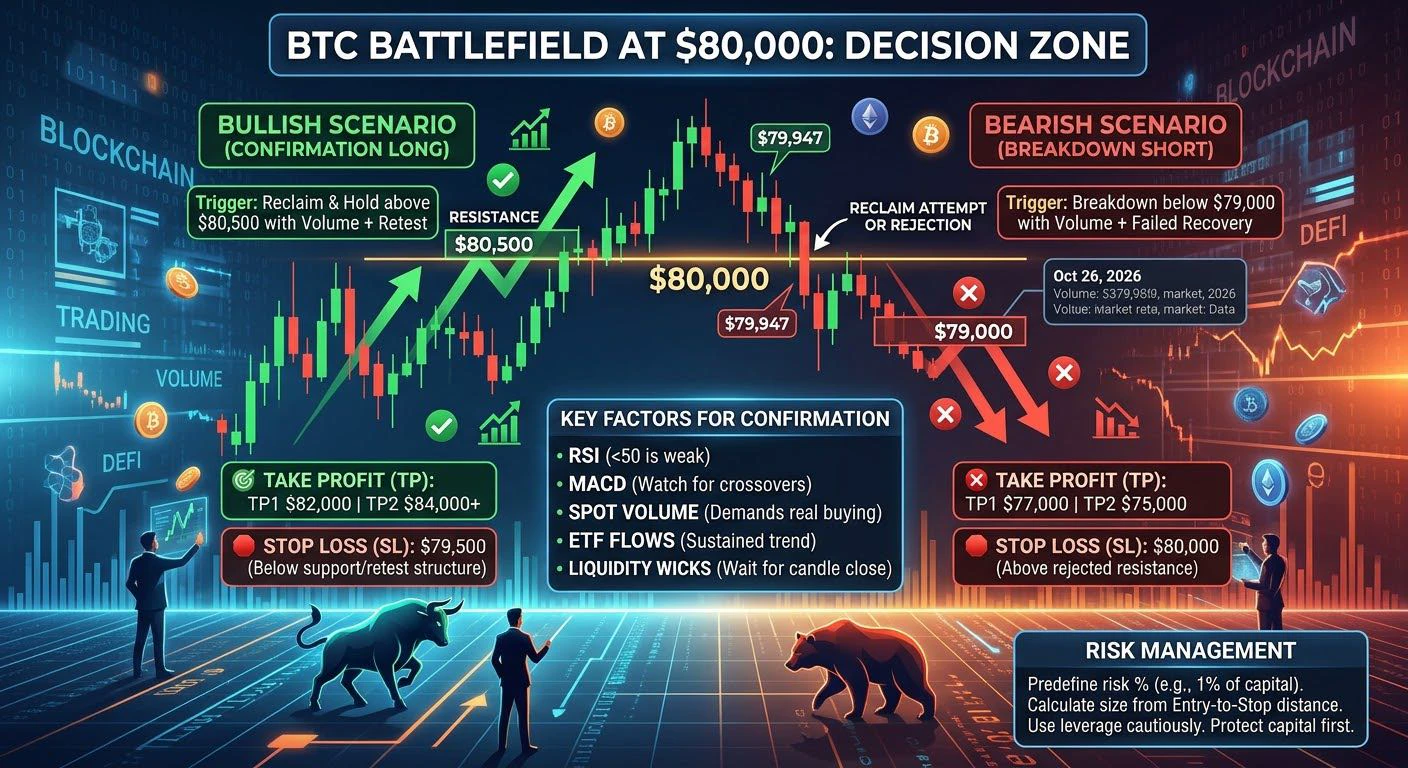
Bitcoin has not broken below the 8-hour line, and the low for this move will most likely be $80,396. Barring special circumstances, the current U.S. trend should hold. This is often how the market works: if everyone is bearish, it probably will not fall. Just like when it dropped to $5.7 a while ago and everyone thought it would fall to $35k! Few industries can be pinpointed with complete accuracy, so there is no need to focus too much on decimal places. You only need to watch the market more—the market’s sentiment determines tomorrow’s direction! Do not bottom-fish when everything is peaceful
post-image
BTC-0.28%
  • 2
Chaincatcher data shows:
Gate ranked second in 24-hour net inflows among global centralized exchanges.
When the market is volatile, where funds flow is where trust lies.
Funds are voting with their feet.🫡
post-image
MORNING MARKET PREDICTIONS
live-cover
LIVE1,569
Bitcoin opened a long at 81400, with the take-profit target set at 82655. The market surged directly to around 82787, and the precise take-profit was secured 🔥
A group member even remarked: How did you take profit so quickly? Hahaha.
Could it be that you're still not used to taking profit so quickly?
Could it be that everyone prefers getting stuck like San Ma Ge?
bitcoin:native
post-image
BTC-0.28%
  • 1
ETH outlook this morning
Strategy:
Short around 2485-2505
First target: 2460-2440
Second target: 2400-2350
Set a stop-loss
After a sharp drop, ETH has rebounded and is currently approaching the upper Bollinger Band, while RSI has entered the overbought zone, indicating a need for a short-term pullback. I believe the broader structure remains bearish, and this rebound is merely a correction, not a reversal. In terms of strategy, wait for signs of stalling gains and a bearish candle near the upper band before cautiously opening a small short position. Do not chase the decline; set defense above
post-image
ETH-1.42%
Korean Stocks Plunge Enough to Trigger Trading Curbs! KOSPI activates its sidecar mechanism. Is a bi
live-cover
LIVE2,656
#阿斯麦与台积电即将发布Q3财报 The real stress test for the AI trade is just beginning: two earnings reports in 48 hours
The AI trade is still moving higher, but a tough round of validation is coming this week. Last week, all three major U.S. stock indexes closed higher. A rebound in technology stocks helped the market withstand upward pressure from oil prices and Treasury yields, while the Nasdaq Composite rose for a fourth consecutive week. As the new week began, S&P 500, Nasdaq 100, and Dow futures were broadly little changed, with investors clearly waiting for new catalysts. One of the most important se
ASML-1.76%
TSM-1.92%
NVDA-1.27%
SPX500-0.53%
NAS100-1.66%
  • 2
gm frens
happy akara tuesday
post-image
In today’s market, $SNXXB ’s RSI reading is the most abnormal: the current price is 11.1, down 19.51% over 24 hours, yet the RSI has fallen to 15.7. Against the conventional oversold threshold of 30, this is already an extreme zone in indicator terms, but the price has shown no sign of bottoming, indicating persistent selling pressure rather than an emotionally driven mispricing.
Using this coin to explain a reusable method: the moving-average system gauges trend health, with the focus on two things—the relative position and slope of MA5 and MA20. $SNXXB ’s current MA5=11.38 has fallen below M
OSMO+37.15%
UNI-5.23%
Load More

Join 40 M users in our growing community

⚡️ Join 40 M users in the crypto craze discussion

💬 Engage with your favorite top creators

👍 See what interests you

Trending Topics

GateRanksTop2inCEXNetInflows

39.9k Views810 Discussing

According to DefiLlama, Gate ranked top 2 among global centralized exchanges by 24-hour net inflows at $12.21 million, with capital inflows remaining strong. What's your take? [👉 Read more](https://www.chaincatcher.com/article/2295824)

GateWCTCS9GlobalTradingCompetition

35.81k Views5.6k Discussing

SanDiskPlunges6%MemoryStocksFall

122.72k Views3.77k Discussing

View More