
Share your thoughts
placeholder
Article
Rise and shine fam!
Let me see those GMs
post-image
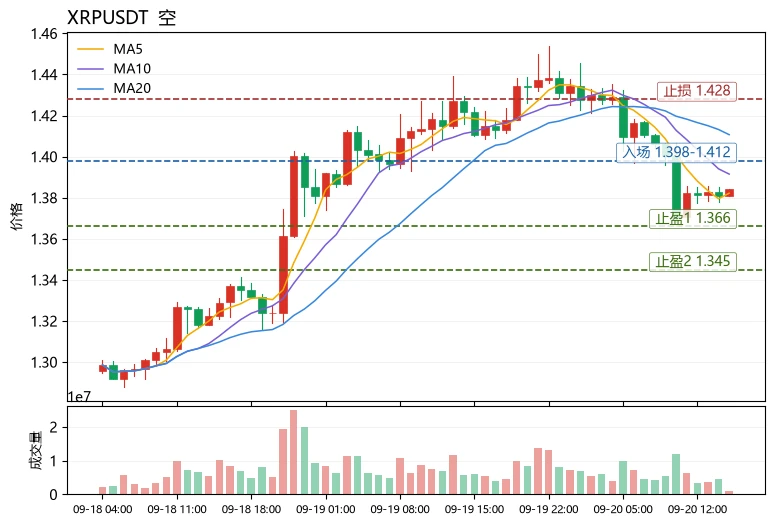
The Fear & Greed Index is at 71 and remains in the greed zone, so many people simply assume “greed = keep chasing longs.” This is a typical trading misconception. A greed reading only indicates that sentiment has not yet cleared out; it does not mean prices still have upward momentum. Especially when a coin has already weakened ahead of the broader market, sentiment and price often diverge.
Looking at the current structure of $XR : current price 1.3841, down 2.65% over 24h; MA5=1.38218 has crossed below MA20=1.41068, with the short-term moving average turning down and exerting pressure; RSI=40
post-image
LSK-14.66%
Everyone is about to get proven wrong by SYMBOL right now.

$BTC /USDT - LONG

Trade Plan:
Entry: 80139.70 – 80302.64
SL: 79439.04
TP1: 80807.76
TP2: 81198.83
TP3: 81785.42

Why this setup?
Why now? The daily trend is bullish while the 15m RSI sits at 35.39, showing a sharp pullback that leaves room for a relief bounce. The 1h ATR of 325.885486 signals enough volatility to fuel a leg higher without stalling. The entry zone between 80139.70 and 80302.64 aligns with the 1h price of 80219.74, giving a precise trigger. TP1 at 80807.76 and TP2 at 81198.83 offer staggered exits, while 79439.04 is
BTC-1.29%
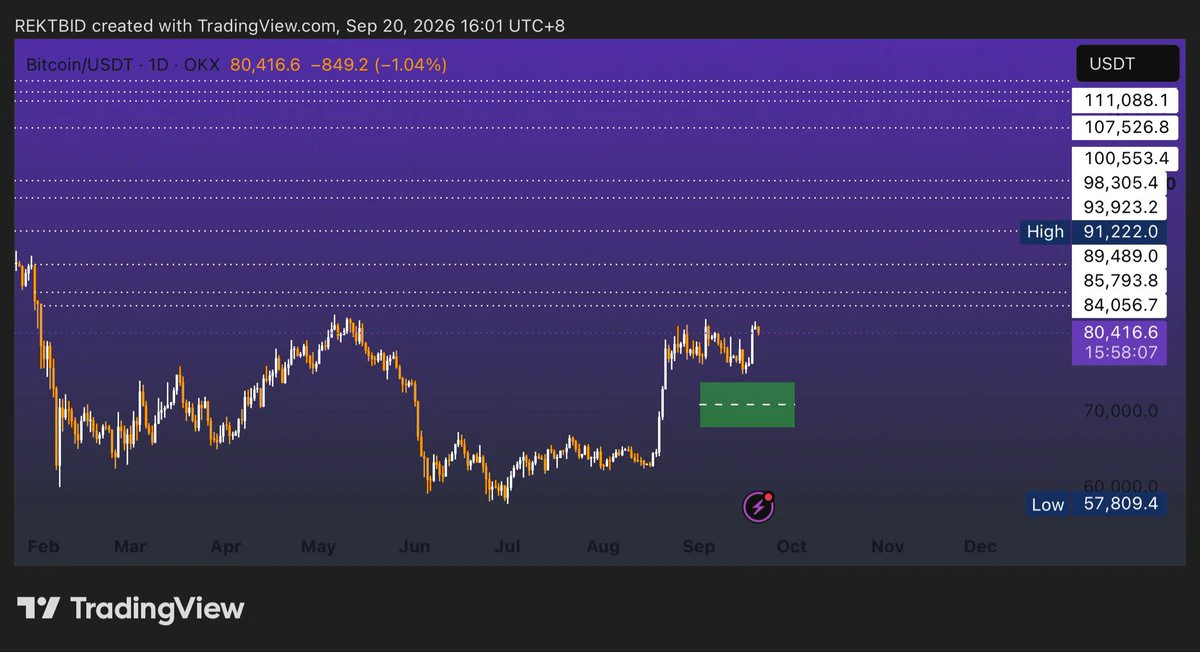
I still anticipate $BTC to hit the box if not September then October , a quick washout rather than a deep washout if market remains bullish
post-image
BTC-1.28%
#MSTRTopsNasdaq100
$MSTR Leads Nasdaq: Why Is Strategy Rallying So Hard?
Strategy ($MSTR) is suddenly one of the most interesting names in the U.S. stock market.
As of September 20, MSTR has gained around 48% over the past month, making it the best-performing stock among Nasdaq-100 constituents, while Bitcoin gained roughly 12% over the same period.
What makes this move even more interesting is the contrast with the broader market.
While some stocks have struggled, MSTR has become a major beneficiary of renewed strength in Bitcoin and risk assets.
So, what exactly is MSTR — and is there still
MSTR+16.35%
BTC-1.28%
MSTRG-2.73%
MSTRX-2.80%
MSTRON-2.72%
Range-bound WLD is about to break DOWN hard and most are still sleeping.

$WLD /USDT - SHORT

Trade Plan:
Entry: 0.4210 – 0.4258
SL: 0.4464
TP1: 0.4062
TP2: 0.3947
TP3: 0.3774

Why this setup?
Why now? The daily trend stays in a range but the 1h price sits at 0.4234 inside the 0.4210-0.4258 entry zone, setting up a SHORT with a 15m RSI of 45.64 showing weakening momentum. The 1h ATR at 0.009576 means solid move potential toward TP1 at 0.4062 and TP2 at 0.3947 if sellers step in. Risk is capped with invalidation at 0.4108 as the line in the sand.

Debate:
Do you think WLD breaks down to TP2
WLD-0.43%
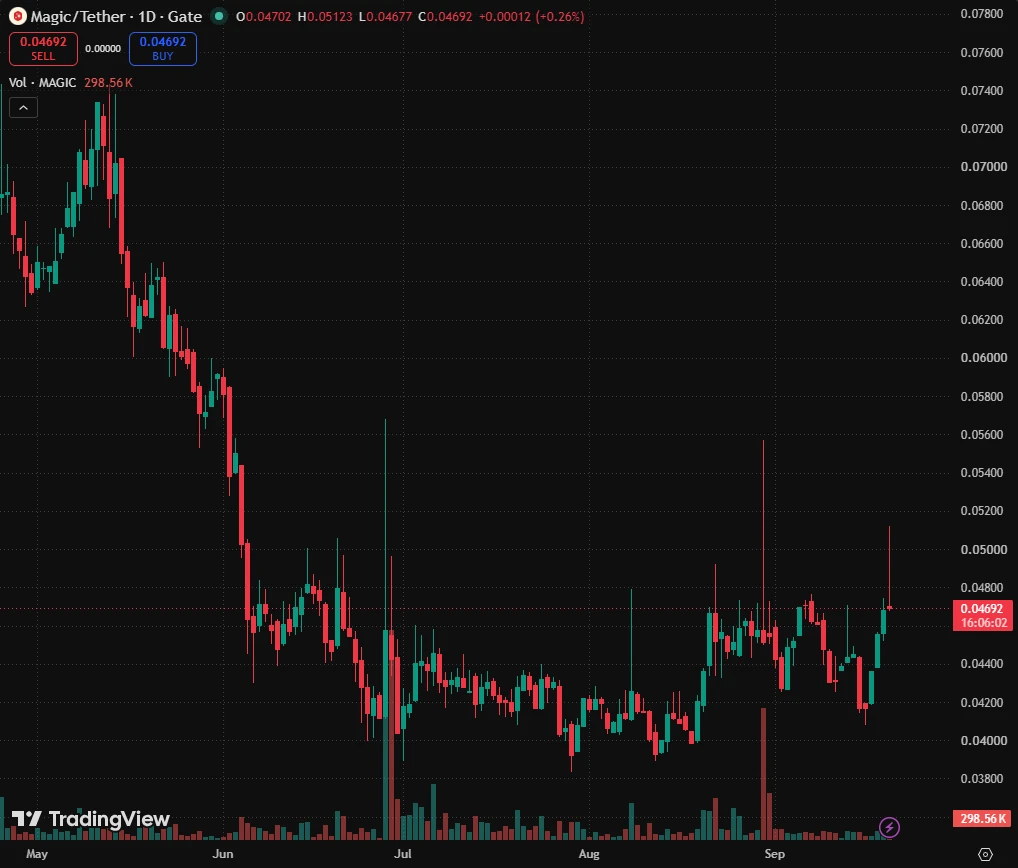
$MAGIC MAGICUSDT Forming Bullish Momentum
MAGICUSDT is forming a clear bullish momentum pattern, a classic bullish reversal signal that often indicates an upcoming breakout. The price has been consolidating within a narrowing range, suggesting that selling pressure is weakening while buyers are beginning to regain control. With consistent volume confirming accumulation at lower levels, the setup hints at a potential bullish breakout soon. The projected move could lead to an impressive gain of around 90% to 100% once the price breaks above the wedge resistance.
This bullish momentum pattern is
post-image
MAGIC+0.61%
Update BTC market behavior has undergone a substantial shift, moving from panic selling to bu
live-cover
LIVE3,790
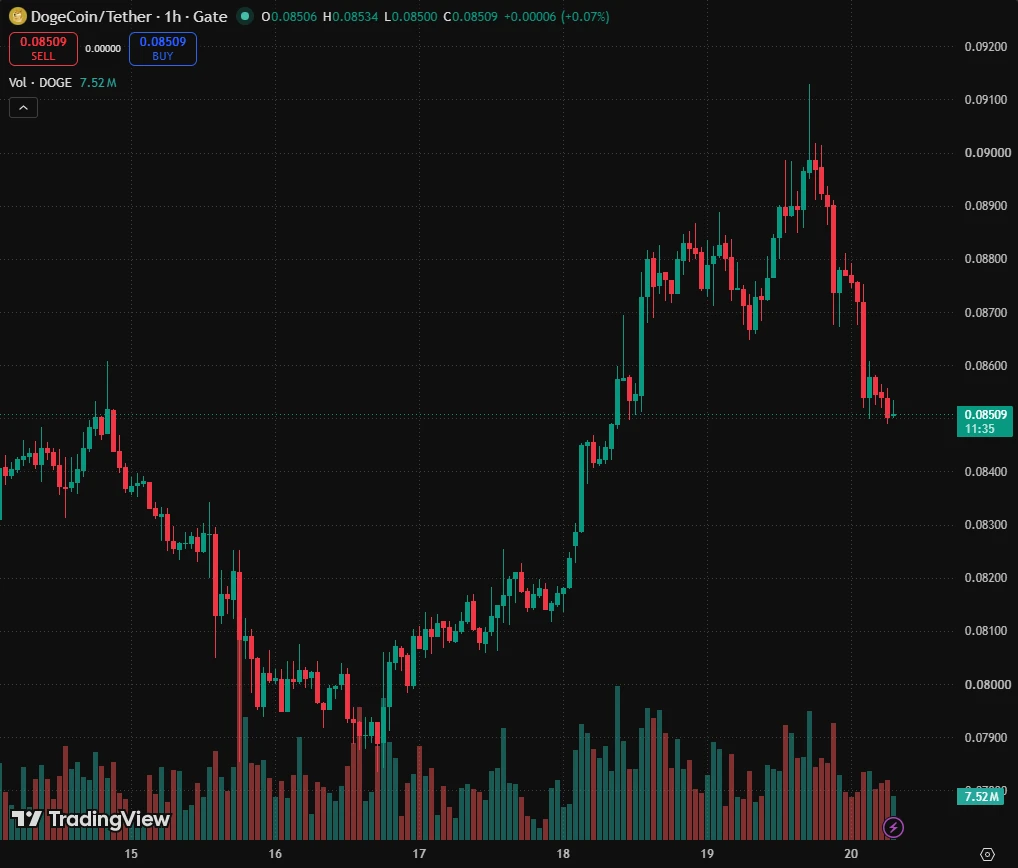
$DOGE DOGEUSDT: Recovery phase, Bulls in focus
The price is moving within a descending channel on the 1-hour timeframe; it has reached the lower boundary and is poised for a rebound. A retest of this boundary is expected, supporting an upward move.
The Relative Strength Index (RSI) indicates a bearish trend, but an upward breakout is likely due to oversold conditions on the 1-hour chart.
An orange trend line supports the potential upward rebound.
There is initial support at 0.07800, acting as a primary support zone.
A key support zone (marked in green) exists at 0.07515; the price has bounced
post-image
DOGE-2.76%
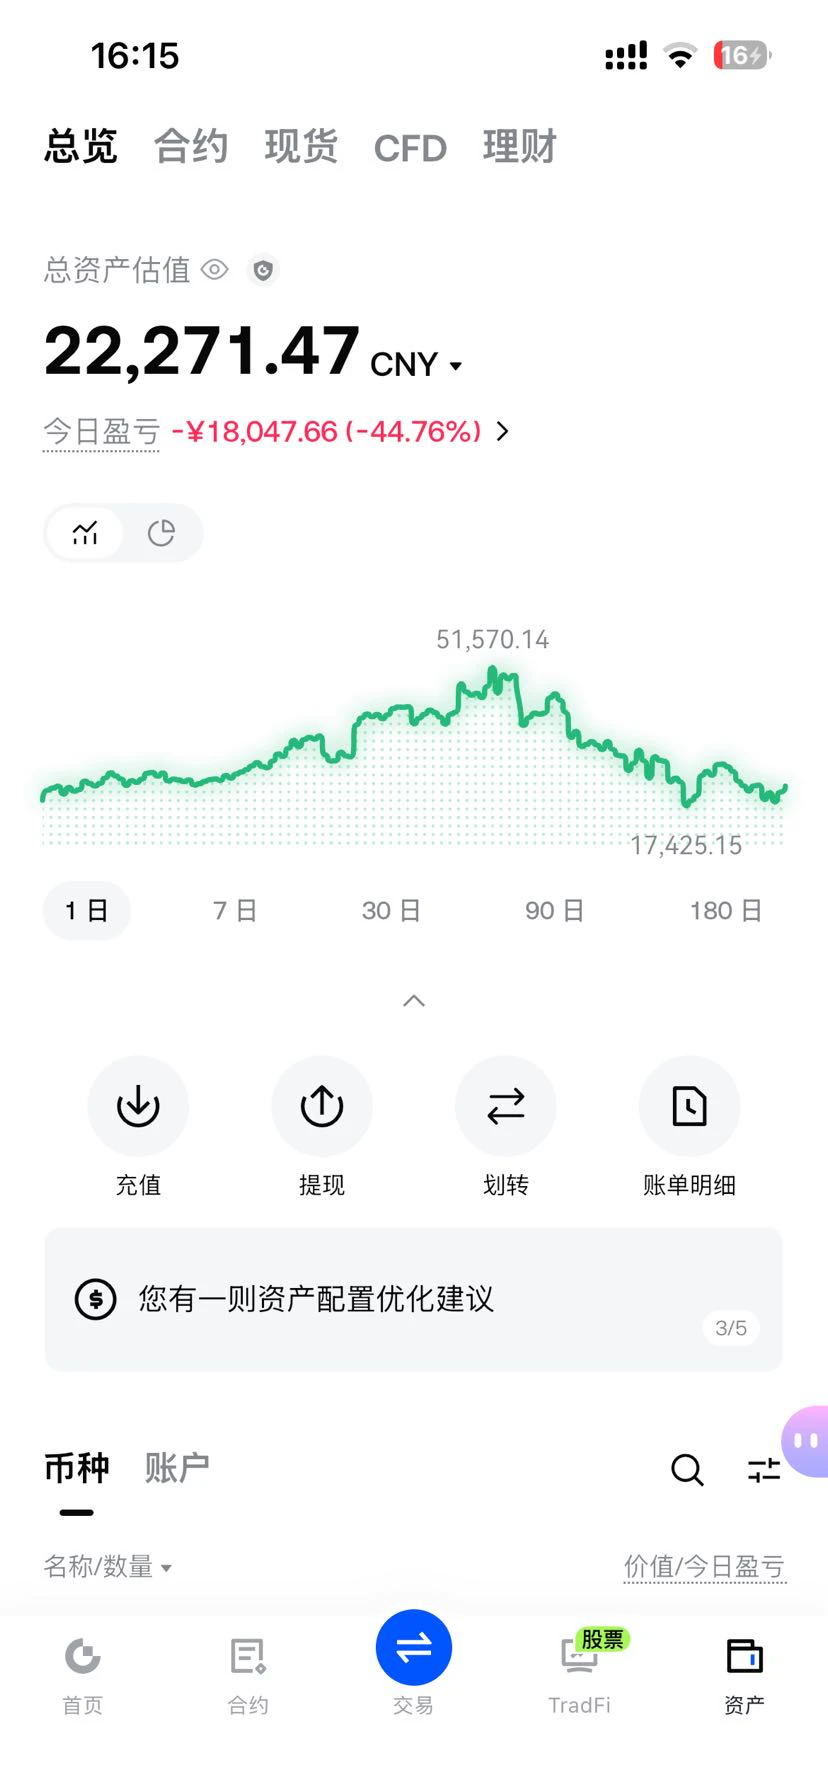
$ONE Today’s moves were fierce as a tiger, but the maximum loss was 25,000. I knew today was a pullback market, yet I still had to trade—might as well have just focused on ONE. Today’s trading gets a bad review.
post-image
ONE+104.04%
JUST IN: Jiang Zhuoer says ZEC is a “whale coin” and will not participate in trading after a major holder’s positions surfaced, potentially flagging downside risk for ZEC as wholesale activity looks to tighten. $ZEC
post-image
ZEC-7.30%
$FLOCK
While this is not financial advice, I believe our stubborn donkey friend’s journey to becoming a dragon will be back in action very soon, and it will continue flying while breathing fire. 😁🔥🐉
Maybe right now, who knows?
😉😎
FLOCK-3.42%
GM if I would delete my profile and start off fresh without a face, would you recognize me by my voice and content?
post-image
Bro, the stage of farming airdrops and picking up cheap tokens in the primary market, then selling them after they launch on the secondary spot and futures markets to profit from the price difference, is already over.
As long as overall liquidity remains unchanged, capital will flow toward undervalued assets, so those tokens whose liquidity has been diverted will eventually skyrocket.
Unfortunately, I have too little solana:BPxxfRCXkUVhig4HS1Lh7kZqV6SPJhzfEk4x6fVBjPCy staked 🥹
post-image
SOL-3.76%
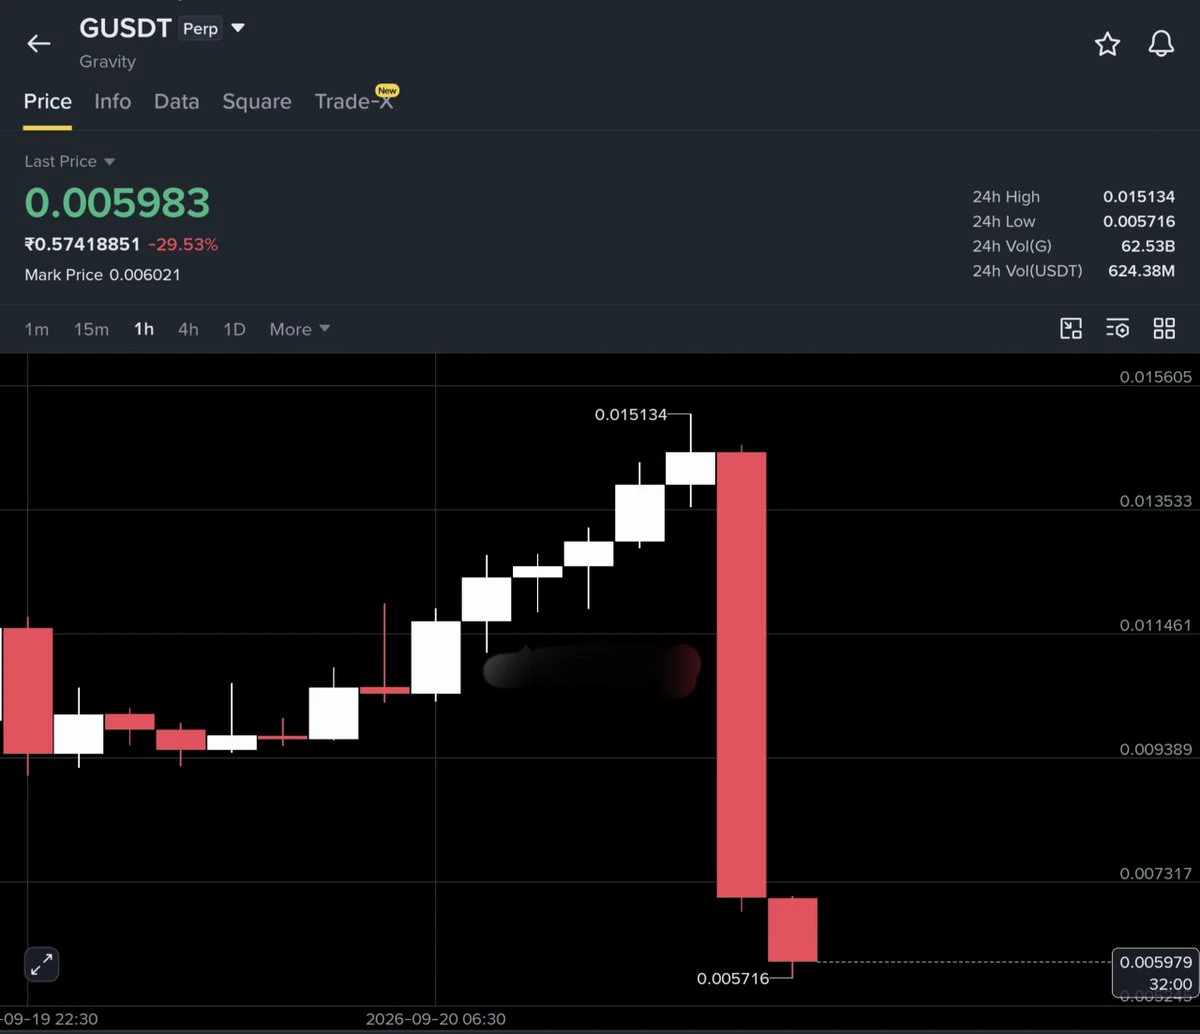
Gravity just hit hard 🪂
$G — one candle erased the entire climb.
From 0.015134 → 0.005716
That’s roughly a 62% drop from the high.
Gravity really said: what goes up… must come down. 😭
post-image
G-13.10%
  • 1
[New Streamer ]Michael Saylor
live-cover
LIVE785
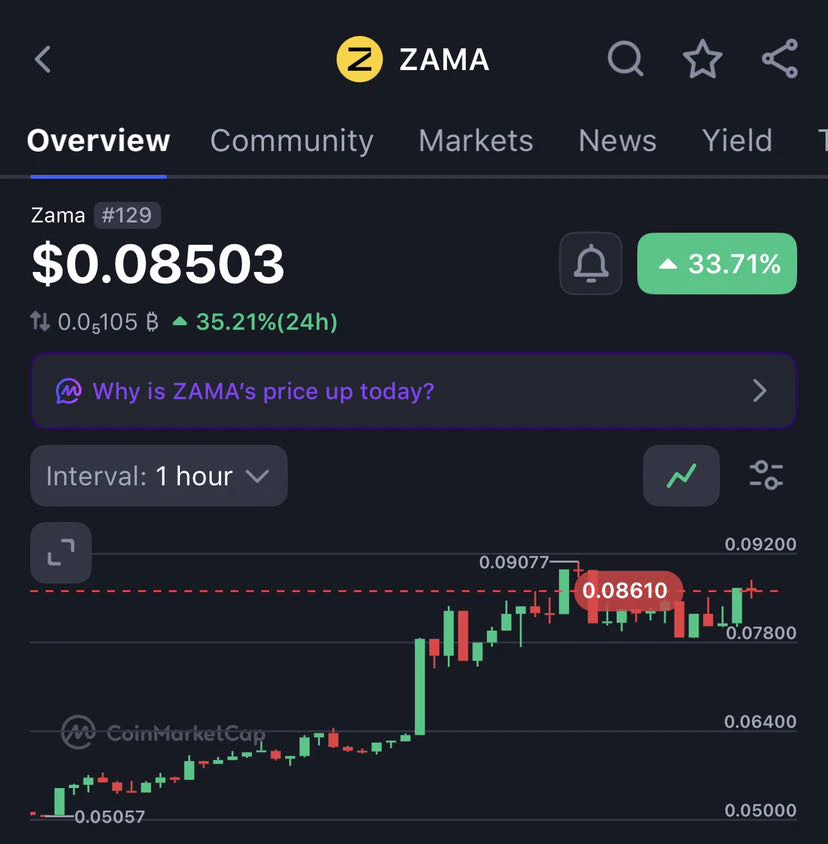
$ZAMA is making big moves!
$ZAMA has surged over 33% in the last 24 hours, climbing to $0.08503 after bouncing strong off its $0.05057 low. 
On the 1-hour chart, we saw a massive bullish breakout hitting a local high of $0.09077. The price is currently consolidating around $0.08610, holding firmly above local support levels near $0.07800. 
With momentum building and privacy tech gaining traction are we heading straight past $0.09200 next? 
Keep $ZAMA on your watchlist this setup is looking clean!
#GateTops24HNetInflowsAmongExchanges #EthereumSpotETFsSee144MNetInflow
post-image
ZAMA+8.48%
  • 4
terra-luna:native fam, are you following me on #CMC yet?
Time-sensitive updates drop there first.
👉
#LUNC #TerraClassic #Crypto
post-image
LUNA-1.96%
LUNC-1.63%
$ZEC Silk Road precisely cashes out
What reason is there left for not taking profits🥩?
Currently holding shorts at the highs, with the breakeven stop set at the Fibonacci level
A breakout will invalidate the shorts; once the market stabilizes, execute long positions
There’s still time, no rush—let the bullets fly for a while…
#MSTR领涨纳指100
AChenBit
9.19 Weekend $ZEC Trading Plan
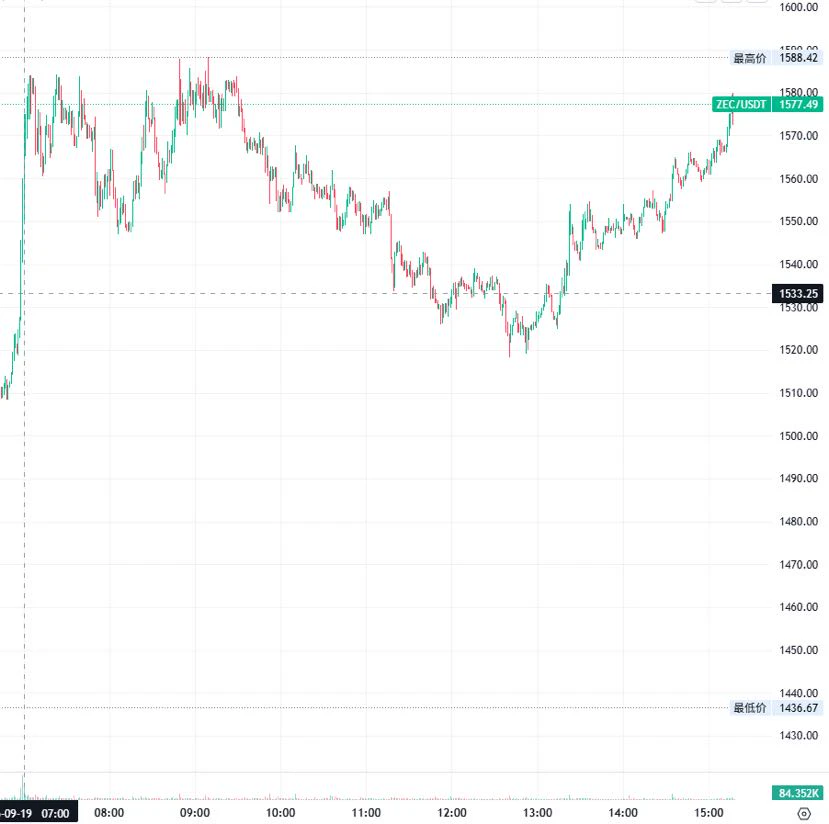
  From the early hours through the morning, it surged again from the low of 1444 all the way to 1588.42, gaining over 100 points, before pulling back and forming a V-shaped reversal. The upward trend remains intact. zec has surged toward this high for the first time in history, with no historical levels available for reference. Liquidity remains strong, but the risk of trading is extremely high because it is impossible to determine what is driving the rise. If 🐶 the market maker wants to harvest retail traders, those entering the market will all be cannon fodder. A conservative approach is recommended. Yesterday, I told bro to enter a long position, with take profit set at 1500. The take profit was successfully hit, but 80 points of upside were missed, and it feels like I was set up again and again 😭. With no levels available for reference, judgments can only be made based on the data. There is no fixed direction, and the levels are for reference only.
1️⃣ Long Trade Strategy
  Entry range: Wait for a pullback to around 1520 and enter only after the trend is confirmed
  Unified stop-loss: Around 1500 (1495 would be better, depending on position size)
Staged take-profit levels
  First take profit: 1580 (close half the position to lock in breakeven)
  Second take profit: 1600 (the previous high; close another half or exit the entire position)
Long-term target: Above 1700 (if the trend remains unchanged, the long-term outlook remains favorable)
2️⃣ Short Trade Strategy
  Entry range: Around 1590
  Unified stop-loss: Around 1610 (previous-high resistance is at 1588; a breakout invalidates the short setup, while the long trend remains unchanged)
Staged take-profit levels
  First take profit: Around 1550 (short-term support amid the current high-level consolidation)
  Second take profit: 1520 (after the first take-profit level breaks, the downside can still be considered if the mid-term trend remains intact)
Third take profit: Below 1480
Long-term target: Below 1440
#日股地产电力半导体板块走强
repost-content-media
ZEC-7.42%
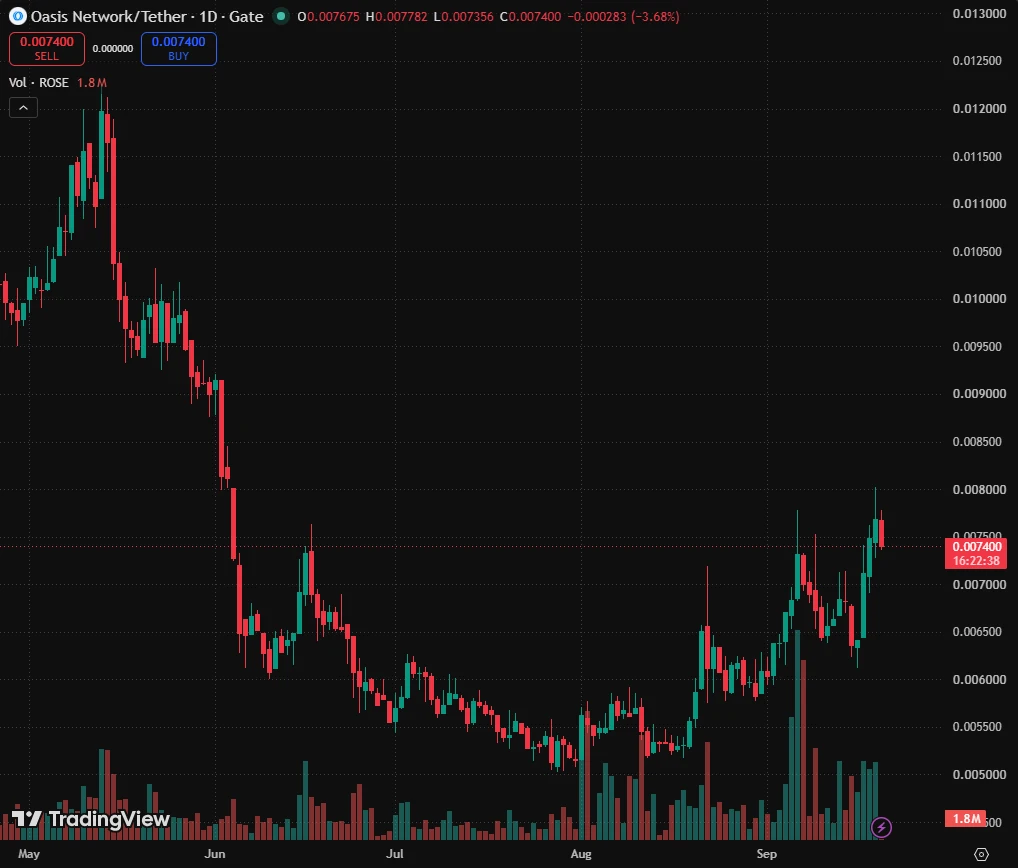
$ROSE ROSEUSDT Forming Bullish Momentum
ROSEUSDT is forming a clear bullish momentum pattern, a classic bullish reversal signal that often indicates an upcoming breakout. The price has been consolidating within a narrowing range, suggesting that selling pressure is weakening while buyers are beginning to regain control. With consistent volume confirming accumulation at lower levels, the setup hints at a potential bullish breakout soon. The projected move could lead to an impressive gain of around 40% to 50% once the price breaks above the wedge resistance.
This bullish momentum pattern is typi
post-image
ROSE-1.61%
Load More

Join 40 M users in our growing community

⚡️ Join 40 M users in the crypto craze discussion

💬 Engage with your favorite top creators

👍 See what interests you

Trending Topics

MSTRTopsNasdaq100

73.45k Views2.77k Discussing

Strategy (MSTR) has gained about 48% over the past month, making it the best-performing stock in the Nasdaq 100, while Bitcoin rose roughly 12% over the same period. The company holds 845,050 BTC with a cumulative cost basis of about $63.73B. MSTR is not a pure Bitcoin proxy — its price swings can be more extreme. Can this rally last?

Gate Tops 24H Net Inflows Among Exchanges

26.26k Views3.67k Discussing

BTCRetakes80K

56.33k Views60.11k Discussing

View More