
Square
Following
Hot
News
Notifications
Profile
Share your thoughts
placeholder
Article
$ATOM — Long entry price: 1.437; Take profit 1: 1.485; Take profit 2: 1.535; Stop loss: 1.305. ATOM has performed better than several other assets in this batch. If buyers hold the current area, advancing toward the intraday high would be a reasonable target.
post-image
ATOM+0.49%
$GOOGL formally announces a new $17 Billion DC in Wyoming.
Google also announced they’re using $BE fuel cells for this project.
Guess this news means it’s all over for the AI buildout.
GOOGL-1.94%
BE-14.39%
Trenches
ZIG
Z
bade
b
ZIG
0x8c...1145
Market Cap
$.
Change
.
24h Vol
$.
Holders
.
BTC
B
bade
b
BTC
C5xp...pump
Market Cap
$.
Change
.
24h Vol
$.
Holders
.
HIGH
H
bade
b
HIGH
7ymF...high
Market Cap
$.
Change
.
24h Vol
$.
Holders
.
STONK
S
bade
b
STONK
6GmA...UNgx
Market Cap
$.
Change
.
24h Vol
$.
Holders
.
CORLA
C
bade
b
CORLA
0xba...7777
Market Cap
$
Change
.
24h Vol
$.
Holders
.
market update
live-cover
LIVE291
Scrolling on my phone, I came across another new launch from Solana Labs

It’s called Leap

The team is from Dialect

Dialect was acquired this year

They built Actions and Blinks

Early access opens on November 5

iPhone users can get access through TestFlight

Android users will have to wait a little longer

It’s not available in restricted regions for now

You can trade tokenized stocks and ETFs

As well as metals, commodities, forex, and crypto

24/7

Place orders in dollar amounts

Orders are routed through Jupiter

Helius infrastructure, Birdeye market data

Onchain swaps

The research t
SOL-0.77%
JUP-1.73%
$BERA I think it’s still continuing downward. Sell: 0.1170, 0.1210. Targets: 0.1130, 0.1119, 0.1095. Stop-loss: 0.1240
post-image
BERA-2.60%
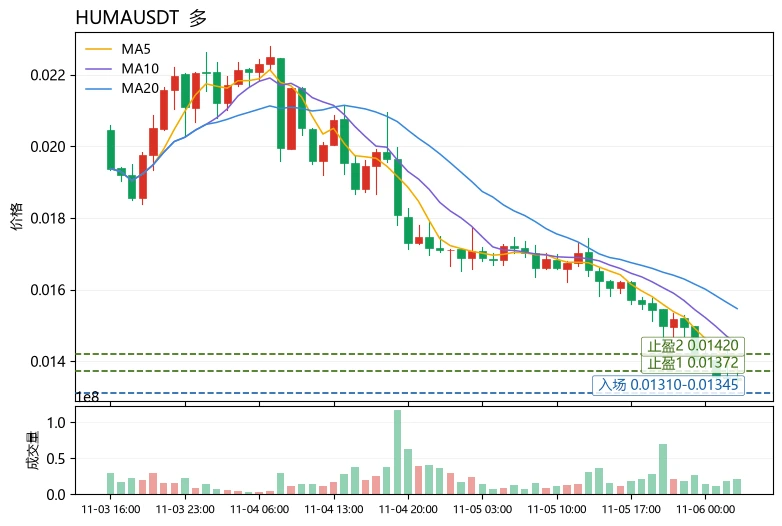
Being deeply oversold does not mean a bottom is in. This is one of the most common misconceptions in technical trading. $HUMA is down over 20% in 24 hours, but the moving average structure remains bearish, with MA5=0.01372 below MA20=0.01547. The price is trading near the lower Bollinger Band at 0.01313, RSI is just 21.1 and has entered oversold territory, and the MACD histogram remains negative at -0.0001223, though signs of convergence should be watched. The funding rate of -0.2801% indicates crowded shorts, leaving room for a short-squeeze rebound, but it is inadvisable to take a large bot
post-image
MUB
MUBMubbin
Pump.Fun
MC:$3.42KHolders:1
0%
HUMA-1.99%
TRX+0.42%
Something to ponder.
AI names were brutally crushed today, which makes me wonder one thing. Do they start coming after financials and healthcare next?
This would be interesting considering how well some of these names have held up relative to the broader market.
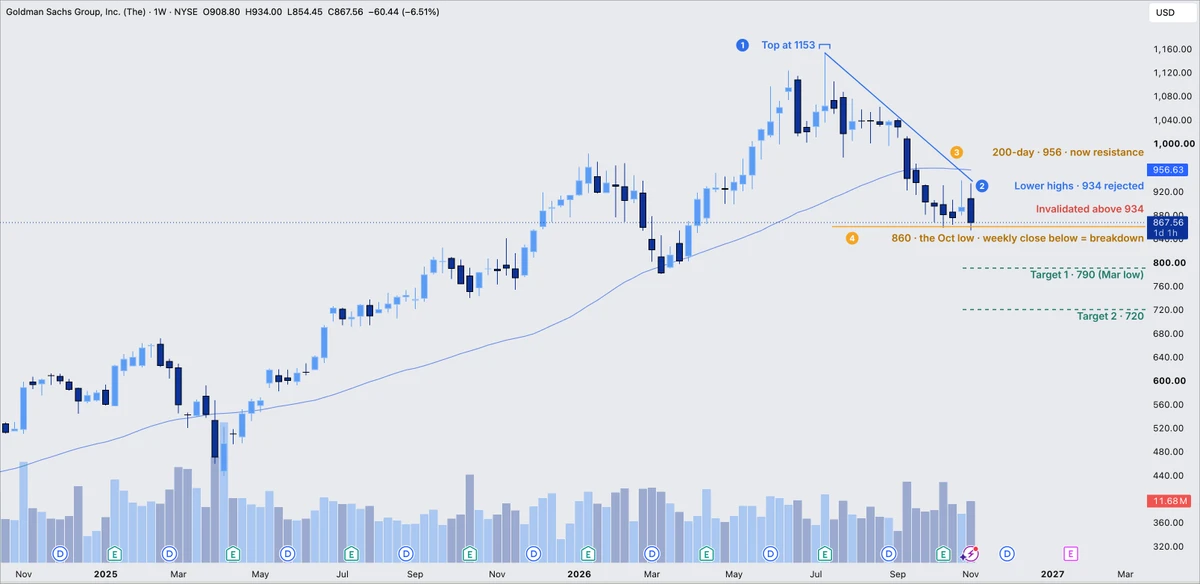
$GS is now sitting at a major inflection point, right below the key $860 weekly level.
Worth keeping a close eye on for another leg lower if it fails to reclaim that level.
post-image
GS-6.05%
#aave
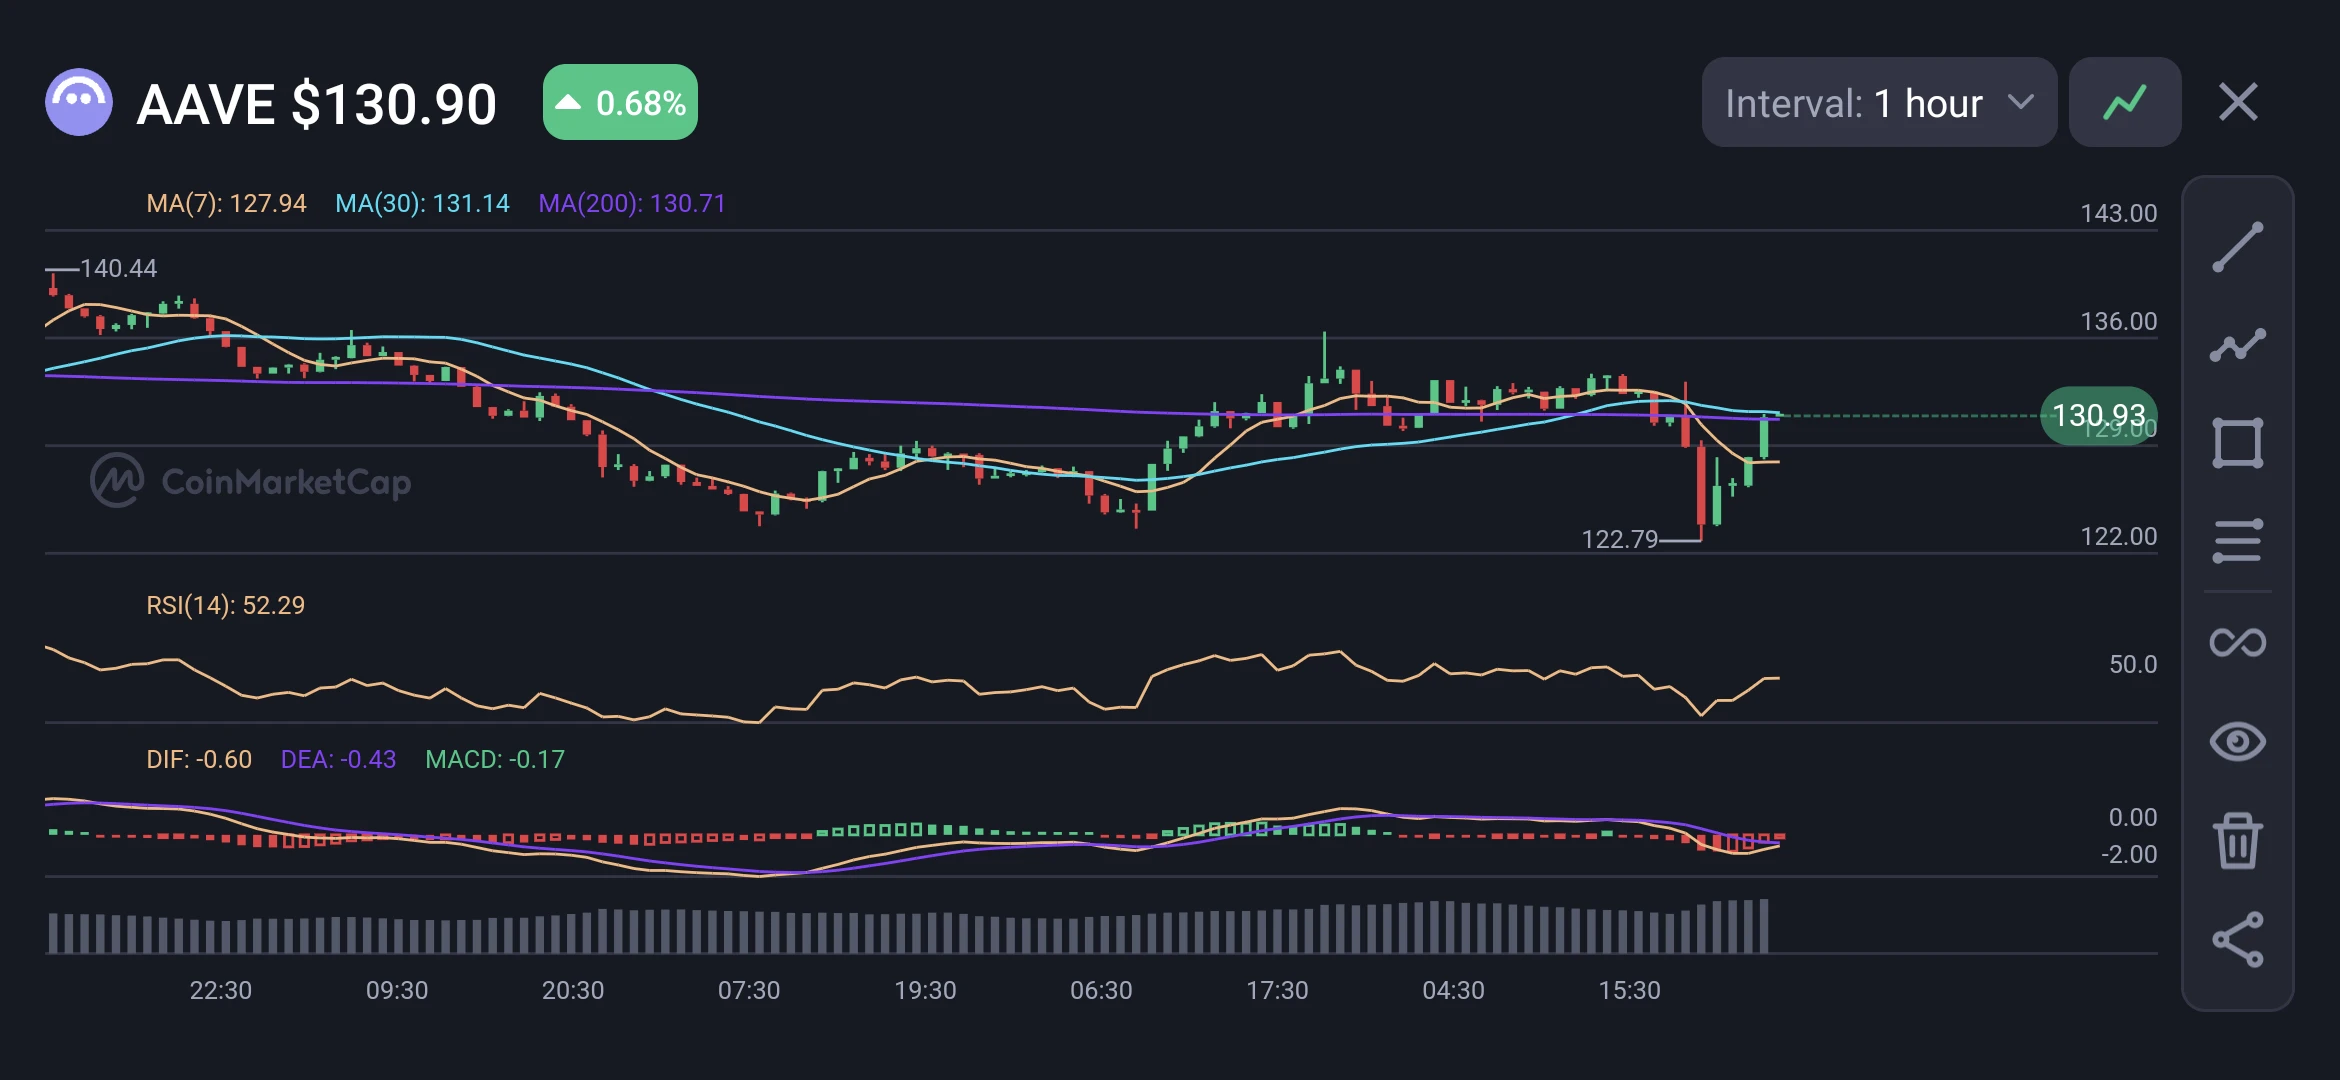
Technical Overview (1-Hour Chart)
​AAVE is trading at $130.90, rebounding sharply off a local panic low at $122.79. The recovery has brought price back into a critical multi-moving-average cluster:
​Moving Averages: Price is testing overhead resistance formed by the MA(200) at $130.71 and MA(30) at $131.14, while holding above the short-term MA(7) at $127.94.
​Momentum: RSI(14) sits at 52.29, resetting into neutral territory. MACD histogram has shrunk to -0.17, signaling fading bearish momentum as DIF (-0.60) converges toward DEA (-0.43) for a potential bullish crossover.
​Trade S
post-image
AAVE-1.22%
UP AND DOWN TRENDS OF GOLD AND BTC.
live-cover
LIVE489
Sanders calls for a pause on AI data centers. The U.S. is hitting the brakes, but China won’t wait. In this tech race, whoever stops falls behind. It’s that simple. If you think I’m talking nonsense, take a screenshot and save it.
post-image
  • 5
$CSOPSAMSUNG2L Down nearly 24% in a single day, the price is now 4.3990. Who’s cutting losses, and who’s buying the dip?
The 24h high of 5.8990 was slammed straight down to 4.3220, with 7.3M in trading volume. This isn’t a pullback—it’s a chain reaction of leveraged positions blowing up. The chart is clear: there’s support around 4.32, but the rebound is weak. Funds are repeatedly testing below 4.4—a classic panic tail followed by a weak recovery. There’s just one driver: when the underlying weakens, 2x leveraged tokens are forcibly rebalanced, selling more as the price falls and creating a ne
  • 7
  • 2
$HYPE ‌ 's recent recovery has hit a serious resistance wall, and the latest candle shows sellers stepping back in.

Price is around $77.68 after rejection near $84.89. The daily Supertrend remains bullish at $75.21, but buyers need to defend that support to keep the recovery structure alive.

Levels worth watching:

Support: $77.45
Major support: $75.21–$74.41
Resistance: $82.67–$84.89
Next upside zone: $88.20

Holding above $75 could set up another attempt toward $82.67. A break below $74.41 would put the bullish structure under pressure.

HYPE still has a chance to stabilize, but buyers ne
HYPE+0.24%
AMD-15.33%
  • 6
  • 2
ETH Technical Outlook: Ethereum Tests Critical Support as Bearish Pressure Remains

Ethereum is trading around $2,265–$2,267, testing the 0.236 Fibonacci level near $2,265.68 after pulling back from its recent recovery high around $2,358–$2,385.

The latest daily chart shows ETH trading below all four major EMAs. Although RSI has started to recover, the broader structure remains under pressure. Holding the $2,241–$2,265 support area is important for preventing another move lower.

EMA Structure

ETH is currently trading below all four major moving averages:

- 20 EMA: $2,349.35
- 50 EMA: $2,40
ETH-1.26%
The XAU outlook remains spot-on🔥🔥🔥
The pullback has already offered nearly 70 points of room

Opportunity never waits for anyone,
The cost of sitting on the sidelines is often higher than the cost of trying.
Once you’ve thought it through, take action,
Don’t wait until the market move is over to ask if there are still opportunities.
#Gate首创资金安全证明
XAU+0.38%
#BTCBackAbove80K BTC Back Above $80K: Bitcoin Reclaims a Key Psychological Level

Bitcoin (BTC) surged back above the $80,000 mark on November 5, 2026, following a sharp recovery in the cryptocurrency market after US midterm election volatility. BTC climbed to approximately $80,300–$81,000, supported by improving investor sentiment and renewed buying interest. The Economic Times +1

One major factor behind the rebound was renewed institutional demand. US spot Bitcoin ETFs recorded approximately $74.6 million in net inflows on November 4, ending three consecutive days of withdrawals. Additional
BTC-0.67%
ETH-1.26%
Future fest is not here to play this time around🔥 momentum is already building and I can See party announcements happening already . I’m so ready #FutureFest26
#BTCBackAbove80K
#ShareWeekly

Bitcoin's return above $ 80 000 has once again caught my attention. I am watching this move and see not just another price recovery, but an important moment for assessing the behavior of buyers and sellers. After a difficult period, BTC is once again trying to regain the trust of market participants. But I am in no hurry to call this the start of a new bull trend. One strong green move does not change the overall picture. For me, what happens after the return to the psychological $ 80 000 mark is much more important. The price reaction at key levels often says
BTC-0.67%
  • 2
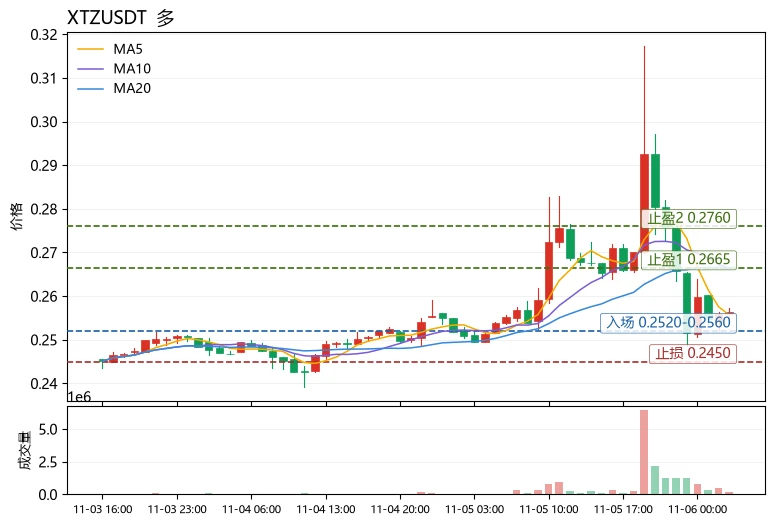
The most unusual detail in today's market was that while overall market sentiment remained neutral at 50 and BTC showed no clear direction, $XTZ bucked the trend and closed up 1.87% with its funding rate in negative territory at -0.1142%. Shorts are paying, yet the price is not falling—this is a classic sign of crowded shorts, not buying driven by a trend. From a sector-rotation perspective, overall risk appetite is contracting, and capital is more inclined to make short-term bets on oversold assets. $XTZ fits this profile.
Technical breakdown: MA5=0.25568 has moved above the current price a
post-image
TQQQB
TQQQBTQQQB
Four.meme
MC:$3.36KHolders:2
0%
XTZ-2.61%
$SOL ‌ is struggling to find a solid floor, but the $88.69 zone is becoming an important level to watch.

Price is trading near $89.44, with sellers still controlling the daily trend. The Supertrend sits at $104.95, so a bullish reversal is not confirmed yet.

Key levels:

Support: $88.69–$88.00

Resistance: $94.86–$97.08

Major trend resistance: $102.85–$104.95

A hold above $88.69 could give SOL room for a relief bounce toward $95. Reclaiming $97 would be the first sign of improving momentum. A breakdown below support could open further downside.

SOL needs buyers to defend this area. The
SOL-0.77%
MU-15.64%
  • 5
Load More

Join 40 M users in our growing community

⚡️ Join 40 M users in the crypto craze discussion

💬 Engage with your favorite top creators

👍 See what interests you

Trending Topics

GateLaunchesPoSECProofOfSecurity

7.69k Views546 Discussing

Beyond Proof of Reserves, Gate has introduced PoSEC, a new Proof of Security framework focused on how user assets are stored and protected. By disclosing the distribution of assets across cold storage and hot wallets, users can directly understand Gate’s storage structure and risk coverage under extreme scenarios. Gate’s latest cold storage coverage ratio stands at 104.58%, meaning cold-storage assets alone are sufficient to cover all user assets. PoR verifies whether reserves are sufficient, while PoSEC shows how assets are stored and how risks are covered — together forming a more complete asset security framework. Share your results and experience! [👉 Learn more](https://gate.com/proof-of-security)

BTCBackAbove80K

126.19k Views41.58k Discussing

DemocratsWinBothChambers

28.37k Views534 Discussing

View More