
Share your thoughts
placeholder
Article
Insiders are quiet while SYMBOL sits at the exact entry zone

$ETH /USDT - LONG

Trade Plan:
Entry: 2452.11 – 2460.41
SL: 2416.46
TP1: 2486.11
TP2: 2506.01
TP3: 2535.86

Why this setup?
Why now? The daily trend is bullish and the 1h price has just pulled back to the entry reference of 2456.26, which aligns with a 15m RSI of 37.37, signaling fading selling pressure. The 1h ATR of 16.583202 means each candle carries enough volatility to reach the first target at 2486.11 and the second target at 2506.01 if momentum resumes. The invalidation level at 2451.56 is the hard line in the sand that pr
ETH+3.26%
Insiders are calling this the most obvious short setup of 2026.

$LAB /USDT - SHORT

Trade Plan:
Entry: 0.05447 – 0.05619
SL: 0.06361
TP1: 0.04912
TP2: 0.04498
TP3: 0.03877

Why this setup?
Why now? The daily trend is bearish, which means the 1h price at 0.05533 sits at a high probability resistance zone. The 15m RSI reading of 56.03 shows the market is not yet exhausted, allowing the short to remain valid. The 1h ATR of 0.00345 tells us the volatility is compressed enough for a decisive move toward TP1 at 0.04912 and TP2 at 0.04498. The entry zone between 0.05447 and 0.05619 offers a preci
LAB+14.30%
solana:6GmAFSYs4gk3FDao5FzzySQpPZaWsa4rUJHacpMpUNgx / @LaunchOnSF
Yesterday we got the news that Apple decided to remove the $PUMP app from their app store. This immediately gave leverage to the STONK market and allowed traders to assume that the PUMP action that we saw previous to that was over.
Are you still confident in PUMP?
SOL+2.30%
AAPL+3.55%
PUMP-2.80%
#GateMeme 🔥 GATE MEME — THE CRYPTO MARKET NEVER SLEEPS!
Crypto trading is not just charts, candles, support and resistance — sometimes it is pure entertainment!
You open the chart thinking:
“Today I will trade with discipline.”
Five minutes later:
BTC suddenly moves 2% and every trader becomes a full-time market analyst. 😂
🚀 When BTC pumps:
“Bull market is back!”
“New ATH incoming!”
“Easy trade!”
📉 When BTC dumps:
“Healthy correction.”
“Liquidity grab.”
“Whales are accumulating.”
😂 And when a meme coin suddenly goes 100%:
“I was watching it yesterday!”
“I almost bought it!”
“I knew it wou
post-image
  • 2
BTC: Short directly at the current price on a rebound to 780; target 772–760, with 755 for the swing trade.
ETH: Short directly at the current price on a rebound to 2511; target 2490–2460, with 2340 for the swing trade.
Be sure to control your position size and reserve room to add to the position #CoinDesk披露GateRWA永续合约全球Top3 .
post-image
BTC+1.28%
ETH+3.52%
$BTC
Regulators draw a red line🔥
The CLARITY Act amendment has been unveiled
Decentralized DeFi will be forced to register
U.S. crypto regulation is making another major move
The latest revised CLARITY Act
has singled out something extremely important
non-decentralized financial transaction protocols
I fucking gasped after reading it
This isn't regulation
This is brain surgery on DeFi
Simply put, when people previously discussed DeFi regulation
the biggest headache was: who is responsible?
Truly fully decentralized protocols
have no boss, no company, and no one sitting in an office answering
post-image
BTC+1.07%
#ZECPlungesOver13%
Zcash has come under heavy selling pressure, with ZEC plunging more than 13% in a sharp move that has quickly changed the short-term market picture.
A move of this size is significant because ZEC had recently attracted strong attention from traders following its earlier price momentum. When an asset rises rapidly and then experiences a double-digit decline, the market naturally begins questioning whether the previous rally was overheated or whether this is simply a temporary correction.
The first thing to watch now is support.
After a sharp breakdown, traders usually look f
post-image
ZEC-2.64%
BTC+1.28%
Pons’s daily token launches and trading volume have been trending downward since September 5, and its token price also happened to reach a recent high on September 5.
For a fully circulating project like this, with 80% of net profits used to buy back and burn its own token, the token price can temporarily be benchmarked against the P/E ratios of Hyperliquid or other similar projects. However, Launchpad is a highly volatile and random sector, so you cannot assume it has “long-term stable revenue for buybacks and burns” like a PerpDEX; instead, you need to assess whether the expected incremental
PONS+15.58%
HYPE+0.87%
MEME+2.43%
I’m watching $BNB for a short here.
BNB is still trading in a bearish 1H structure after the drop from the $740s. The bounce from $703.8 looks weak so far, and price is struggling to build momentum above the $713–$715 area.
Entry: $712.50–$714.50
Targets:
TP1: $710.00
TP2: $707.00
TP3: $704.00
Stop: $717.50
For me, $717.50 is the key level. As long as BNB stays below it, I’m looking for another move lower. A clean reclaim above that level would invalidate the short idea
#GateAugustTransparencyReport #CoinDeskRevealsGateRWAPerpetualsTop3Globally
post-image
BNB+2.39%
  • 2
  • 2
#OracleQ1EarningsBeatStockUpOver5%
Oracle just delivered a quarterly result that puts its AI-cloud strategy firmly back in the spotlight. Q1 revenue reached $19.35B, up 30% year over year, beating the roughly $19.13B consensus estimate, while adjusted EPS came in at $1.92 versus $1.74 expected. The market reaction was immediate, with ORCL shares jumping more than 5% and reports indicating gains of roughly 6–7% after the results.
The most important number, however, may not be total revenue or EPS. Oracle’s cloud revenue reached $11.6B, growing 62% YoY, while Cloud Infrastructure revenue surged
post-image
ORCL-5.32%
September 11, 2026 (Friday) ETH Futures Directional Trading Strategy Reference
ETH is currently fluctuating roughly within the $2,430–$2,460 range (intraday high around 2,480–2,485 and low around 2,430–2,440), retreating from yesterday, following BTC's pullback, and remaining in a generally weak short-term consolidation state.
Brief Market Background
• Macro: Today's U.S. CPI data is the core driver. Yesterday's stronger-than-expected PPI, elevated oil prices, and rising bond yields put overall pressure on risk assets, with ETH weakening in tandem.
• Technical: The medium-term structure rema
post-image
ETH+3.26%
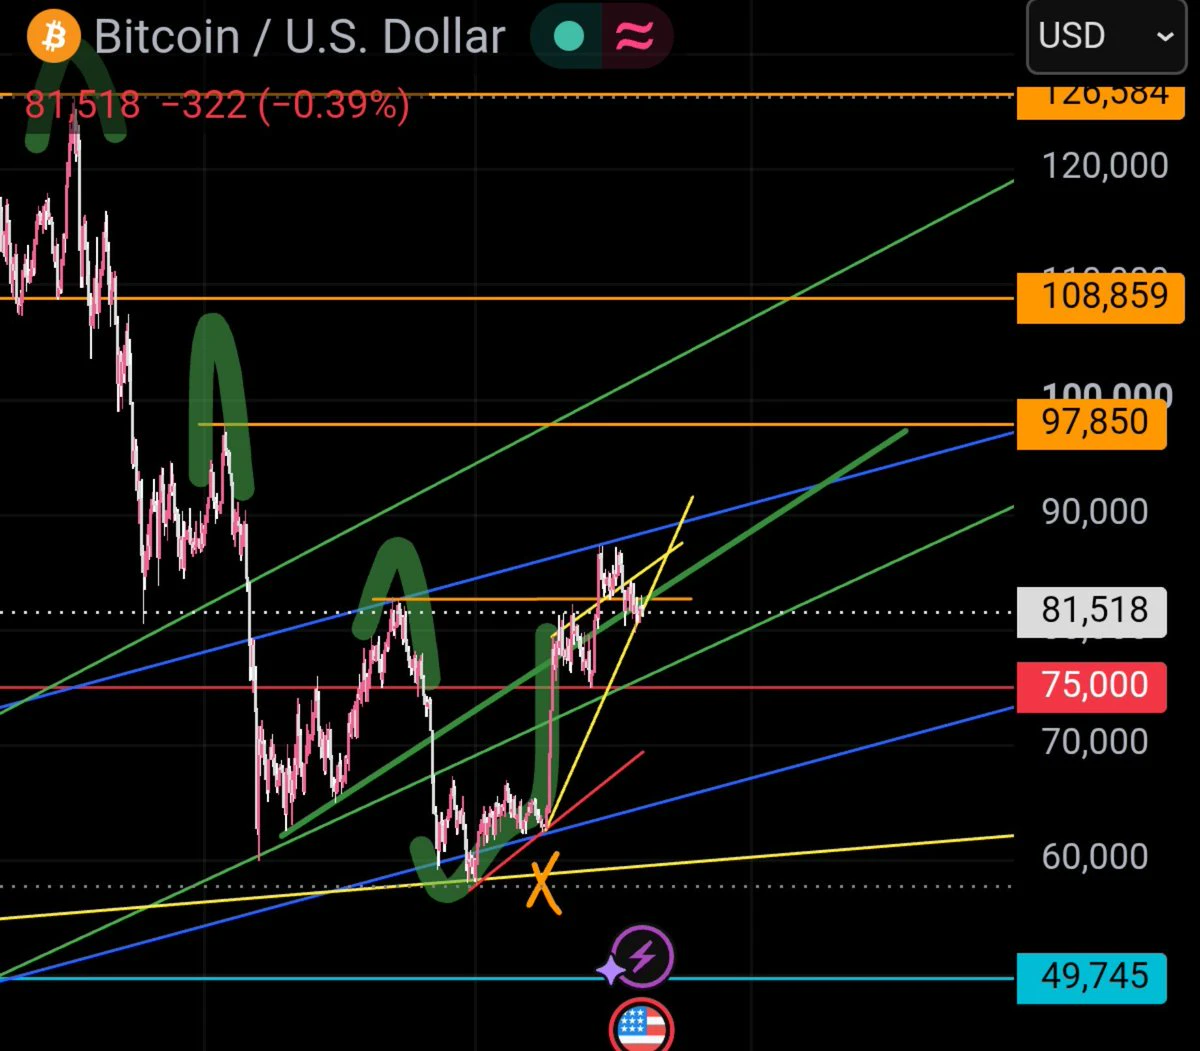
$BTC is starting to look very similar to the previous cycle bottom.
September brought the weakness first. price pushed lower before the real bottom formed, then Q4 became the turning point and the bigger rally followed.
we’re seeing a similar setup again.
This September weakness could be the final shakeout before the Q4 reversal.
and if the same cycle structure plays out, $150K–$170K by 2029 starts looking very interesting.
post-image
BTC+1.28%
  • 1
Long story short, the data will be released in an hour. The market rebounded in the afternoon, and Qingyao immediately alerted everyone to short each of the five major sectors recently traded! BTC is currently up 700 points, ETH 30 points! Gold is up 17 points, ZEC lightly captured 20 points of room, and Didi was relatively slow but still enough for a short-term win!
All mainstream short-term positions in this round have been fully closed. Those who want to trade the data-driven moves should keep a small position and set a breakeven stop-loss, then wait patiently for the data! Those with no op
ZEC-2.64%
I was all set to close the app and go to sleep, but it collapsed on its own, leaving me in a very passive position.
When I opened the charts in the morning, $BTC made another push. There were no buyers up there, and the sell orders were pressing it down hard, making the rebound extremely weak. I went short directly at 77967.7. My judgment was simple: every push upward kept falling just short. At this level, the only direction left was down, and the lack of volume was the best evidence.
When I checked the market after lunch, the price had already reached 76894.2, up +239.29%. It felt so good—I
post-image
BTC+1.07%
ETH+3.26%
BNB+2.25%
🚨 US CPI, CORE CPI, CONSUMER SENTIMENT IN 1H
GET READY FOR FRIDAY VOLATILITY
post-image
I had just switched the app to the background, and it shot up in an instant. Is it playing hide-and-seek with me?
When I checked the chart after lunch, $SOXL was still hovering around 116.25. The key level held, funds were quietly entering, and I judged there was support below, so I signaled bullish. While everyone was still watching from the sidelines, I told everyone not to chase and to wait for a pullback confirmation before acting.
Once confirmed, it took off directly, rising from 116.25 to 119.38, with a long-position return of +126.44%. The wait paid off; the timing was right, so we can
post-image
SOXL+3.45%
XRP+0.26%
ADA-0.34%
The market’s sentiment is becoming increasingly one-sided: bearish.
For short-term traders, this is actually a very dangerous signal.
High U.S. Treasury yields, rising oil prices, inflationary pressure, and expectations of Fed rate hikes—everyone can see these bearish factors. When retail investors, the media, and traders all start waiting for a “major crash” at the same time, shorts themselves can become the most concentrated source of liquidity in the market.
The market may continue to fall, but the path will not be so straightforward.
As long as one data point is not as bad as expected, U.S
NVDA-2.25%
SNDK-4.01%
  • 15
Narrow escape from $BTC
post-image
BTC+1.28%
There is less than half an hour left until the CPI data is released at 8:30, and we will soon find out whether the market moves up or down!!! $ETH
The probability of a rate hike has also risen to 70%. This CPI data will directly affect next week’s interest rate meeting decision. Please pay close attention to the data release at 8:30 tonight; volatility will be very high. Those without positions should stay on the sidelines, and those betting on a direction should not take too large a position. Once the data is released, cut your losses promptly if you are on the wrong side!!! $BTC
post-image
BTC+1.28%
Load More

Join 40 M users in our growing community

⚡️ Join 40 M users in the crypto craze discussion

💬 Engage with your favorite top creators

👍 See what interests you

View More