Share your thoughts
placeholder
Article
Sideways trading is accumulation; the Wyckoff volume-price analysis method was perfectly validated on $AKE USDT. A 25x leveraged long position, entered at 0.0131275 with a take-profit at 0.0163156, secured a gain of +595.96%.
There is no excess return in crowded hot coins; true smart money is always lurking in overlooked corners. Livermore said, “Making big money depends on waiting,” but high leverage requires strict discipline—neither take-profit nor stop-loss can be omitted.
Once the big fish is hooked, bank the profits quickly; greed is the fuse that triggers liquidation. Protecting princip
AKE+16.14%
BTC-1.59%
ETH-2.35%
$BNB is breaking out accumulation box on daily timeframe 👀
History repeat itself, $bnb outperform the market after $BTC & $eth rally, Expecting Massive Bullish Wave 📈
Free Signals:
#Crypto #BNB #BNBUSDT #BNBCoin #cryptocurrency
post-image
BNB0.00%
BTC-1.58%
ETH-2.34%
#GateTops7DayNetInflowsGlobally
GATE CROSSES $300M IN 7-DAY NET INFLOWS
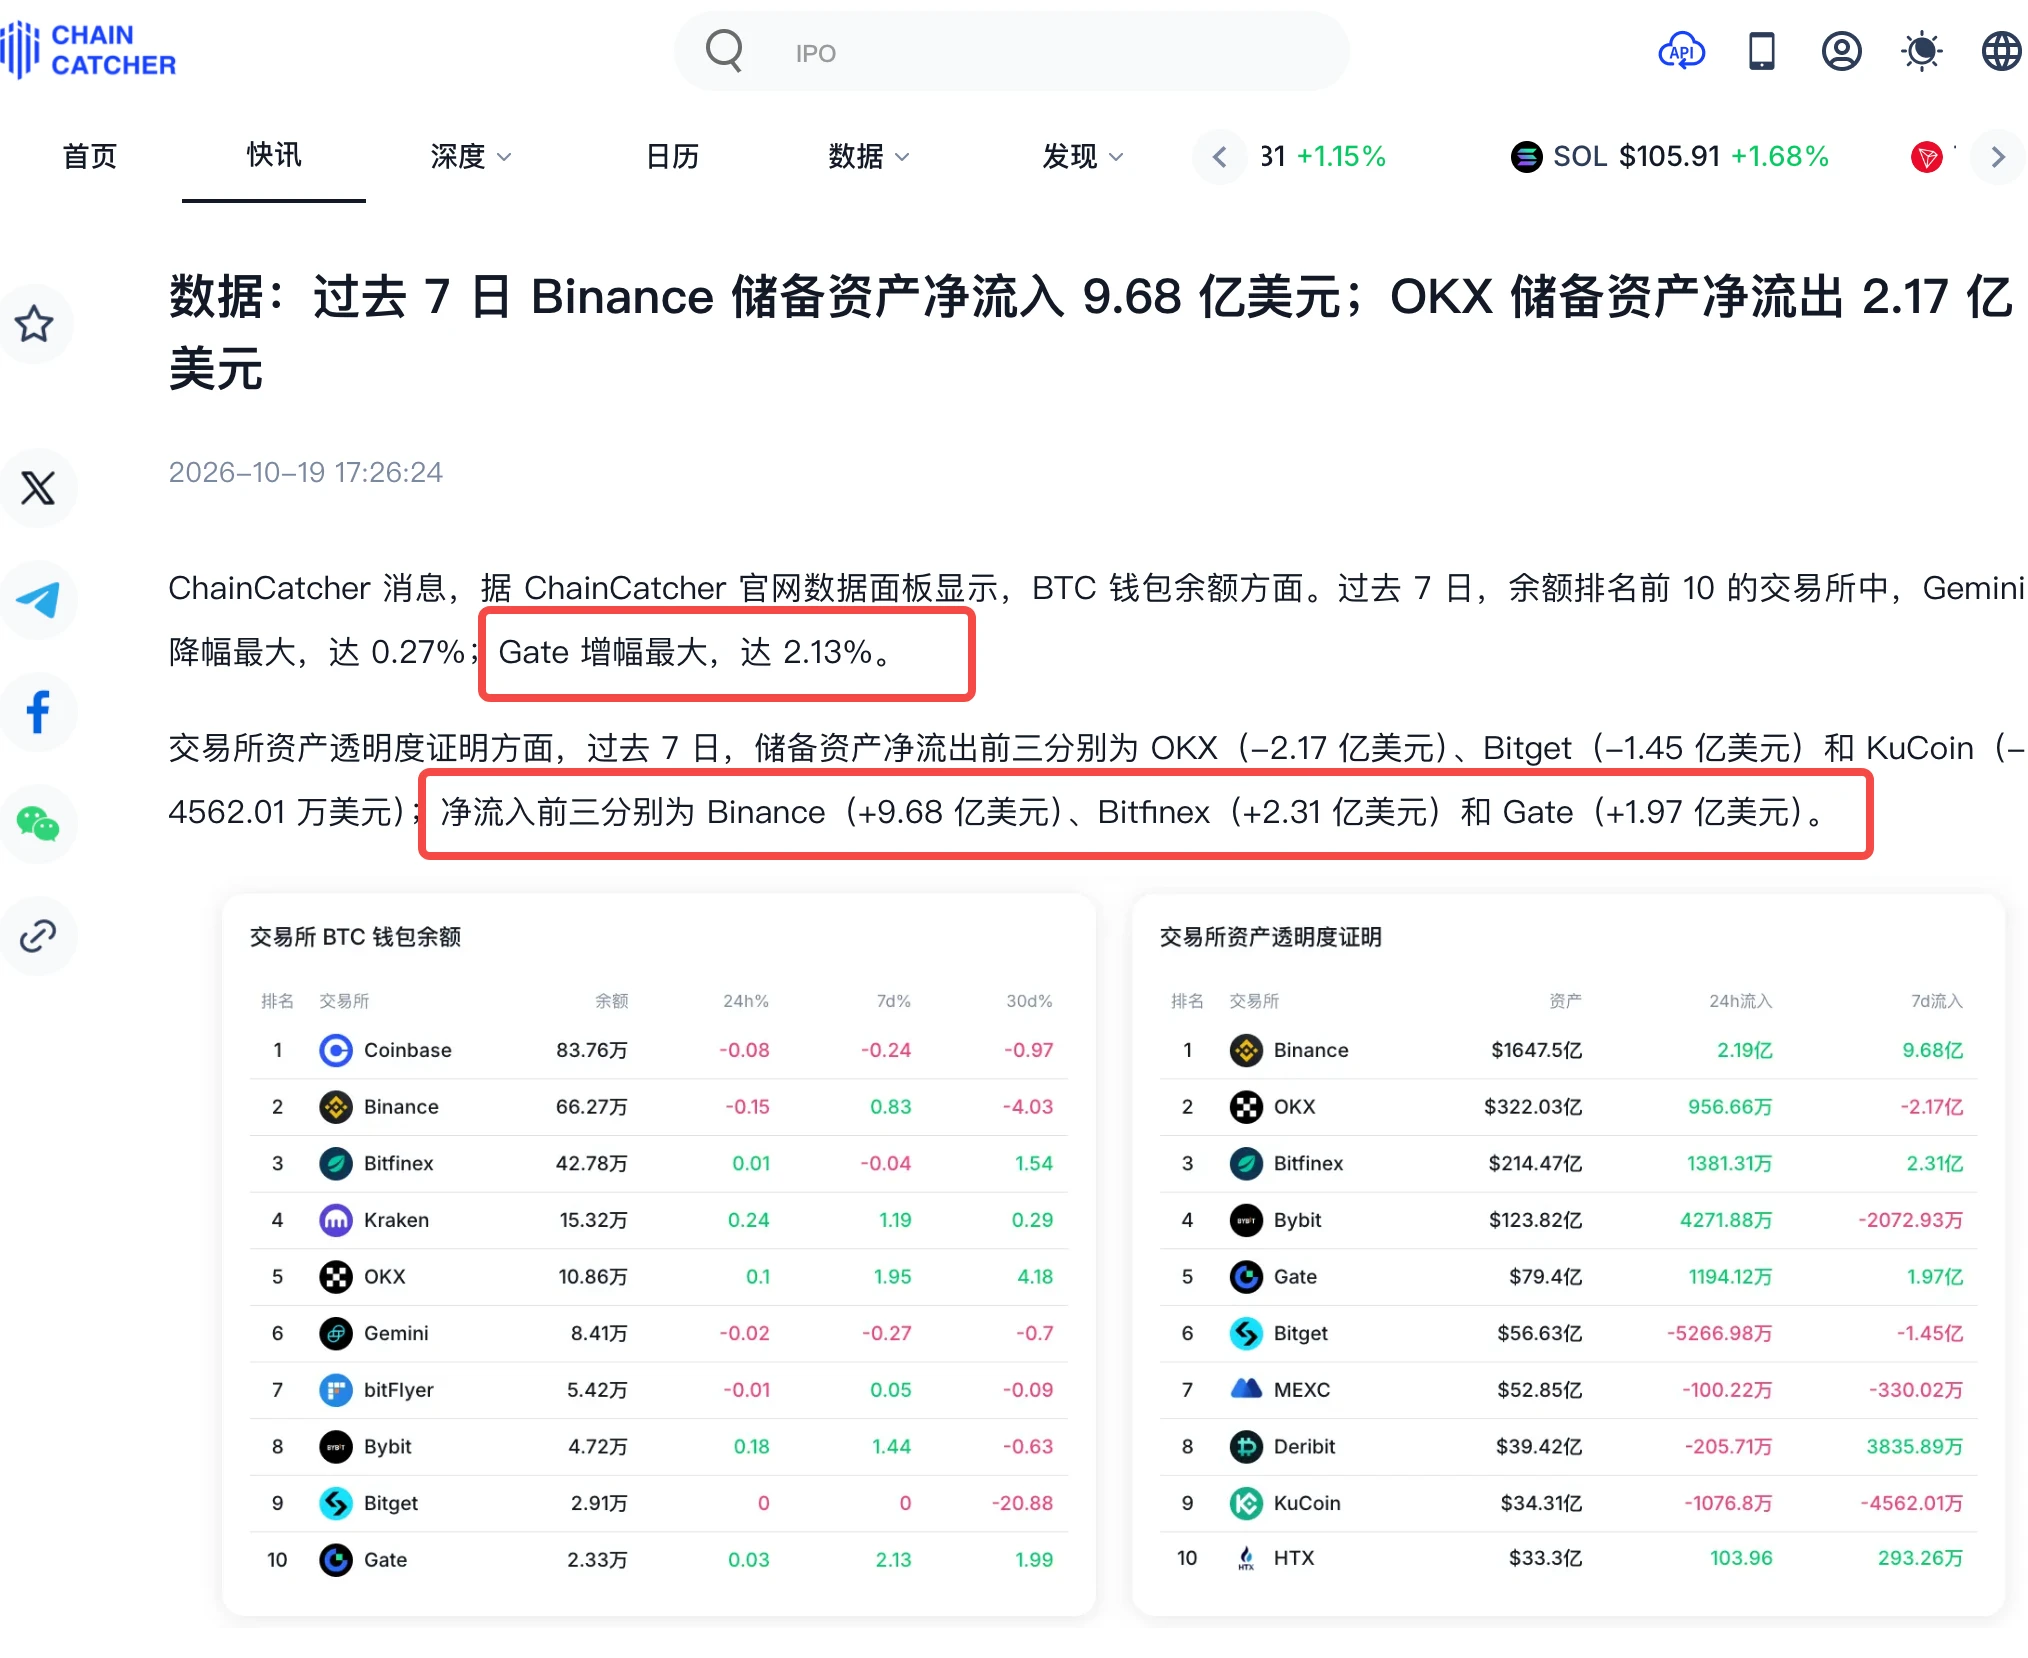
Gate has recorded approximately $300.43 million in net capital inflows over the past seven days, placing it among the top three globally according to the latest DeFiLlama-based data. The figure is significant because it shows that capital movement toward Gate has remained strong even while the broader crypto market is dealing with elevated volatility and changing macro expectations.
WHAT DOES $300M+ NET INFLOW ACTUALLY MEAN?
Net inflow is not simply the amount of money entering an exchange. It represents the difference b
post-image
Falcon_Official
#GateTops7DayNetInflowsGlobally
Gate is making a strong statement through capital flows. According to DeFiLlama data, Gate recorded approximately $273.72 million in net capital inflows over the past 7 days, placing it among the top three centralized exchanges globally. For an exchange, this is more than just a large number on a dashboard—it shows that a significant amount of capital has moved onto the platform after accounting for outflows.
The important word here is “net.” If users deposit $500 million but withdraw $226 million during the same period, the net inflow is roughly $274 million. That means the headline figure is measuring the difference between money coming in and money leaving, rather than simply counting deposits. This makes a sustained positive seven-day figure a useful indicator for understanding where exchange liquidity is building.
A seven-day window is particularly interesting because it filters out some of the noise that can appear in a single day. One large transfer can make a 24-hour ranking look impressive, but maintaining strong net inflows across an entire week suggests broader activity. Capital may be arriving for spot trading, derivatives, portfolio repositioning, new listings, hedging or simply to keep funds ready for opportunities.
There is another reason this number deserves attention. Exchange inflows should never be interpreted as an automatic bullish signal for the entire crypto market. Coins moving onto an exchange can eventually be used for buying, but they can also be deposited for selling or hedging. The stronger interpretation comes when capital inflows are combined with trading volume, price action, stablecoin liquidity and user activity. In other words, inflow tells us where capital is moving; market behavior tells us what that capital is actually doing.
Gate's broader flow picture also adds context. DeFiLlama data cited by Gate showed approximately $520.45 million of net inflows over the past month, ranking Gate third among centralized exchanges globally. The seven-day figure therefore fits into a larger story of meaningful capital movement rather than appearing as an isolated one-day event.
For traders, this is the part I find most interesting. If strong net inflows continue while trading activity expands, liquidity becomes an increasingly important part of the Gate ecosystem. More available capital can support deeper market participation and provide traders with greater flexibility when volatility creates opportunities. But if inflows rise while prices weaken sharply, the interpretation becomes more complicated because those funds could be positioned for selling or defensive strategies.
The recent data also shows how quickly rankings can change. Another September 3 snapshot from DeFiLlama placed Gate's seven-day net inflow at $78.19 million and ranked it first among global centralized exchanges, highlighting that exchange-flow figures can move rapidly as deposits and withdrawals change. The key takeaway is therefore not to treat one snapshot as permanent, but to watch whether positive capital-flow momentum continues over multiple periods.
For Gate, the $273.72 million seven-day net inflow is still a notable milestone. It puts the exchange firmly on the global capital-flow radar and gives the community another metric to watch beyond simple trading volume. If the next weekly readings remain positive and are accompanied by stronger activity, that would make the trend considerably more meaningful.
Capital follows opportunity, but the smartest signal is not simply seeing money arrive. The real signal is seeing whether that capital stays, participates and contributes to sustained market activity.
@Gate_Square
repost-content-media
BTC-1.58%
  • 5
Hi @grok can we go back to 2010?
Layout for Bitcoin, Ethereum, and Dogecoin
live-cover
LIVE2,093
  • 1
The market moved more cleanly than expected. After this wave of $ZEC pulled back and stabilized, I added to my long position as planned, entering around 828.40. At the time, the only basis was a clear bottoming signal in the structure: the low-volume retracement did not break the previous low.

The process was not entirely smooth. There was a false downward wick that swept the lows, but it quickly recovered, showing that support at lower levels was still there. I did not chase the move by adding to my position, nor was I shaken out by that wick. I patiently waited for the first target to be r
post-image
ZEC+6.55%
BNB-0.05%
SOL-1.72%
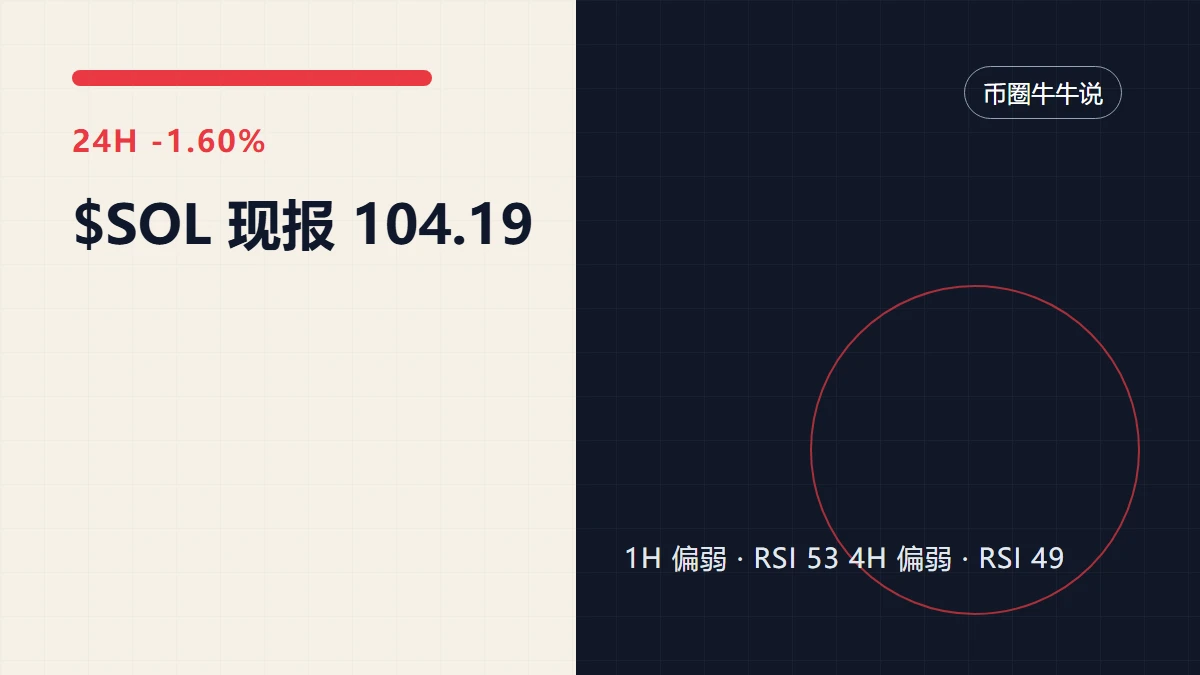
Everyone’s chasing longs while the 4H quietly whispers a different name—$SOL /USDT.

$SOL /USDT - SHORT

Trade Plan:
Entry: 101.69 – 102.01
SL: 103.38
TP1: 100.70
TP2: 99.94
TP3: 98.79

Why this setup?
Why now?
- 1D trend is *range*, not momentum—meaning we fade rips, not chase them.
- RSI on 15m sits at 51.67—neutral, but the SHORT bias (55 conf) leans on the 4H structure.
- Entry zone 101.85–102.01 is the line in the sand; invalidation at 102.31 keeps risk tight.
- ATR 1H at 0.636 shows low volatility—perfect for a controlled scalp down to TP1 at 100.70 before the real dump to 99.
SOL-1.72%
On Fomo, it’s basically winner-takes-all—more insane than futures.
Even earning $2,000, I’m already ranked 2,000th.
There are probably at least several hundred thousand users on here.
The proportion of people losing money is extremely high; only a tiny number of top players take it all.
post-image
$Bonk #Bonk Bonk Breaks Crucial Descending Trend Line, It Can Give 50%+ Bullish Rally
post-image
BONK+6.64%
“Content Creators” Among 60 Million
Among Gate’s 60 million users, I probably belong to the group that “loves writing.”
I like posting on the Square. Writing market analyses, sharing trading experiences, and reflecting on lessons from losing money. Sometimes, after finishing a post and reading it again, I think, “So this is what I was thinking at the time”—writing is the best way to review and reflect.
And there are genuinely people on the Square who read, comment, and tip. That feeling of “my views have been seen” makes me even happier than making money from trading.
Each of Gate’s 60 million
MU+5.89%
Everyone’s staring at the 1D range—but the 4h clock just started ticking against $ETH /USDT.

$ETH /USDT - SHORT

Trade Plan:
Entry: 2445.80 – 2452.56
SL: 2481.60
TP1: 2424.87
TP2: 2408.66
TP3: 2384.34

Why this setup?
Why now?
- The 4h structure is armed SHORT at 2449.18, not a random guess.
- RSI on the 15m (45.84) shows weak bounce fuel, not momentum.
- ATR (13.5) confirms tight compression—breakouts here sting faster.
- Targets stack down: 2424 → 2408 → 2384, while invalidation sits far at 2461.
- Range day + compressed volatility = sniper window, not a trend day.

Debate:
If
ETH-2.35%
I’ll also launch a challenge: the challenge is on the SOL and RH chains, using LP to farm an A7. Why isn’t there BSC? It can’t be done on BSC. Nothing I can do—can’t do it even if I want to. Just watch it unfold. Going to bed.
@lpagent_io
SOL-1.73%
#HYPEBreaks88HitsNewAllTimeHigh
HYPE/USDT: correction or pause before next leg?
Current price: $83.82 (-3.09% in 24h)
24h High: $87.39 / Low: $83.48
Volume: 352.29K HYPE (turnover $30.01M) – below average (last bar 51.65K vs MA5 344.24K)
Technical indicators (from chart):
· EMA5: 84.02 → price slightly below, indicating short-term weakness
· EMA10: 82.57 / EMA30: 74.53 → price still above both, confirming medium-term uptrend
· BOLL(20,2): UB 93.99 / MB 78.64 / LB 63.30 → price in upper half but closer to mid-band; not overextended
· MACD: -0.11 (DIF 5.91 < DEA 6.02) → bearish crossover, momen
post-image
HYPE-2.17%
  • 5
When that upper wick appeared a few days ago, my first reaction was not to chase a short, but to see whether it could hold the key level. The subsequent rebounds were all noticeably weak, showing that buying support at the highs was insufficient, so I entered short in batches during the rebound. The position was split into two trades, 80% and 20%. I closed the first after it caught the rapid sell-off, then moved the protection level lower on the remaining 10% position, hoping to let the profits run a little further. Later, the candlesticks spent quite some time grinding below $MAGMA without ma
post-image
MAGMA+12.74%
SOL-1.72%
LAB+5.39%
#BTCReclaims80K
$BTC
THE $80K BATTLE IS BACK
Bitcoin is currently trading around $79,540, putting the market directly beneath the psychological $80,000 level again. BTC recently pushed above $80K and even traded above $81K, but the latest move has pulled price back toward the $79.5K area. This makes the current zone more important than simply asking whether BTC can touch $BTC the real question is whether buyers can reclaim it and hold it as support. Recent market coverage also shows BTC briefly reaching the $82K area before giving back part of the move, confirming that volatility around t
post-image
BTC-1.58%
  • 14
Bull-Bear Divide Deepens Around $82K! B.TOP Founder Sells All His BTC and Waits to Buy Back at $70K.
live-cover
LIVE1,385
Where will $MARSCOIN land next 🧐
If anyone tells you it will dump now, block them first. It just had a correction on the 15-minute and 1-hour charts. Just look at the RSI levels; they went from overbought to below 50 and are curling up again. This is good for bulls aiming for further highs, like 0.25 to 0.3. Bulls have taken full control. I won’t be damned to think it will hit 0.5 today... Haha 😂
I suggest those who want to open a short position wait for the 0.15 horizontal support to break. Bearish signs will show when the price struggles to hold above the MA99 on the 15-minute chart and th
MARSCOIN+44.15%
  • 2
Making money is so hard—who on earth is actually making money?
post-image
$ONG /USDT Quick Update: ONG trades near $0.09671, down 5.13%, after rebounding from $0.09378. Buyers defend $0.09504, while $0.09691–$0.09727 is immediate resistance. Breakout could target $0.09858. Buy zone: $0.0950–$0.0960; TG1 $0.09727, TG2 $0.09858; SL $0.09370. Ontology recently restored mainnet after security review; ONG remains its gas token. 200M ONG burned in 2026, supply capped at 800M, tightening tokenomics further. $NVDA$NAS100
ONG-4.57%
NVDA+0.87%
NAS100+0.06%
If only I had exited when it fell😭
post-image
Load More

Join 40 M users in our growing community

⚡️ Join 40 M users in the crypto craze discussion

💬 Engage with your favorite top creators

👍 See what interests you

View More