
Square
Following
Hot
News
Notifications
Profile
Share your thoughts
placeholder
Article
$ESPORTS Holy shit, it’s suddenly pumping hard. There’s a lot of trapped supply overhead, so it can’t go much higher. Guys who didn’t short at the bottom, be careful chasing longs and look for a chance to short the hell out of it
post-image
ESPORTS-5.30%
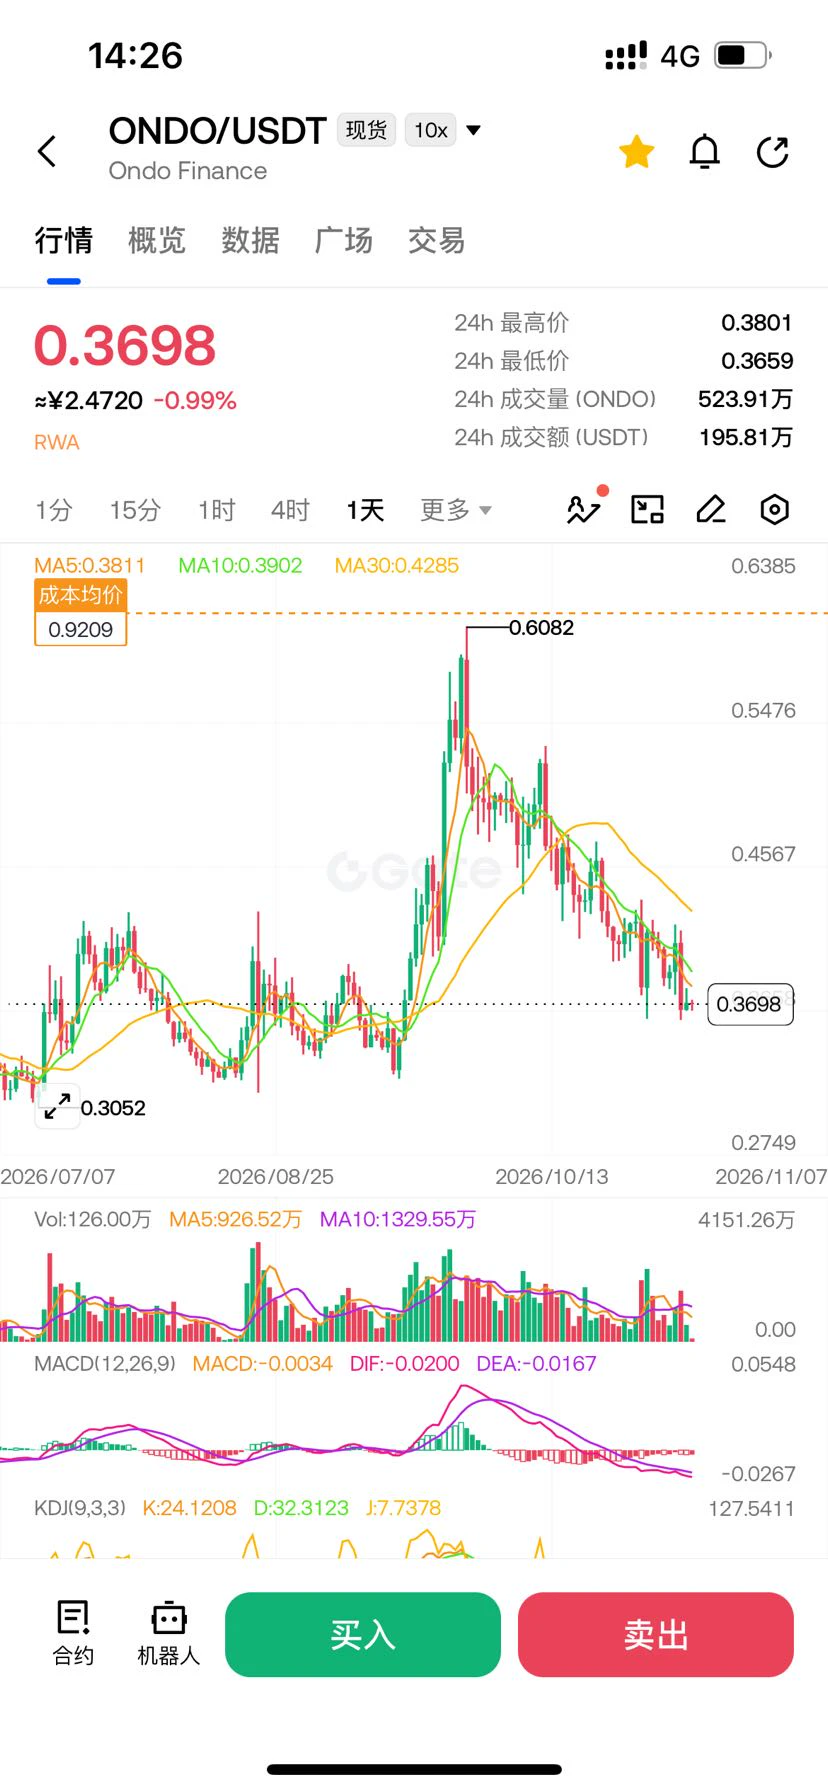
$ONDO The traditional finance angle has been talked up for over half a year, and looking back now, this scene is especially interesting—the coins with the biggest stories to tell have fallen the hardest, while the ones with real business behind them are still standing. Nobody wants to say it: ONDO has dropped from where it was six months ago, shed more than 20% in a month, and fallen another 10% in 7 days. It’s huddled at its 7-day low on shrinking volume, with nobody hyping it or rushing to buy. People hyped it up as a talking point—“traditional finance and blockchain are merging,” how grand!
post-image
ONDO-0.29%
Trenches
ZIG
Z
bade
b
ZIG
0x8c...1145
Market Cap
$.
Change
.
24h Vol
$.
Holders
.
BTC
B
bade
b
BTC
C5xp...pump
Market Cap
$.
Change
.
24h Vol
$.
Holders
.
GM
G
bade
b
GM
0x13...7777
Market Cap
$.
Change
.
24h Vol
$.
Holders
.
Diamond
D
bade
b
Diamond
5VCE...pump
Market Cap
$.
Change
.
24h Vol
$.
Holders
.
STONK
S
bade
b
STONK
6GmA...UNgx
Market Cap
$.
Change
.
24h Vol
$.
Holders
.
[New Streamer] Market Prediction
live-cover
LIVE1,636
$BTC Pay attention to the higher time frames. The lower time frames are too difficult to trade—afraid of going long at the top or short at the bottom.
As long as the weekly chart doesn't break below 70,000, I still see this as the early bull market. Those saying it will fall to 30,000 or 40,000, show your orders. Are you holding any short positions?? If not, could you analyze things rationally?? Why keep calling for 30,000 or 40,000?
Looking at the 4h chart, BTC is near the lower boundary of the ascending channel, with a confluence level at 70,500. The two relatively important support levels a
BTC-0.67%
$APP ‌

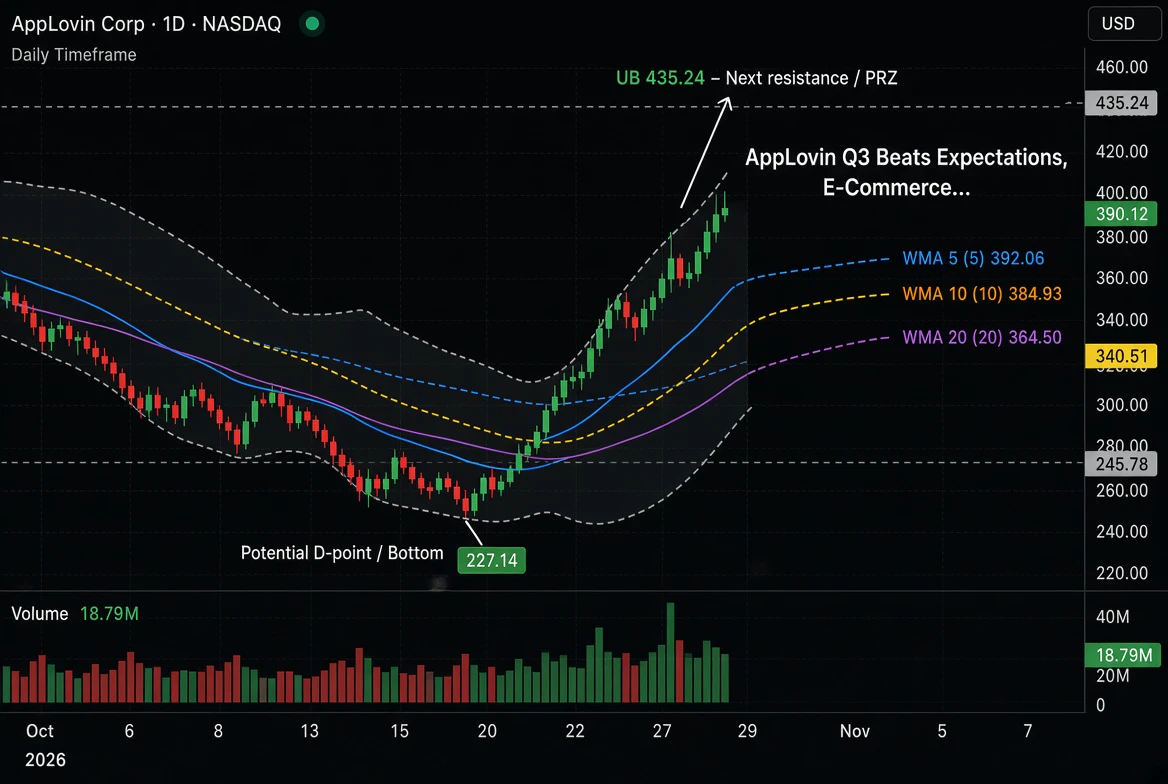
Decoding the Bull Run: Analyzing AppLovin (APP) with the Gartley Pattern

While the chart above for AppLovin Corp (APP) shows a massive bullish breakout (up nearly 10% in a single session), we can use the principles of the Gartley pattern and the visible technical indicators to understand the momentum behind this move and where the stock might be headed.

Analyzing the APP Chart

Looking at the daily chart for AppLovin, we see a textbook example of harmonic movement turning into a parabolic trend.

1. The "W" Formation (The Setup)
If we look at the price action leading up to the recen
post-image
APP+9.73%
  • 3
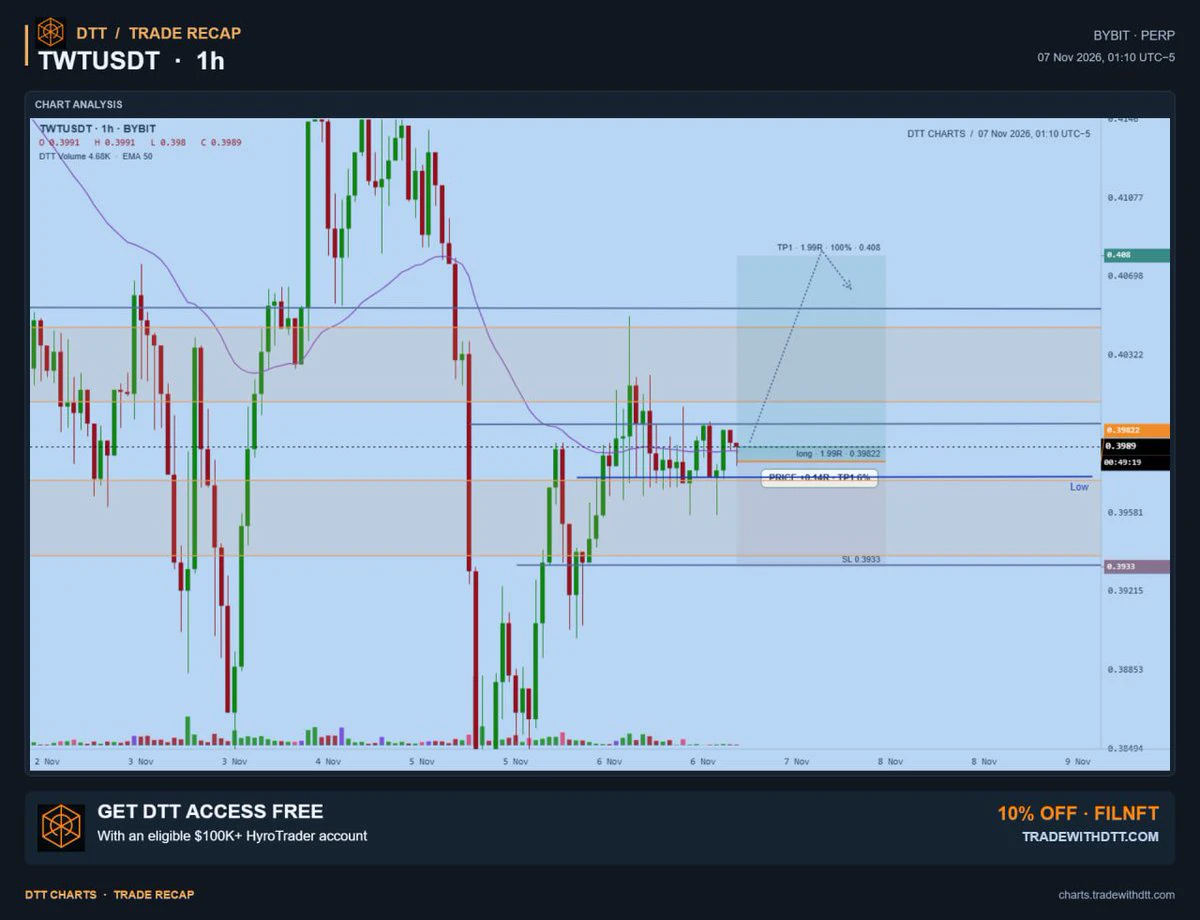
Entered a new long on $twt
SL: $0.3933
Tp: $0.408
2RR
— DTT
post-image
TWT-1.16%
November recruitment call—laying it all out clearly.
Different account sizes, different trading rhythms: ≤20,000 U for short-term swing trades and quick in-and-outs; 20,000–50,000 U for a flexible mix of swing trades and medium- to long-term positions; ≥50,000 U for medium- to long-term trend positioning. Don’t blindly chase trades—choose a timeframe that fits your account size.
Last week: 13 trades, 12 wins, netting 9270 points. The trading rhythm is all documented. If you want to follow along, join us for the November swing-trading cadence. $BTC ‌$ETH ‌#10月非农数据聚焦
post-image
BTC-0.65%
ETH-1.23%
I spent all day and night thinking about it, and still couldn’t figure out where the fourth hole is.
post-image
The night before the jobs report, what scares me most isn’t bad data—it’s setting a stop-loss only to get stopped out for nothing again. Expectations are for 65K new jobs and a 4.2% unemployment rate. If the numbers come in near expectations, the market will yawn; the farther they are from expectations, the more interesting things get. But every time my stop gets hit, the market turns around. I’m honestly afraid to set one now. What about you?
post-image
Research shows that you shouldn't short Ethereum before 9 p.m. Monday. Try to wait until about an hour before the US stock market opens to start shorting; one wrong move and you're trapped. Chasing shorts or longs gets you rekt fast. The current range-bound market is between 2,170 and 2,440: you can go long around 2,200, short at 2,300, and add to your short at 2,430. Bitcoin at 75,200 is a good level for a small long position, and around 80,000 for a short. For ultra-short-term trading, any level works. In crypto, short positions have a 70% win rate and long positions a 30% win rate. That's a
post-image
ETH-1.26%
BTC ETFs bleed continuously, $870 million evaporates! Has Bitcoin's bull market engine stalled?

The Bitcoin market has recently seen a major capital retreat. U.S. spot BTC ETFs recorded cumulative net outflows of nearly $870 million this week, and institutional buying that once seemed unstoppable now appears to have suddenly gone quiet.
It’s like a party where institutions once lined up to get in, but now some are leaving early. The question is, is the party really over?
From a capital-flow perspective, sustained ETF outflows can indeed weaken incremental buying in the spot market. If selling
NVDA+2.80%
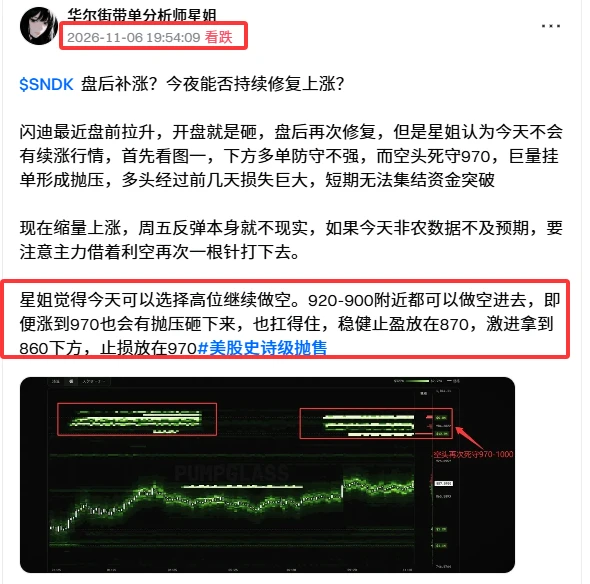
$SNDK The anticipated reversal failed to materialize, and prices fell back again🔥

Star Jie said last night that SanDisk wouldn’t see a strong recovery, and that any recovery would have to wait until next Monday. It’s the weekend, after all, and the overhead supply hasn’t been fully cleared. There aren’t enough buyers chasing the rally, so it’s inherently difficult to push prices higher. They were dumped back to around 810.

However, SanDisk now appears to be holding firmly above 800, and it also saw a brief recovery toward the close. Star Jie estimates that SanDisk will rally on Monday#美股AI板
post-image
SNDK-0.18%
#每周来晒 #AITechSelloffPutsCryptoUnderPressure The Cross-Asset Spillover: High-Beta Tech Deleveraging Liquifies Crypto Margins

A synchronized liquidation wave is rippling across global financial desks as a severe unwind in artificial intelligence and semiconductor valuations spills directly into the digital asset ecosystem. When institutional risk parameters breach their tolerance thresholds in traditional equities, multi-strategy funds routinely treat liquid crypto allocations as an immediate capital source to cover margin calls and stabilize balance sheets. This structural capital flight has s
post-image
BTC-0.67%
ETH-1.26%
USDC+0.01%
NDAQ+0.28%
What Is the Risk-Reward Ratio? Why Can a Trading Strategy with a High Win Rate Still Lose Money Over the Long Term?

In cryptocurrency trading, some traders place great importance on their win rate. They want to win at least seven out of ten trades, believing that as long as they make the right call often enough, they can keep making money.

But real trading results depend not only on how many times you win, but also on how much you earn on each winning trade, how much you lose on each losing trade, and how high your trading costs are.

That is why the risk-reward ratio and win rate must be an
post-image
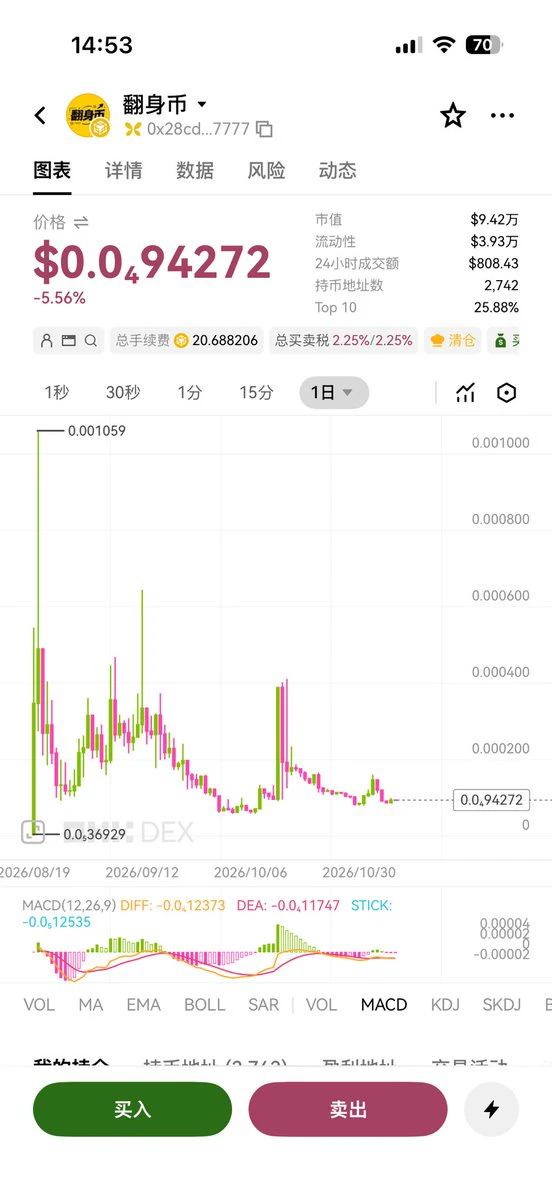
You bought Liang Gou’s comeback coin, and you’ll never turn your life around in this lifetime.
post-image
Layout: Bitcoin, Ethereum, Dogecoin
live-cover
LIVE1,320
  • 1
#Gate股票畅聊季 #美股史诗级抛售 #每周来晒 Apple “Doesn’t Need the Money” Yet Borrows $7 Billion: A Game of Using Your Savings to Buy Its Stock

Apple has issued bonds. For the first time in over a year: $7 billion, in seven tranches, with maturities from 2 to 10 years.
When the news broke, many people’s first reaction was: It has $137 billion in cash on its books, $145 billion in annual operating cash flow, and only $80 billion in debt. Why borrow?
That question gets to the heart of the matter. But it points in the wrong direction. The real question isn’t “Why is Apple borrowing?” It’s this: Why would a compa
What's going on?
Why is there so much drama today ….
post-image
#USAIStocksHitHard
Pi utility: I want Pi to buy ___ in my city. Fill blank. Core Team is listening 👂
#PiNetwork
#ShareWeekly
#GateSquare
#WCTCS9
post-image
PI-0.60%
Load More

Join 40 M users in our growing community

⚡️ Join 40 M users in the crypto craze discussion

💬 Engage with your favorite top creators

👍 See what interests you

Trending Topics

USAIStocksHitHard

15.97k Views3.64k Discussing

U.S. stocks sold off sharply on Thursday, November 5 (UTC). The Nasdaq closed down around 5.5%, entering correction territory, while the Philadelphia Semiconductor Index plunged roughly 12%, with chip stocks including $NVDA and $AMD posting steep losses. Beyond profit-taking, investors are growing concerned about the pace of AI data center construction, capital spending, and future returns on investment. The key question now is whether the AI sector’s lofty growth expectations need to be repriced. Where do you think the next opportunities will emerge: chip stocks, tech giants, or other sectors?

USNonfarmPayrolls

23.64k Views4.25k Discussing

StakeOnLaunchpoolToShare450KVLX

2.62k Views773 Discussing

View More