








#WCTCS9 Crypto Faces a “Black Weekend”—Who Hit the Sell Button?
Over the weekend, the crypto market was hit by another wave of sharp price declines and deteriorating sentiment.
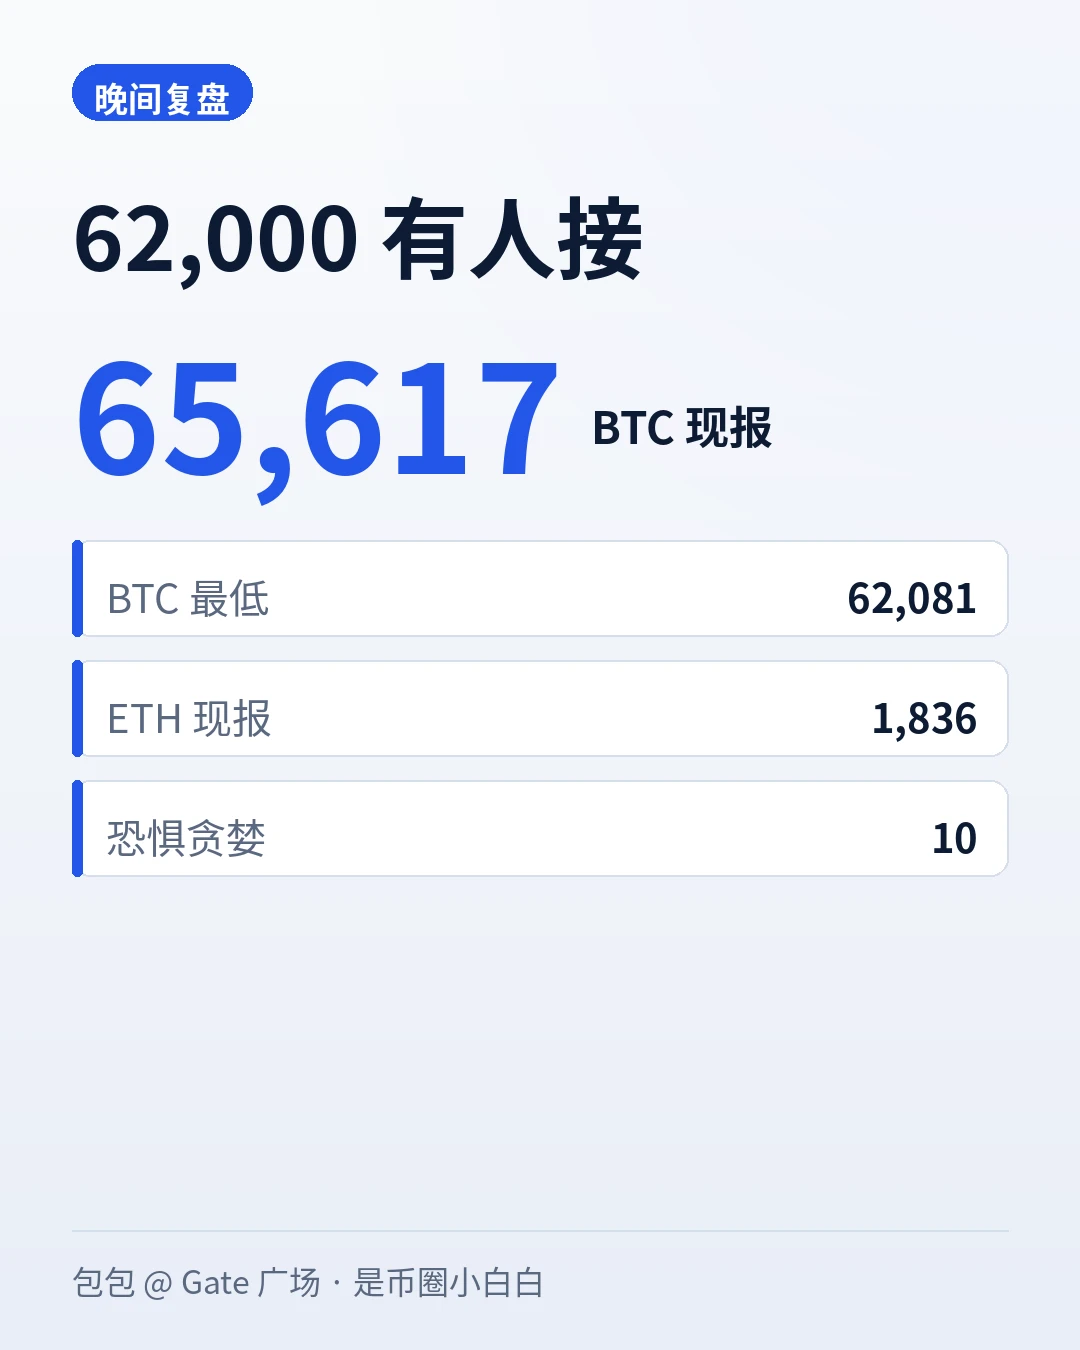
In just two days, Bitcoin repeatedly lost key levels, falling from $69,000 on Saturday to a low of $62,000 this morning and wiping out nearly all of its gains over the past three months. Fear quickly spread through the market, while selling pressure continued to mount. Successive waves of large-scale liquidations further deepened the decline, badly hurting leveraged traders. Even many seasoned market veterans struggled to withstand this sudden shock.
This sharp pullback has sent a chill through the entire crypto market. Since reaching an all-time high of about $4.37 trillion in October 2025, the global crypto market cap has nearly halved, shedding more than $2.1 trillion.
The crypto market is now facing a severe stress test.
Crypto Market Hit by Rare Sell-Off, with Selling Pressure Mainly from the US
A fresh wave of selling has swept across the crypto market. Although US stocks staged a temporary rebound, it failed to reverse the continued downtrend in crypto assets. CoinGecko data shows that Bitcoin briefly fell below $63,000 early on November 15, hitting a low of $62,000 on OK, down about 28.7% from its September peak of $87,000 and 14.5% over the past week. Well-known trader Flood wrote on November 15 that this was one of the most aggressive and price-insensitive BTC sell-offs he had ever seen. Seeing flows like this makes one wonder whether large sellers have access to certain information, or whether hidden leveraged positions are being forcibly liquidated; he warned that blindly placing buy orders without assessing the situation could easily make one a target. Flood went on to list several possibilities: Did sellers learn about certain geopolitical events in advance, with BTC happening to be the most liquid asset to trade over the weekend? Did they have information about quantum computing? Were they selling ahead of a larger wave of forced sellers? Or was the sell-off itself caused by liquidations? In the last case, Flood believes it could instead signal an opportunity to place bids and absorb selling pressure. He also noted that almost all the selling took place on Coinb, and was concentrated mainly over the weekend. Prices continued to fall, but no strong rebound followed the deep correction, while investor confidence sank to rock bottom. PAData, a crypto market data and cycle indicators platform under PANews, says the Crypto Fear & Greed Index has fallen to 10, with the market stuck in “Extreme Fear” territory for several consecutive days.
David Lawant, head of research at Anchorage Digital, also believes Bitcoin’s selling pressure is still coming mainly from the US. A chart he shared shows that from November 9 to 14 UTC, the cumulative volume delta (CVD) for Coinb’s main BTC spot trading pairs fell to around -8,900 BTC, meaning aggressive sell volume exceeded aggressive buy volume by about 8,900 BTC—the most pronounced selling pressure among the four exchanges shown.
By comparison, over the same period, CVDs for An'an and Byb were around -3,100 BTC and -700 BTC, respectively, while OK was around 1,400 BTC.
Bitcoin’s continued decline has further increased the pressure on Strategy, the world’s largest Bitcoin DAT company, whose holdings are now showing more than $10.7 billion in unrealized losses. Ethereum has fared even worse, with a significantly steeper decline than Bitcoin.
ETH briefly fell below $1,800, down about 22.5% over the past week. Ethereum has fallen to 98th in the global asset market cap rankings, just $1.92 billion away from dropping out of the top 100. BitMine, the world’s largest Ethereum DAT company, is sitting on $9.65 billion in unrealized losses on its holdings, nearly half their total cost.
The sell-off has rapidly shrunk the crypto market’s total capitalization, with losses continuing to mount. CoinGecko data shows that as of November 15, the global crypto market cap had fallen to $2.23 trillion, shedding more than $554 billion over the past 10 days—making this one of the largest sell-offs in history. Only four other periods have seen a greater 10-day decline in market capitalization: May 2021, October and November 2025, and February 2026.
From Macroeconomic Tightening to ETF Outflows, the Crypto Market Faces Multiple Headwinds
Behind this correction, multiple negative factors have hit the crypto market in succession, intensifying selling pressure.
· Fed Rate Hike Expectations Rise, Keeping Macroeconomic Liquidity Under Pressure
Changes in the macroeconomic environment are eroding the appeal of risk assets. US inflation data for October came in above expectations, while a strong labor market quickly fueled expectations that the Fed would continue tightening monetary policy this year. According to CME FedWatch data, as of November 10, the market-implied probability of a 25-basis-point Fed rate hike in December had risen to 88.5%, up sharply from around 76.3% a week earlier.
Meanwhile, the yield on 10-year US Treasuries rose to about 5.16%, and a stronger dollar added further pressure on risk assets. This also diminished the appeal of allocating to highly volatile assets such as crypto. As a risk asset that generates no interest income, Bitcoin carries a relatively higher cost of holding in a high-interest-rate environment and faces a higher opportunity cost. When US Treasuries offer more attractive yields, some capital may shift to fixed-income assets, reducing the willingness to allocate to highly volatile assets.
· Consecutive ETF Net Outflows, Spot Demand Remains Weak!
ETFs have long been a key engine drawing institutional capital into the crypto market, but the tide has now turned, making them a major source of continued outflows in this downturn. According to SoSoValue data, US spot Bitcoin ETFs have recorded net outflows for three consecutive weeks, totaling more than $2.55 billion, with outflows of more than $1.07 billion last week alone. BlackRock’s IBIT was the main source of outflows, with $2.12 billion in net outflows since November, accounting for about 90.2% of total net outflows from US spot Bitcoin ETFs over the same period. Outflows from spot Ethereum ETFs have been even more severe. Since launching in July 2024, they have recently been going through their worst period of outflows, with net outflows for seven consecutive weeks totaling more than $2.41 billion—exceeding Bitcoin ETFs in both the scale and duration of outflows. Net outflows reached $1.61 billion in October alone, a record high, with BlackRock’s ETHA also serving as a major channel for outflows.
Moreover, demand for spot buying in the US market remains weak. CoinGlass data shows that the Coinb Bitcoin premium index has remained negative for 53 consecutive days, most recently at -0.07%, reflecting continued weakness in US buying demand. Notably, the index had turned positive on August 24 for the first time since May 19, reaching 0.0052% and briefly ending a 97-day stretch of negative premiums.
· Nvidia Leadership Shake-Up Hits Tech Stocks, Further Cooling Risk Appetite
On November 12, Nvidia announced that founder Jensen Huang had stepped down as the company’s CEO and a director, ending his 33-year tenure at the helm since founding the company in 1993. CFO Colette Kress took over as interim CEO, while the board launched a search for a new CEO. As a core company in the global AI industry chain, Nvidia’s leadership change quickly attracted market attention. Huang has long led the company’s strategic direction and business development. His departure not only brings new uncertainty to Nvidia’s future operations, but also prompts investors to reassess the growth outlook, valuations, and financing models of the AI industry.
Against a backdrop of mounting pressure on AI tech stocks, the news further heightened market volatility. Meanwhile, Anthropic has filed IPO prospectus documents and plans to proceed with its listing. The listing of large technology companies typically attracts market capital and investor attention. With risk appetite weakening, this could prompt some investors to rebalance their holdings and set aside funds for potential IPO subscriptions.
· US Midterm Elections Change the Balance of Power in Congress, Adding Uncertainty to Crypto Regulation
Changes in the policy landscape have added another layer of uncertainty to the crypto market. Following the US midterm elections, Democrats won control of both chambers of Congress, ending the previous arrangement in which Republicans controlled both.
The Trump administration’s relatively supportive stance toward the development of the crypto industry has long provided the market with a degree of policy optimism. But with control of Congress changing hands, Democrats will regain control over the agendas and oversight of key committees, influencing the review and progress of important legislation, including crypto market structure bills. In particular, control of key bodies such as the Senate Banking Committee could change, prompting the market to reassess the direction of future US crypto regulation. It should be noted that the change in the balance of power in the US Congress does not mean that US crypto policy will necessarily shift toward a comprehensive crackdown, but the increased uncertainty around policy progress has already become a factor affecting market sentiment.
· Key Support Levels Fall One After Another, Leveraged Liquidations Deepen the Decline
The market decline has gone beyond spot selling, with mass liquidations of leveraged positions further accelerating the downturn. This was especially true during weekend trading, when relatively thin liquidity makes large sell orders more likely to trigger sharp price swings. After Bitcoin repeatedly broke through key support levels, a large number of highly leveraged long positions were forcibly liquidated. The resulting selling pressure pushed prices down further and triggered more liquidations, creating a chain reaction that accelerated the market decline.
CoinGlass data shows that $2.024 billion in positions were liquidated across the market over the past 24 hours, affecting more than 318,000 traders. Long liquidations totaled $1.753 billion, while short liquidations totaled $271 million, making longs the main casualties of this wave of liquidations.
This downturn is not merely a price retracement, but also a reshuffling of the market’s narrative and capital dynamics. When the crypto market will stabilize and whether it can resume its uptrend remain to be seen. But for the market, the bigger challenge now may be how to regain buying support and investor confidence.$BTC
Over the weekend, the crypto market was hit by another wave of sharp price declines and deteriorating sentiment.
In just two days, Bitcoin repeatedly lost key levels, falling from $69,000 on Saturday to a low of $62,000 this morning and wiping out nearly all of its gains over the past three months. Fear quickly spread through the market, while selling pressure continued to mount. Successive waves of large-scale liquidations further deepened the decline, badly hurting leveraged traders. Even many seasoned market veterans struggled to withstand this sudden shock.
This sharp pullback has sent a chill through the entire crypto market. Since reaching an all-time high of about $4.37 trillion in October 2025, the global crypto market cap has nearly halved, shedding more than $2.1 trillion.
The crypto market is now facing a severe stress test.
Crypto Market Hit by Rare Sell-Off, with Selling Pressure Mainly from the US
A fresh wave of selling has swept across the crypto market. Although US stocks staged a temporary rebound, it failed to reverse the continued downtrend in crypto assets. CoinGecko data shows that Bitcoin briefly fell below $63,000 early on November 15, hitting a low of $62,000 on OK, down about 28.7% from its September peak of $87,000 and 14.5% over the past week. Well-known trader Flood wrote on November 15 that this was one of the most aggressive and price-insensitive BTC sell-offs he had ever seen. Seeing flows like this makes one wonder whether large sellers have access to certain information, or whether hidden leveraged positions are being forcibly liquidated; he warned that blindly placing buy orders without assessing the situation could easily make one a target. Flood went on to list several possibilities: Did sellers learn about certain geopolitical events in advance, with BTC happening to be the most liquid asset to trade over the weekend? Did they have information about quantum computing? Were they selling ahead of a larger wave of forced sellers? Or was the sell-off itself caused by liquidations? In the last case, Flood believes it could instead signal an opportunity to place bids and absorb selling pressure. He also noted that almost all the selling took place on Coinb, and was concentrated mainly over the weekend. Prices continued to fall, but no strong rebound followed the deep correction, while investor confidence sank to rock bottom. PAData, a crypto market data and cycle indicators platform under PANews, says the Crypto Fear & Greed Index has fallen to 10, with the market stuck in “Extreme Fear” territory for several consecutive days.
David Lawant, head of research at Anchorage Digital, also believes Bitcoin’s selling pressure is still coming mainly from the US. A chart he shared shows that from November 9 to 14 UTC, the cumulative volume delta (CVD) for Coinb’s main BTC spot trading pairs fell to around -8,900 BTC, meaning aggressive sell volume exceeded aggressive buy volume by about 8,900 BTC—the most pronounced selling pressure among the four exchanges shown.
By comparison, over the same period, CVDs for An'an and Byb were around -3,100 BTC and -700 BTC, respectively, while OK was around 1,400 BTC.
Bitcoin’s continued decline has further increased the pressure on Strategy, the world’s largest Bitcoin DAT company, whose holdings are now showing more than $10.7 billion in unrealized losses. Ethereum has fared even worse, with a significantly steeper decline than Bitcoin.
ETH briefly fell below $1,800, down about 22.5% over the past week. Ethereum has fallen to 98th in the global asset market cap rankings, just $1.92 billion away from dropping out of the top 100. BitMine, the world’s largest Ethereum DAT company, is sitting on $9.65 billion in unrealized losses on its holdings, nearly half their total cost.
The sell-off has rapidly shrunk the crypto market’s total capitalization, with losses continuing to mount. CoinGecko data shows that as of November 15, the global crypto market cap had fallen to $2.23 trillion, shedding more than $554 billion over the past 10 days—making this one of the largest sell-offs in history. Only four other periods have seen a greater 10-day decline in market capitalization: May 2021, October and November 2025, and February 2026.
From Macroeconomic Tightening to ETF Outflows, the Crypto Market Faces Multiple Headwinds
Behind this correction, multiple negative factors have hit the crypto market in succession, intensifying selling pressure.
· Fed Rate Hike Expectations Rise, Keeping Macroeconomic Liquidity Under Pressure
Changes in the macroeconomic environment are eroding the appeal of risk assets. US inflation data for October came in above expectations, while a strong labor market quickly fueled expectations that the Fed would continue tightening monetary policy this year. According to CME FedWatch data, as of November 10, the market-implied probability of a 25-basis-point Fed rate hike in December had risen to 88.5%, up sharply from around 76.3% a week earlier.
Meanwhile, the yield on 10-year US Treasuries rose to about 5.16%, and a stronger dollar added further pressure on risk assets. This also diminished the appeal of allocating to highly volatile assets such as crypto. As a risk asset that generates no interest income, Bitcoin carries a relatively higher cost of holding in a high-interest-rate environment and faces a higher opportunity cost. When US Treasuries offer more attractive yields, some capital may shift to fixed-income assets, reducing the willingness to allocate to highly volatile assets.
· Consecutive ETF Net Outflows, Spot Demand Remains Weak!
ETFs have long been a key engine drawing institutional capital into the crypto market, but the tide has now turned, making them a major source of continued outflows in this downturn. According to SoSoValue data, US spot Bitcoin ETFs have recorded net outflows for three consecutive weeks, totaling more than $2.55 billion, with outflows of more than $1.07 billion last week alone. BlackRock’s IBIT was the main source of outflows, with $2.12 billion in net outflows since November, accounting for about 90.2% of total net outflows from US spot Bitcoin ETFs over the same period. Outflows from spot Ethereum ETFs have been even more severe. Since launching in July 2024, they have recently been going through their worst period of outflows, with net outflows for seven consecutive weeks totaling more than $2.41 billion—exceeding Bitcoin ETFs in both the scale and duration of outflows. Net outflows reached $1.61 billion in October alone, a record high, with BlackRock’s ETHA also serving as a major channel for outflows.
Moreover, demand for spot buying in the US market remains weak. CoinGlass data shows that the Coinb Bitcoin premium index has remained negative for 53 consecutive days, most recently at -0.07%, reflecting continued weakness in US buying demand. Notably, the index had turned positive on August 24 for the first time since May 19, reaching 0.0052% and briefly ending a 97-day stretch of negative premiums.
· Nvidia Leadership Shake-Up Hits Tech Stocks, Further Cooling Risk Appetite
On November 12, Nvidia announced that founder Jensen Huang had stepped down as the company’s CEO and a director, ending his 33-year tenure at the helm since founding the company in 1993. CFO Colette Kress took over as interim CEO, while the board launched a search for a new CEO. As a core company in the global AI industry chain, Nvidia’s leadership change quickly attracted market attention. Huang has long led the company’s strategic direction and business development. His departure not only brings new uncertainty to Nvidia’s future operations, but also prompts investors to reassess the growth outlook, valuations, and financing models of the AI industry.
Against a backdrop of mounting pressure on AI tech stocks, the news further heightened market volatility. Meanwhile, Anthropic has filed IPO prospectus documents and plans to proceed with its listing. The listing of large technology companies typically attracts market capital and investor attention. With risk appetite weakening, this could prompt some investors to rebalance their holdings and set aside funds for potential IPO subscriptions.
· US Midterm Elections Change the Balance of Power in Congress, Adding Uncertainty to Crypto Regulation
Changes in the policy landscape have added another layer of uncertainty to the crypto market. Following the US midterm elections, Democrats won control of both chambers of Congress, ending the previous arrangement in which Republicans controlled both.
The Trump administration’s relatively supportive stance toward the development of the crypto industry has long provided the market with a degree of policy optimism. But with control of Congress changing hands, Democrats will regain control over the agendas and oversight of key committees, influencing the review and progress of important legislation, including crypto market structure bills. In particular, control of key bodies such as the Senate Banking Committee could change, prompting the market to reassess the direction of future US crypto regulation. It should be noted that the change in the balance of power in the US Congress does not mean that US crypto policy will necessarily shift toward a comprehensive crackdown, but the increased uncertainty around policy progress has already become a factor affecting market sentiment.
· Key Support Levels Fall One After Another, Leveraged Liquidations Deepen the Decline
The market decline has gone beyond spot selling, with mass liquidations of leveraged positions further accelerating the downturn. This was especially true during weekend trading, when relatively thin liquidity makes large sell orders more likely to trigger sharp price swings. After Bitcoin repeatedly broke through key support levels, a large number of highly leveraged long positions were forcibly liquidated. The resulting selling pressure pushed prices down further and triggered more liquidations, creating a chain reaction that accelerated the market decline.
CoinGlass data shows that $2.024 billion in positions were liquidated across the market over the past 24 hours, affecting more than 318,000 traders. Long liquidations totaled $1.753 billion, while short liquidations totaled $271 million, making longs the main casualties of this wave of liquidations.
This downturn is not merely a price retracement, but also a reshuffling of the market’s narrative and capital dynamics. When the crypto market will stabilize and whether it can resume its uptrend remain to be seen. But for the market, the bigger challenge now may be how to regain buying support and investor confidence.$BTC