Share your thoughts
placeholder
Article
Course Training Notice
3:30 PM
Content and Technical Training Review + Gold + Practical Training
post-image
GLDX-0.10%
PAXG-0.09%
XAU-0.04%
$BULLA Signal】Long + fund support + 1H momentum continuation
$BULLA 24-hour trading volume was $569 million, RSI4H rose to 71.8, and buy/sell order book imbalance reached 21.84%. The 1H MACD histogram is negative, but the decline is narrowing, while the price is holding 1H EMA20 at 0.0768. Short-term selling pressure has been quickly absorbed, with clear buying support.
🎯Direction: Long
⚡Entry/limit order: 0.08531927 - 0.08557600
🛑Stop-loss: 0.08472024
🚀Target 1: 0.08685964
🚀Target 2: 0.08750146
🛡️Trade management:
- After reaching Target 1, reduce the position by 50% and move the stop-l
post-image
BULLA-5.23%
BTC+0.18%
ETH+1.81%
SOL+2.84%
#BTCReclaims80K
#BTCReclaims80K
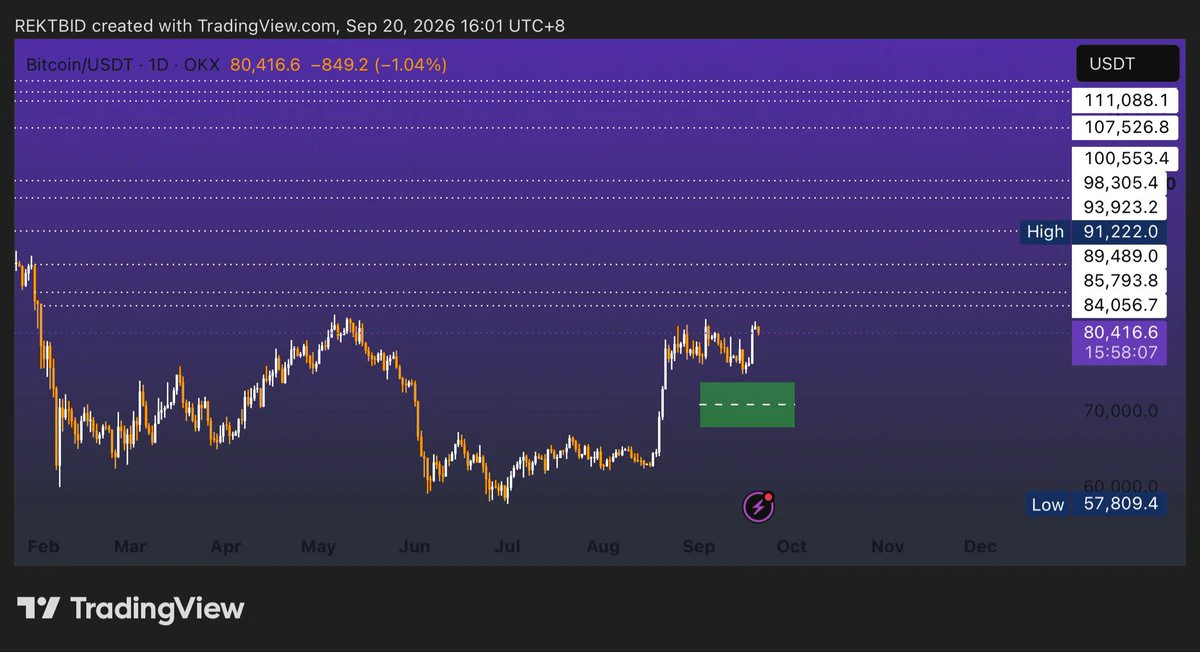
Bitcoin is back above the $80,000 level, and the market is once again paying close attention to what could be the beginning of another major move.
The $80K area is more than just a psychological number. For Bitcoin, round-number levels often become important battlegrounds where buyers and sellers aggressively compete. When BTC loses such a level, market sentiment can quickly turn cautious. But when Bitcoin manages to reclaim it and hold above it, the narrative can shift toward renewed bullish momentum.
The key question now is not simply whether Bitcoin can tou
post-image
BTC+0.18%
【$B Signal】Long + 1H recovery/funding rate stable
$B 1H RSI 62, price is running below the upper Bollinger Band at 0.1834, with the 1H structure intact. The 4H MACD histogram is narrowing, and bullish momentum is exhausted. Order book buy/sell volume is 0.87, with aggressive selling pressure dominant; funding rate is 0.0312%, with no excessive leverage. Risk-reward is approximately 1.5; position size should follow the short-term plan, with no increase.
🎯Direction: Long
⚡Entry/limit order: 0.180856 - 0.181400
🛑Stop loss: 0.179586
🚀Target 1: 0.184121
🚀Target 2: 0.185482
🛡️Trade management:
post-image
BTC+0.18%
ETH+1.76%
SOL+2.84%
In this $GIGGLE long, to be honest, holding it until now wasn’t because I was especially brave, but because the protective stop kept me disciplined. After entering, the price surged for a while, but I didn’t rush to close everything. I took partial profits in batches, and with a lighter position, my mindset stabilized. For the remaining orders, I moved the protective stop higher. Although the subsequent pullback took out many people’s stop-losses, my position remained because the price never touched the protective stop I had moved up.
Most pullbacks in the market are caused by people being una
post-image
GIGGLE-2.51%
BTC+0.18%
ETH+1.76%
Well it's my birthday again. Happy birthday dude. Zaheer.
post-image
This was purely because the market was in a good mood and casually tossed out some gold coins—I just happened to get hit on the head. While everyone else was rushing out, $TSLAX was secretly rebounding instead. When it moved up, the volume was even weaker than before, making the bull trap feel overwhelmingly obvious.

Now 357.15 has weakened directly, and +115.39% is in the bag—feels really good. The wait wasn’t for nothing; this opportunity came from simply holding out. Selling pressure has been strong for quite some time, and the failure of volume to follow was the biggest giveaway.

Mana
post-image
TSLAX+0.54%
ADA+2.82%
SNDK+1.37%
📝 Comprehensive Weekly Post-Class Notes | Technical Indicators Practical Module Concludes
Dear crypto friends, this week we completed the entire practical technical indicators module. From moving averages to Bollinger Bands, from MACD to KDJ, and from RSI to trading volume—six indicators, six dimensions, and a complete analytical framework.
These notes are both a post-class summary of Lesson 6 (trading volume) and a systematic review of the entire technical indicators module. We recommend bookmarking them for future reference.
I. Trading Volume—the Price Validator and Trend Fuel Gauge
Trading
  • 9
If your position is stuck, don’t rush to think about how to recover your losses. First, figure out one thing clearly: why did you get stuck?
The vast majority of trapped positions stem from just three causes: entering without setting a stop-loss, refusing to admit when you’re on the wrong side, and adding to a losing position to average down. If you don’t fix these three problems, even the gods can’t save you.
The truly practical way to get out of a trapped position isn’t complicated: First, reduce oversized positions. Take partial profits or cut exposure as the price rebounds to resistance, a
post-image
BTC+0.18%
I originally wanted to sell at a loss to appease the heavens, but the ritual failed and the meat ended up cooking itself. As the price repeatedly swung around during the session, $ZEC was still hovering near 833.19. Watching that low-volume surge, I knew right away—the rebound was weak, support was insufficient, and there would be no one to catch it even if it pushed higher. This was clearly a bull trap with a strong whiff of deception.
At the time, I told the brothers to open longs without hesitation and not get lured in by that little rebound. Hold as long as the trend remains intact; run w
post-image
ZEC+15.37%
ETH+1.76%
DOGE+6.46%
Layout for Bitcoin, Ethereum, and Dogecoin
live-cover
LIVE3,101
  • 1
Looks like my perspective was still a bit too narrow! Around 800 for zec, I called for a bullish move to 1,100, and the market has now reached a high of around 1,170! That’s a 370-point gain! Whether in futures or spot, that’s enough to fill your bags! Ever since zec decisively broke above its previous high, Qingyao has kept reminding everyone not to be afraid of the high price—you can’t short it! Continue following the trend and stay bullish toward 1,100! Navigation conditions always manage to prove to me the appeal of the swing-trading king! The swing trade has now been fully closed out! Fri
post-image
ZEC+15.24%
  • 1
Most traders will ignore LINK at 12.249—that’s exactly why you shouldn’t.

LINK/USDT - LONG

Trade Plan:
Entry: 12.219 – 12.279
SL: 11.956
TP1: 12.468
TP2: 12.615
TP3: 12.834

Why this setup?
Why now? The 4h chart is “Armed” with a 95% long confidence, while the 1D trend stays bullish—this isn’t a coin flip.
- RSI (15m) at 56.42 shows room to run before overbought.
- ATR (1h) of 0.1218 means tight stops, but TP1 at 12.468 is only 1.8% away—low hanging fruit.
- Invalid only below 11.460, so your risk is defined. The setup is compressed, and compression precedes expansion.

Debate:
Are
post-image
BTC Ð Market Updates
live-cover
LIVE1,099
Which influential wealthy figures in Shenzhen’s investment community are nearing 60?
Everyone’s chasing $MU /USDT longs at 1025—but the 15m RSI is screaming 85.7. Who’s really late here?

$MU /USDT - SHORT

Trade Plan:
Entry: 1024.05 – 1025.51
SL: 1033.89
TP1: 1017.94
TP2: 1013.39
TP3: 1006.55

Why this setup?
- 1D trend is **range**, not breakout—so this push up is a liquidity grab, not a trend shift.
- 15m RSI at **85.73** = overheated; mean reversion is the statistical edge right now.
- 4h bias is SHORT with 77% confidence; entry zone 1024.05–1025.51 is the exact resistance pocket.
- Why now? ATR (1h) is 2.92—tight stops are vulnerable; the first drop to TP1 (1017.
MU+1.12%
Most traders ignored the 4H signal on PEPE — now the range is about to decide who pays for the exit.

$PEPE /USDT - SHORT

Trade Plan:
Entry: 0 – 0
SL: 0
TP1: 0
TP2: 0
TP3: 0

Why this setup?
- 4H bias is SHORT with 55% conviction, but 1D trend is still *range*, not breakdown.
- 15M RSI sits at 51.2 — neutral, no overbought relief, no panic flush.
- Why now? The longer PEPE holds mid-range, the more violent the snap when it breaks. Waiting status means the trap is set, not sprung.

Debate:
Are you fading the range top or waiting for the 4H close below the midpoint to short PEPE?

⚠️ P
PEPE+3.30%
Most traders see LINK's bullish daily trend—I see a 4h trap set to trigger at 12.243.

$LINK /USDT - SHORT

Trade Plan:
Entry: 12.213 – 12.273
SL: 12.620
TP1: 11.960
TP2: 11.771
TP3: 11.488

Why this setup?
Why now? The 1D trend says up, but the 4h structure says otherwise.
- RSI 15m at 52.17—no momentum to break higher.
- ATR 1h at 0.12—tight coil, ready to snap.
- Entry zone 12.213–12.273 aligns perfectly with a liquidity grab before shorts run to TP1 11.960.
- 84% confidence isn't a guess; it's a freight train. The bullish daily is the bait.

Debate:
Are you fading the daily upt
LINK+4.20%
#BTCReclaims80K
Bitcoin’s Growing Twin: Why the Gold Correlation Just Hit 0.50
Here’s a development worth paying attention to: the 90-day correlation between Bitcoin and gold has surged to +0.50.
It’s the highest level we’ve seen since the COVID-19 crash of 2020. To put that into perspective, this metric has more than doubled since the start of the year. Back in 2022, during a relatively stable post-crash recovery, that same correlation peaked at a modest +0.30.
So, what changed?
The primary catalyst appears to be a specific policy shift from the U.S. Treasury. On August 19, they announced pl
post-image
BTC+0.18%
  • 2
Load More

Join 40 M users in our growing community

⚡️ Join 40 M users in the crypto craze discussion

💬 Engage with your favorite top creators

👍 See what interests you

View More