Square
Following
Hot
News
Profile
Share your thoughts
placeholder
Article
$SUI After breaking below the moving averages, can it still hold up in the short term?
Conclusion first: The technical picture has weakened; the rebound favors shorts rather than longs, and 1.0561 looks more like a continuation point in the decline than a bottom.
$SUI The current price is 1.0561, down 7.06% over 24h, with a trading volume of 112.7M USDT, indicating a high-volume sell-off. In terms of the moving-average structure, the price has fallen below MA5 and MA10, with MA5 beginning to cross below MA10 to form a short-term death cross. MA20 has turned downward after flattening, breaking
post-image
SUI-6.02%
ME-2.48%
MU “Shakeout” or “Distribution”? The main players’ intentions have been fully exposed! Don’t let the illusion of a mere “technical correction” blind you. While everyone is panicking and cutting losses over OpenAI’s “negative news,” the truly smart money is secretly celebrating. The seemingly massive net outflows on the fund-flow chart, along with the fig leaf of large sell orders, are nothing more than the main players staging an extreme-panic short squeeze—they want to fool every timid short-term trader before swallowing the last juicy opportunity ahead of the December buyback window all by t
post-image
MU-3.29%
  • 1
Morning Market Update
live-cover
LIVE1,374
$river S6 ended, and S7 started on the 11th. I took a break and didn’t check in during those 7 days.
I farmed a bit yesterday, and when I checked the 4fun leaderboard today, I found that fewer pts were being awarded.
This is really killing me.
I feel that S7’s Mindshare ratio is higher than S6’s. Why are the Daily Rewards lower?
I specifically had GPT analyze the two images below. Simply put, the AI’s conclusion is that the total Daily Rewards in S7 have decreased.
Previously, the pts for the top 15 could still be viewed, but now only the top 10 can be checked.
The main issue is still the pric
Hot CPI: October Hike Risk or Delayed Rate Relief?
Markets can tighten financial conditions before the Federal Reserve changes rates.
An upside CPI surprise matters most when it changes the expected policy path—not merely the headline.
The distinction helps explain when pressure on crypto and U.S. stocks could persist.
A surprise is not a verdict
If CPI exceeds expectations, October hike expectations could rise. But investors might instead anticipate fewer cuts or a longer hold. Without verified starting probabilities, the magnitude of that shift remains unknown.
Persistence matters more than
post-image
BTC-0.23%
GT-0.37%
ETH-2.68%
  • 1
Another day of getting our faces washed by a waterfall.
According to CoinGlass, liquidations totaled $1.204 billion over the past 24 hours, including $1.053 billion in long positions and $150 million in short positions. A total of 194486 people were liquidated.
The largest single liquidation occurred on Hyperliquid - ETH, valued at $19.9817 million.
Another victory for the bears. The bulls really are having a difficult journey, with so many forks in the road!
post-image
HYPE-1.93%
ETH-2.73%
  • 4
  • 2
$BTC
The script twists again: Bitcoin had just touched $87,000 before tumbling back to the $80k mark. ETF funds have switched sides, flowing in yesterday and out today. A single-day outflow does not mean institutions are fleeing; keep a close eye on $80k. Reclaiming $83,000 means there’s still hope; if it can’t hold, altcoins are in for pain 😅
post-image
BTC-0.23%
🚨 BREAKING 🚨
🇺🇸 BlackRock & other ETFs sold $244.10 million $BTC & $72.54 million $ETH , $321.6 million in combined outflows.
ETFs are finally taking profits?
BTC-0.23%
ETH-2.68%
Layout: Bitcoin, Ethereum, Dogecoin
live-cover
LIVE880
  • 6
$AVAX Key short-term levels are 10.18 and 9.68: the current price is 10.277, MA5=10.1826 has crossed below MA20=10.3064, and the short-term moving averages are weakening. However, the price remains above MA5, indicating weak consolidation after a sharp decline. It is down 6.67% over 24h, with a trading volume of 61.3M USDT. The volume does not indicate panic selling, suggesting that selling pressure is mainly from long-position reductions rather than a broad-based exit.
From a fund-flow perspective, the Fear & Greed Index remains at 59, still in the greed range, meaning that bottom-fishing fu
post-image
AVAX-4.24%
ORCA-10.84%
STRK+42.72%
Many people directly equate “the price has fallen” with “the trend has turned bearish,” which is the most common misconception in technical analysis. Whether a drop to the moving average is a breakdown or a pullback depends on the structure, not the magnitude of the decline itself.
$JTO Current price 0.5271, down 6.72% over 24h, but the structure has not deteriorated. MA5=0.52126 has crossed upward to sit just below MA20=0.527485, and the price is currently caught between MA20 and MA5, representing a typical moving-average entanglement rather than a bearish alignment. The MACD histogram remai
post-image
JTO-6.77%
ENA-1.88%
UNI-5.80%
gm frens
tgif 🎉
post-image
The market can move rapidly, and the most important question during such times is: Is your position management strategy ready?
I have recently moved entirely to cash; I do not hold any open positions. This does not imply a definitive view on the market's direction. Rather, it is a choice to preserve capital during a period of high uncertainty. Cash is not a position; it is a holding pattern.
My watchlist includes Bitcoin, Ethereum, XRP, LINK, Avalanche, and silver. I monitor these assets based on both price movements and news flow. I have orders ready at specific levels. However, placing an or
post-image
Gate_Square
☀️ GM. Buckle up. 🎢
Markets can shift fast. Is your trading plan ready?
📌 Today's topic: What's your safety belt in a volatile market?
🛡️ How are you managing your positions?
👀 What risk signals are you watching?
📝 Any recent trades worth reviewing?
Chasing opportunities matters. Managing risk matters just as much.
Share your strategy or trade recap on Gate Square. Quality posts may get featured and receive extra exposure.
👇 Share your take:
https://www.gate.com/post
repost-content-media
BTC-0.23%
ETH-2.68%
XRP-0.32%
AVAX-4.24%
  • 1
$ETH Last October was also when the black swan arrived—is last year's scenario repeating? Successfully bought the bottom of ETH last night, and with the trend looking so good, added to the position along the way. How is ETH looking today? Meiqi's view is to short on a pullback.
ETH's price action has been too extreme these past few days. Long-term positions are not advisable; only short-term swings should be taken.
Meiqi's strategy is to short at 2500–2480, targeting 2440–2450.
‍#Gate亮相TOKEN2049
ETH-2.73%
#美股AI概念股普跌ALAB跌超9% The anchor of this AI bull market—can it still hold?
Investors holding U.S. tech stocks and the AI hardware supply chain endured another sleepless night. The market was brutal: Intel plunged about 5%, Applied Optoelectronics tumbled 13%, Lumentum fell 5.6%, Micron and SanDisk came close to 5%, and Coherent crashed more than 9%; the Philadelphia Semiconductor Index plunged 3.39% in a single day; Nvidia closed down nearly 3%, wiping out more than RMB 1 trillion in market value.
The blame was once again thrown at OpenAI.
OpenAI is a fake negative catalyst. OpenAI disclosed that
post-image
NVDA-2.86%
$ORCA Current price 2.492, down 14.42% over 24h, with a trading volume of 9.4M USDT, making it the only declining token among the three candidates; however, MA5=2.411 remains below MA20=2.47265, RSI 47.8 is neutral to weak, the MACD histogram at +0.01795 maintains bullish momentum, the price is near the Bollinger middle band within the 2.1652–2.7801 range, the amplitude over 30 candles is approximately 33.11%, and the funding rate of -0.0578% indicates a structure where shorts pay longs. Compared with $RLC
, which rose 38.09%, and $CTSI , which rose 17.71% over the same period, both have MA5
post-image
CTSI+16.03%
$AMP The most unusual point today: 24h rose +22.68%, yet the funding rate failed to match the enthusiasm normally seen from longs, suggesting this move is being driven more by short covering than by new longs actively adding positions. The price is currently 0.000714, holding above MA5 (0.0007088) and MA20 (0.00065895); the MACD histogram at +3.641e-06 remains bullish, RSI at 57.8 has not entered overbought territory, and the Bollinger upper band at 0.000793048 is the first resistance for this move; the amplitude over 30 candles is approximately 42.44%, so the risk of wick-outs is not low, and
post-image
AMP+19.16%
SKL+17.61%
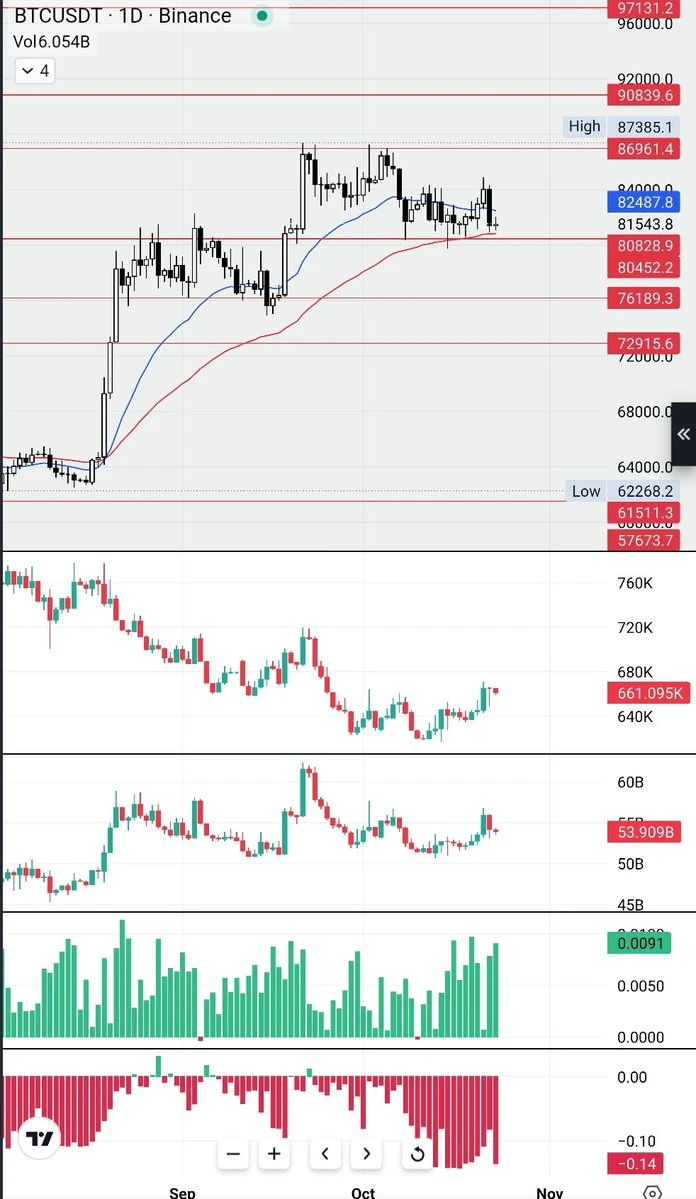
After retreating to the $81,000 level, Bitcoin recovered and settled around $82,000. The daily decline narrowed to 1.54%. However, the market remains focused on the $81,000 mark; this is precisely where buyers and sellers are squaring off.
The $81,000–$81,500 range is an area where buy orders have concentrated in recent days, with buyers increasing their positions there. Analysts identify the $81,119 level as support, while pointing to the $86,500–$86,750 range as resistance. In other words, $81,000 is not an arbitrary level; it is the floor that has held firm in recent weeks.
So, why did it d
post-image
User_any
#BTCPullsBackTo81000 Yo, so check it. Bitcoin slid under $82K for the first time in three weeks, and nah, it ain't one thing that did it. Three things hit at once, straight up.
First off, the Fed. Them September minutes dropped October 7, and all nineteen of 'em backed that quarter-point hike to 3.75–4.00%. Most said yeah, another one by year-end probably makes sense. But here's the thing — the market ain't buying it for October. Odds sitting at like 17% for October, but December? Around 70%. And that matters, 'cause when rates stay high, holding stuff that don't pay you nothing gets expensive. 10-year yield hanging near 5.3%, 30-year near 5.67%. That's decades-high type energy.
Second thing — Iran. Word is the White House told the Pentagon to get strike options ready, but nothing popping off before the midterms. Strait of Hormuz still a mess. Brent at $101.53, WTI at $89.39. Expensive oil means inflation ain't going nowhere, and that keeps the Fed chilling on the sidelines.
Third thing, and this the one that really hurt — leverage. Around $709 to $769 million in positions got liquidated in 24 hours. Longs took $647 to $685 million of that. Bitcoin longs alone, $172 million. Roughly 140,000 accounts got smoked. Open interest dropped 3.27% down to about $52.57 billion. That ain't people changing their minds — that's forced selling, plain and simple.
Institutional money? Mixed bag. US spot Bitcoin ETFs pulled in $118.86 million last session, total assets near $110.68 billion. But Ether ETFs? Lost $202 million same day. Them two ain't moving together no more.
Supply side — government wallets moved 12,267 BTC, 'bout $1.01 billion, to fresh addresses. No exchange deposit, so looks more like reshuffling than dumping.
Chart-wise, Bitcoin ran from $83,299 down to $80,397 before settling near $82,063. The $80,500 to $81,500 zone? That's where last month's highs sat, and that's what everybody watching. Hold there, we cool. Break it, and now we asking if the forced selling is done.
Next real test? October CPI and PPI. That's gonna tell us if inflation really cooling or if this pressure still building.
This ain't investment advice, just keeping it real.
$BTC ‌
BTC-0.23%
  • 4
  • 1
In October, market sentiment toward Ethereum is bearish, with the vast majority of participants believing ETH has momentum to test below 2400.
Breaking below 2400 is the baseline expectation; a further decline to 2300 or 2200 would be an unexpected downside move with a significant odds advantage.
Overall, short-term downside expectations are strong, but the probability of an extreme plunge is limited, with the main strategy focused on trading range-bound bottom-finding.
post-image
ETH-2.68%
Many people rush to buy the dip as soon as they see the price fall 2%, yet never check whether the moving-average alignment is healthy—this is the most common source of losses. Today, using $ETH , I’ll explain a reusable assessment method: moving-average entanglement.
Currently, $ETH ’s price is 2495.71, with MA5=2487.89 and MA20=2488.41 almost completely overlapping, differing by only 0.5 points. This indicates that long and short cost bases are highly overlapped, and that the trend is in a compressed state before choosing a direction rather than a healthy one-way trend. RSI=45.6 is in the ne
post-image
ETH-2.68%
DOT+5.69%
AMP+19.16%
Load More

Join 40 M users in our growing community

⚡️ Join 40 M users in the crypto craze discussion

💬 Engage with your favorite top creators

👍 See what interests you

Trending Topics

GateAtTOKEN2049

35.2k Views20.77k Discussing

Gate brought a series of major events to TOKEN2049 Singapore! From the official launch of Gate Money to the F1 Red Bull driver meet-and-greet and the Gate Gala, we witnessed a new chapter of "One Gate, Borderless Finance." Which moment from TOKEN2049 stood out most to you?

BTC Pulls Back to 81000

25.41k Views35.68k Discussing

AIStocksFallALABDropsOver9%

24.61k Views550 Discussing

View More