Square
Following
Hot
News
Profile
Share your thoughts
placeholder
Article
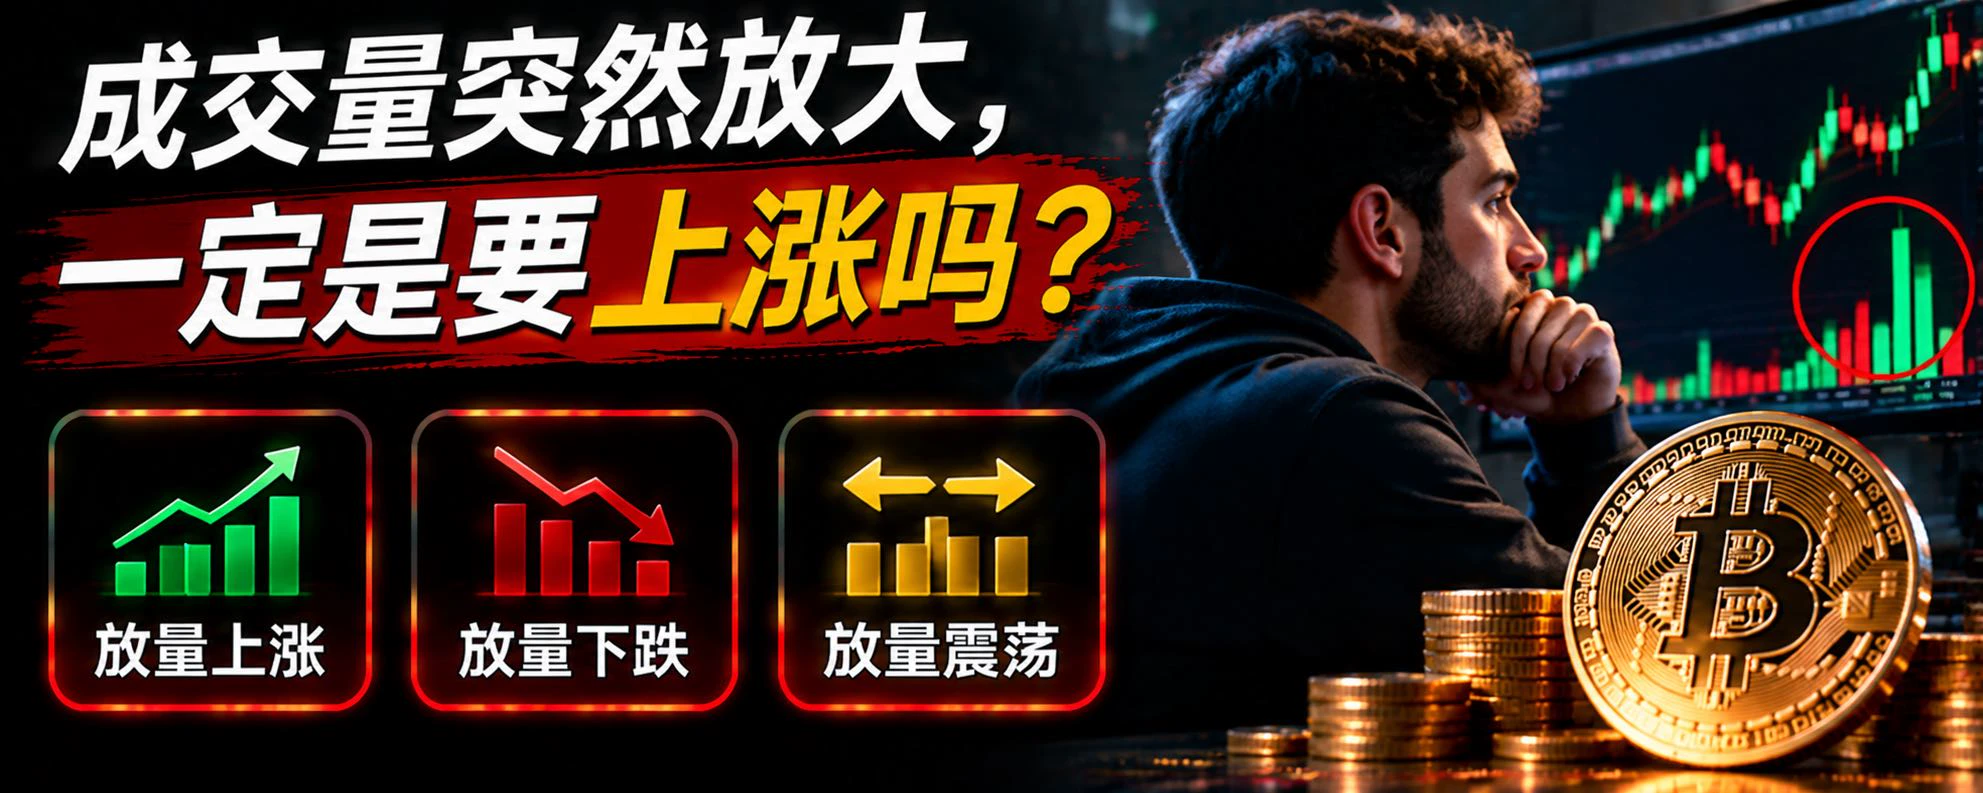
In the crypto market, many traders see BTC trading volume surge and assume the price is about to rise. But sometimes, volume increases significantly while the price fails to rise and instead falls. Why does this happen?
First, understand that trading volume represents market activity, not simply buying pressure. Every trade has both a buyer and a seller, so a surge in volume does not mean the price will necessarily rise.
First, rising prices with increasing volume. If the price continues to rise while volume increases, it means market participation is growing, and buyers may be taking the init
post-image
BTC-0.67%
Closed the position—I’ve reached my take-profit target. In 4 days, 100U has turned into 160x. The rest isn’t mine to earn. After a year of trading, I’ve finally recouped my losses and turned a profit. Trade posted. Wishing everyone continued success on this journey. This year’s rough patch is finally over.
Trenches
ZIG
Z
bade
b
ZIG
0x8c...1145
Market Cap
$.
Change
.
24h Vol
$.
Holders
.
BTC
B
bade
b
BTC
C5xp...pump
Market Cap
$.
Change
.
24h Vol
$.
Holders
HIGH
H
bade
b
HIGH
7ymF...high
Market Cap
$.
Change
.
24h Vol
$.
Holders
.
STONK
S
bade
b
STONK
6GmA...UNgx
Market Cap
$.
Change
.
24h Vol
$.
Holders
.
RAM
R
bade
b
RAM
6QUH...pump
Market Cap
$.
Change
.
24h Vol
$.
Holders
.
11.5 BTC Trading Plan
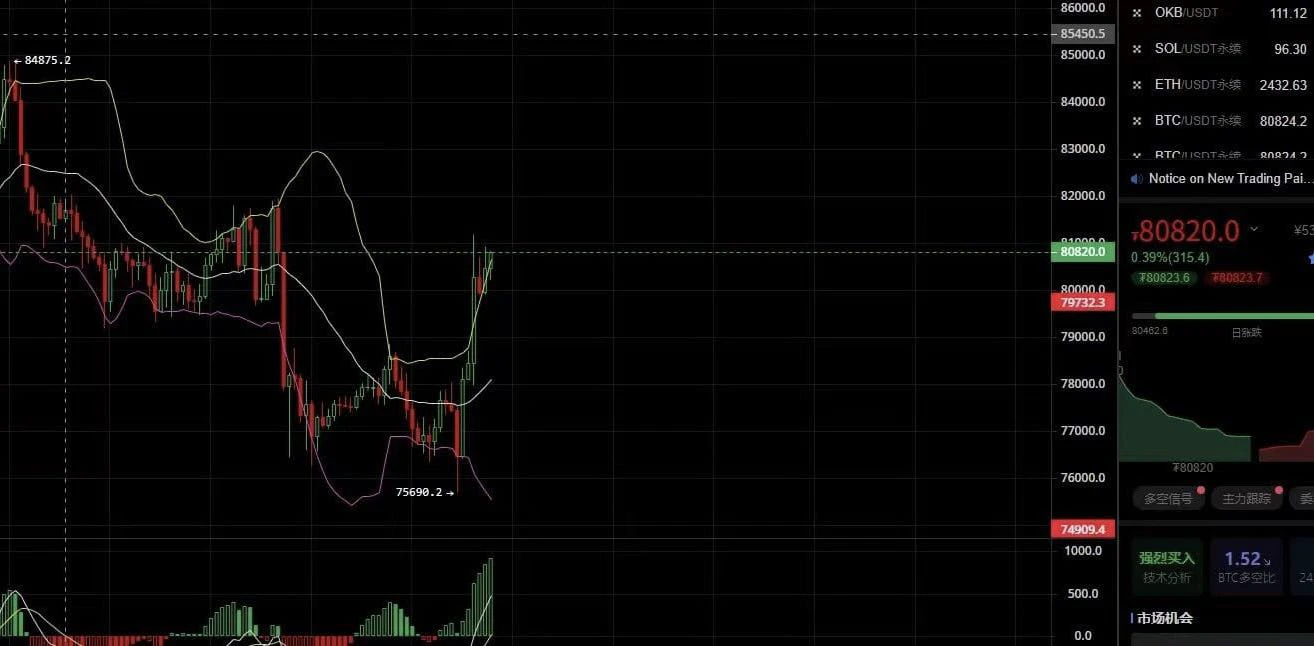
  Market Outlook$BTC
  After a rapid short-term rebound, the price has reached a resistance zone, marking a recovery after being deeply oversold.
  -If it holds above 81000, bulls may get a chance to test the previous high of 84875;
  -If it faces resistance near 81000 and pulls back, it will retest support at 79732. A break below support would end the rebound and resume the downtrend.#BTC重返8万
  Entry Range
  Around 803, consider short-term longs based on this rebound's support, betting on the rebound continuing.
  Stop Loss
  Set the protective stop loss at 79300. A br
post-image
BTC-0.65%
November 5 | What developments should the market watch closely next?
There are several signals in the market worth watching closely right now.
First, watch U.S. employment data closely.
ADP reported 86k new jobs in October, above market expectations. Next, watch the official nonfarm payrolls report due on November 6, with a focus on job growth, the unemployment rate, and wage growth. The stronger employment is, the more likely market expectations for rate cuts are to be held back.
Second, watch ETF flows closely.
For the short-term moves in BTC and ETH, it’s not enough to look at price rebound
post-image
BTC-0.65%
ETH-1.23%
Great, $ELSA has already surged too much, but its upward momentum has weakened. This is exactly the time to short aggressively and welcome the downtrend 😍😍😍$CAP $JCT 😍😍😍
post-image
ELSA+5.80%
CAP+8.34%
JCT-3.26%
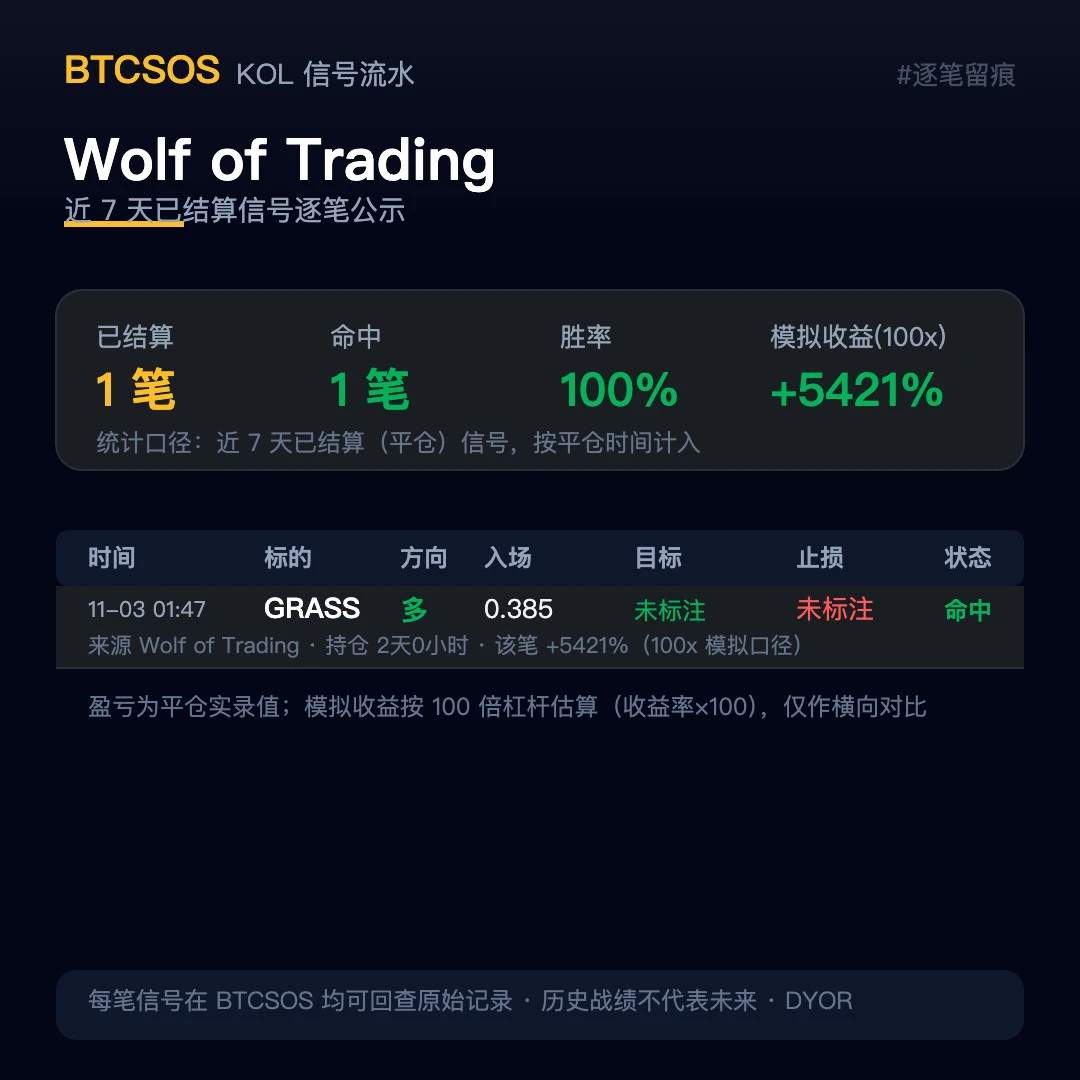
First time digging into Wolf of Trading—logging this for now, and I’ll come back later to check the books 👀
Over the past 7 days, they made just 1 trade: 11-03 $GRASS long, hit, simulated return (at 100x) +5421%
1 win out of 1, 100% win rate, total simulated return +5421%. Their preferred asset is also very focused: $GRASS, with a bullish bias.
Don’t rush to pop the champagne—the sample is just one trade. We’ve seen plenty of win rates like this; blowups and legendary runs both tend to come in clusters. We’re just logging the trades, not making predictions or calling trades.
Original records
post-image
GRASS+1.38%
BNB-0.76%
dogecoin:native

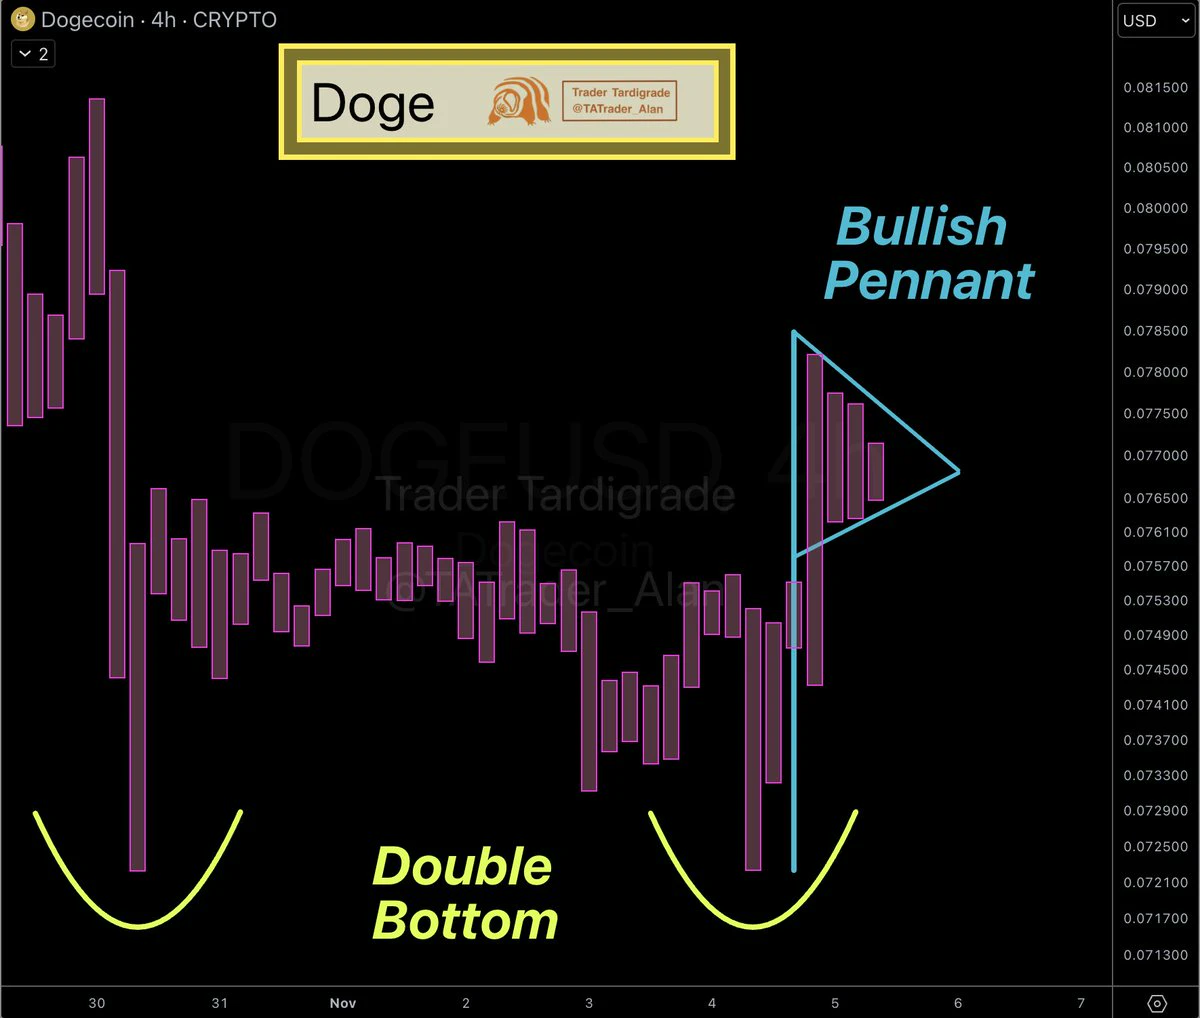
A Bullish Pennant is formed, following a Double Bottom pattern 🔥
post-image
DOGE-0.22%
New streamer bts market
live-cover
LIVE1,744
Bad Boy Watch: SPCX Update 11.05
Big Rocket closed at 135.92 on Wednesday, down 3.81%. It hit an intraday high of 140.50 and a low of 133.14.
Big Rocket briefly fell below 130 in premarket trading amid concerns over the U.S. midterm elections. Let’s see when this unwarranted panic will subside. After all, the whole world is run by a bunch of amateurs.
Let’s take a look at the buy zone around 125 below—that’s where yours truly, Bad Boy, is buying in with real money.
SPCX-3.89%
After the U.S. midterm elections, many Americans be like:
post-image
#DemocratsWinBothChambers
**A Major Political Development: Democrats Winning Both Chambers Could Reshape America's Political Landscape!**
American politics is once again entering an important moment as the headline **#DemocratsWinBothChambers** attracts attention and sparks discussions about the future direction of the country's political system. A Democratic victory in both chambers of a legislature would represent a significant political development, potentially changing the balance of power and influencing important decisions on the economy, government spending, healthcare, immigration, ta
BTC-0.67%
🔹Democrats Sweep Both Chambers of Congress as the Dow Surges Over 3! But AI Stocks Fall Across the
live-cover
LIVE1,928
11.05 BTC Market Analysis
Long: 79900–80300, stop-loss at 79500, targets 81000/81500.
The market saw a classic short-squeeze rally last night, with the price surging from around 75600, breaking through the 80000 mark and reaching a high of 81111. Although this sharp rise was driven by liquidations in derivatives and had considerable strength, short-term indicators need to recover after the sustained rally. There is also profit-taking pressure around 81100, making it risky to chase the price higher.
Structurally, the 79900–80300 area is a key support zone where resistance turns into support aft
post-image
BTC-0.65%
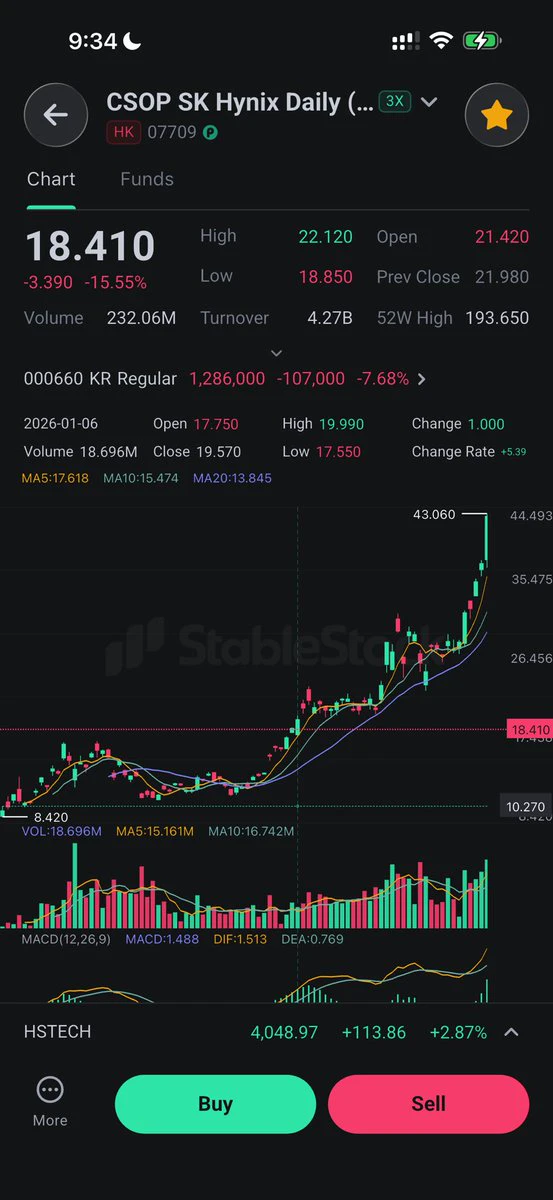
2x skhynix long is 18.41 hkd now, whose price is getting back to the first week in 2026.
post-image
SKHYNIX+1.41%
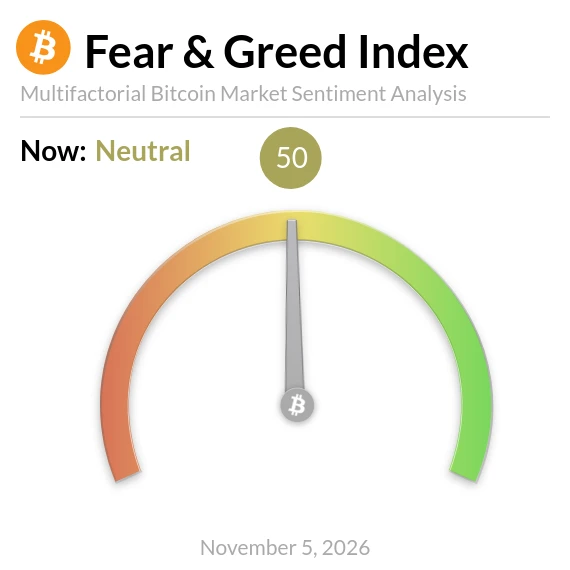
Bitcoin Fear and Greed Index is 50. Neutral
$BTC Current price: $80,477
post-image
BTC-0.67%
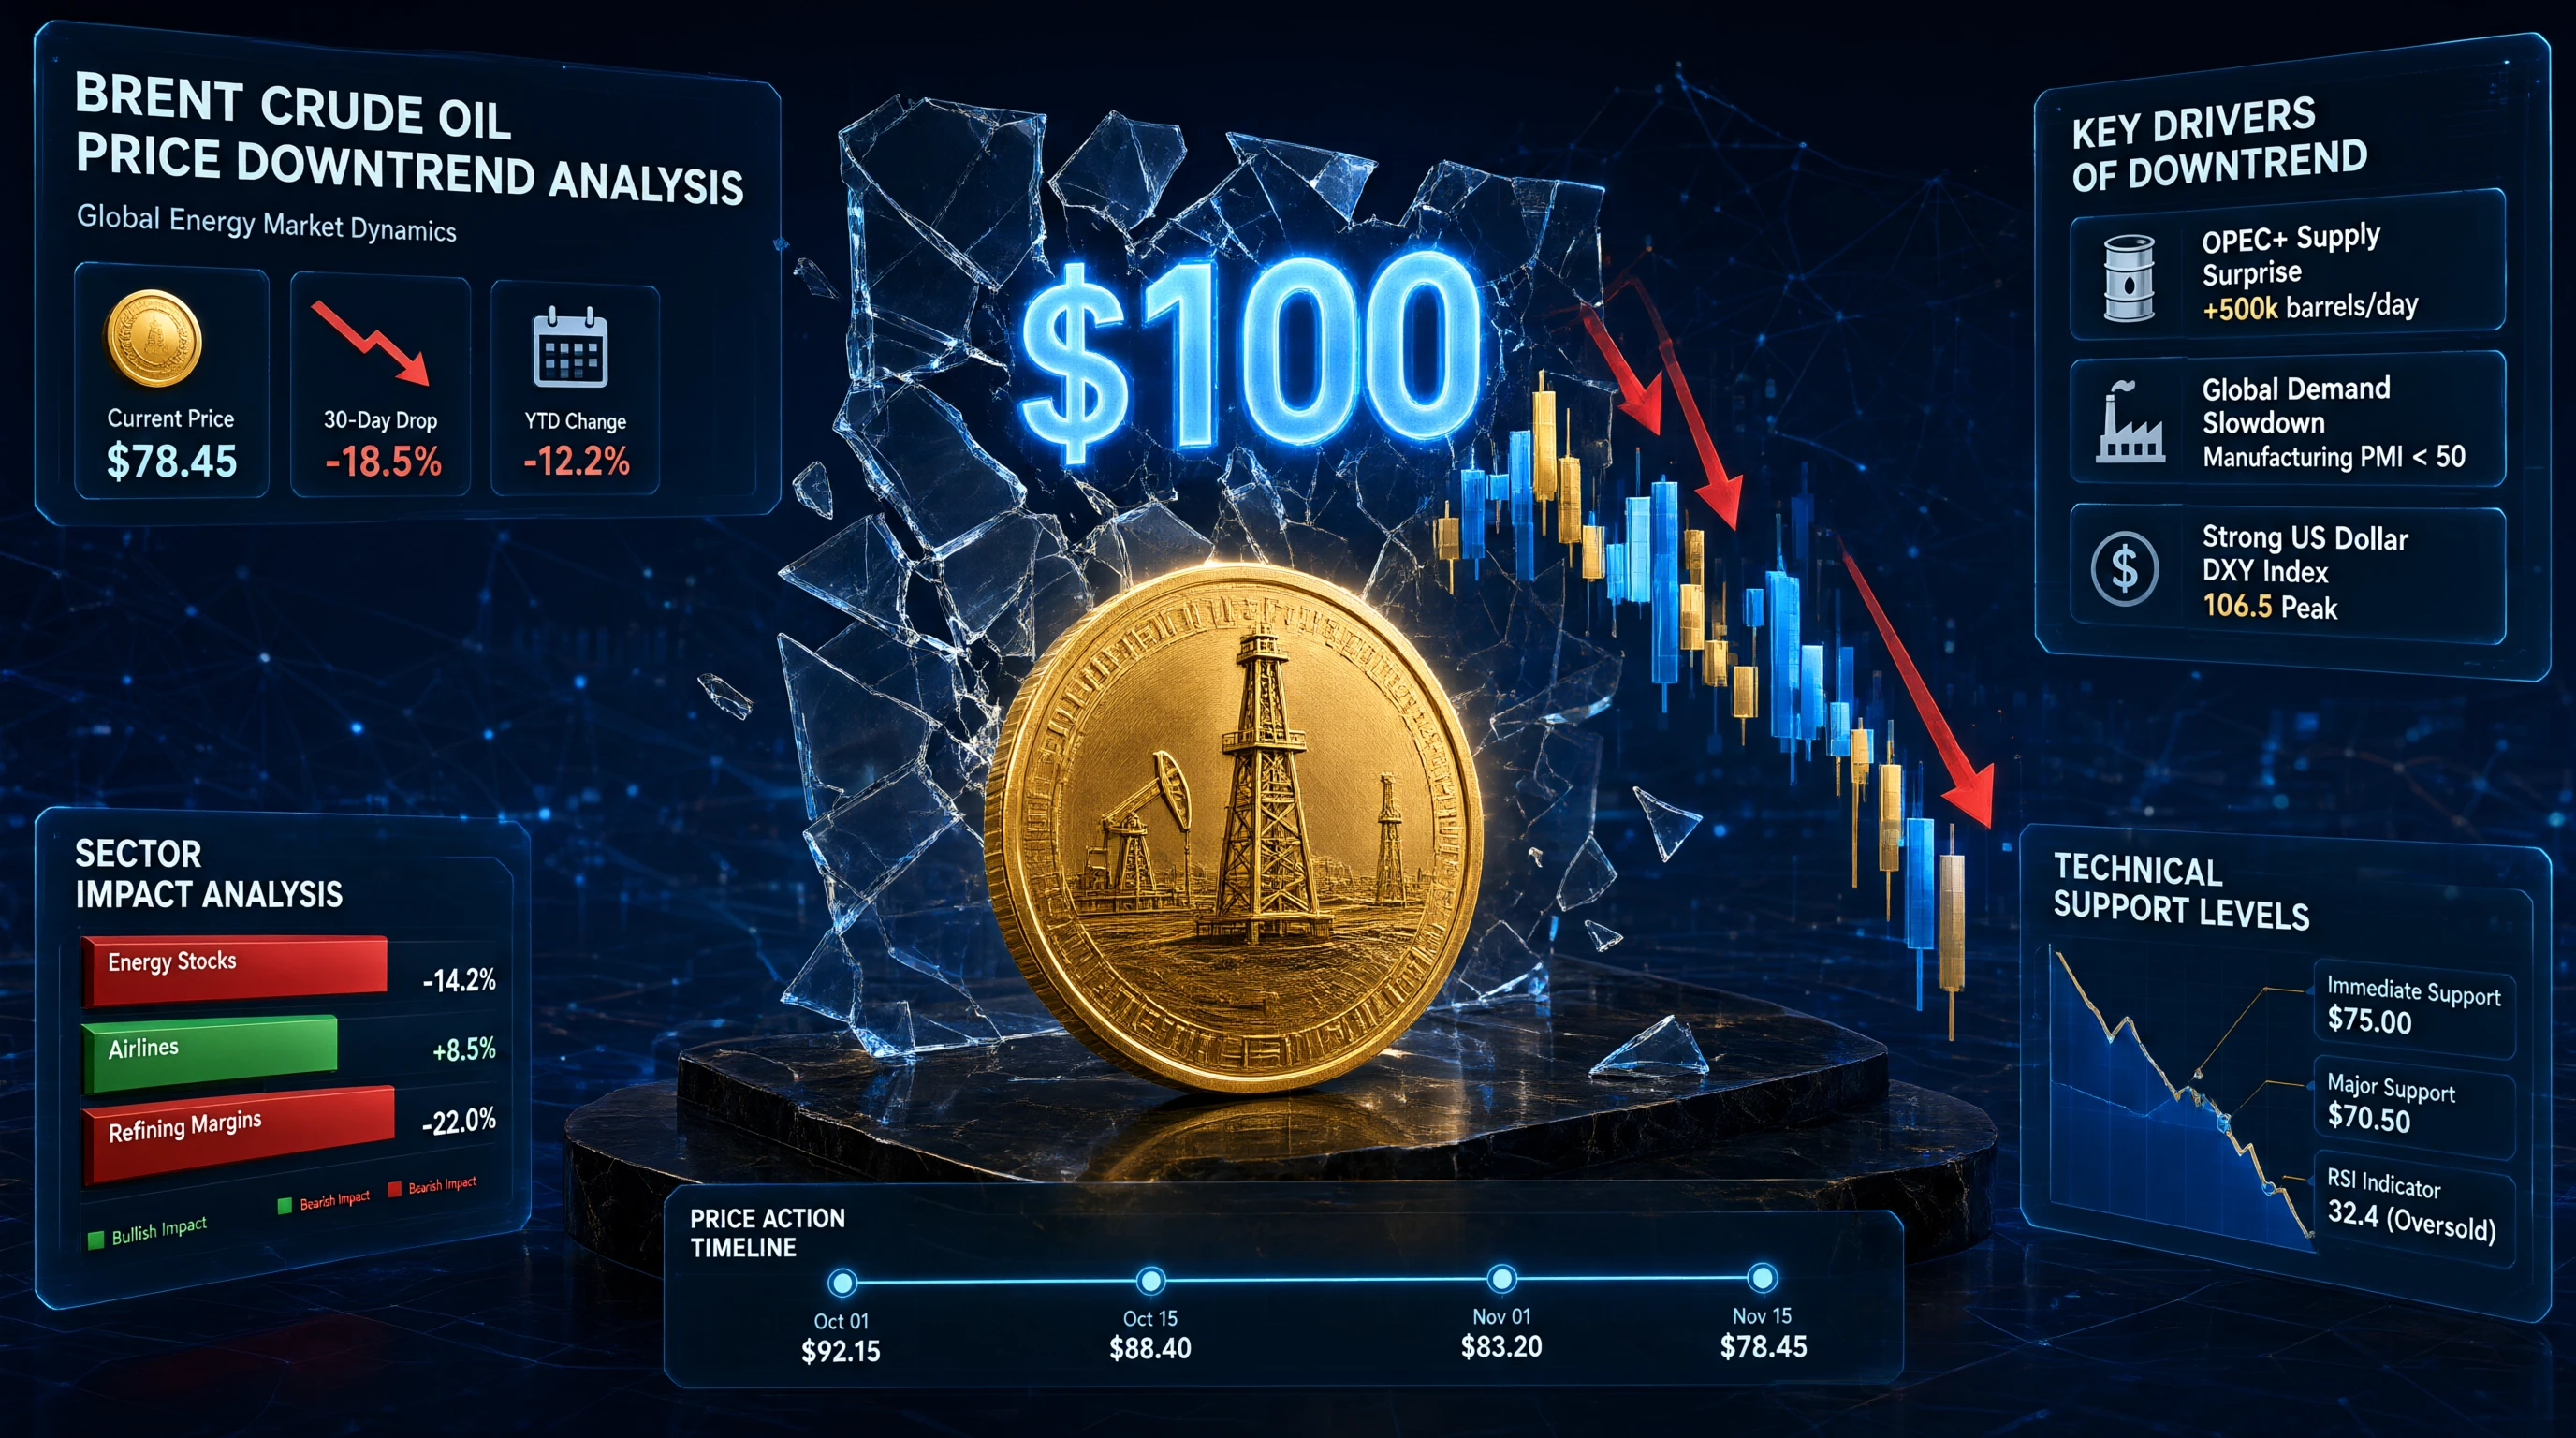
#BrentCrudeFallsBelow100
The sub-$100 Brent crude benchmark is not a temporary dip; it is a structural signal that the global energy market has entered a new equilibrium defined by demand uncertainty and supply resilience.
For over a decade, $100 per barrel served as a psychological and economic ceiling for Brent crude, often triggering inflationary spirals and central bank tightening cycles. The sustained descent below this threshold marks a fundamental shift in macroeconomic dynamics. This is no longer solely a story of geopolitical risk premiums or OPEC+ production cuts; it is a reflection
post-image
11.5 Market Analysis
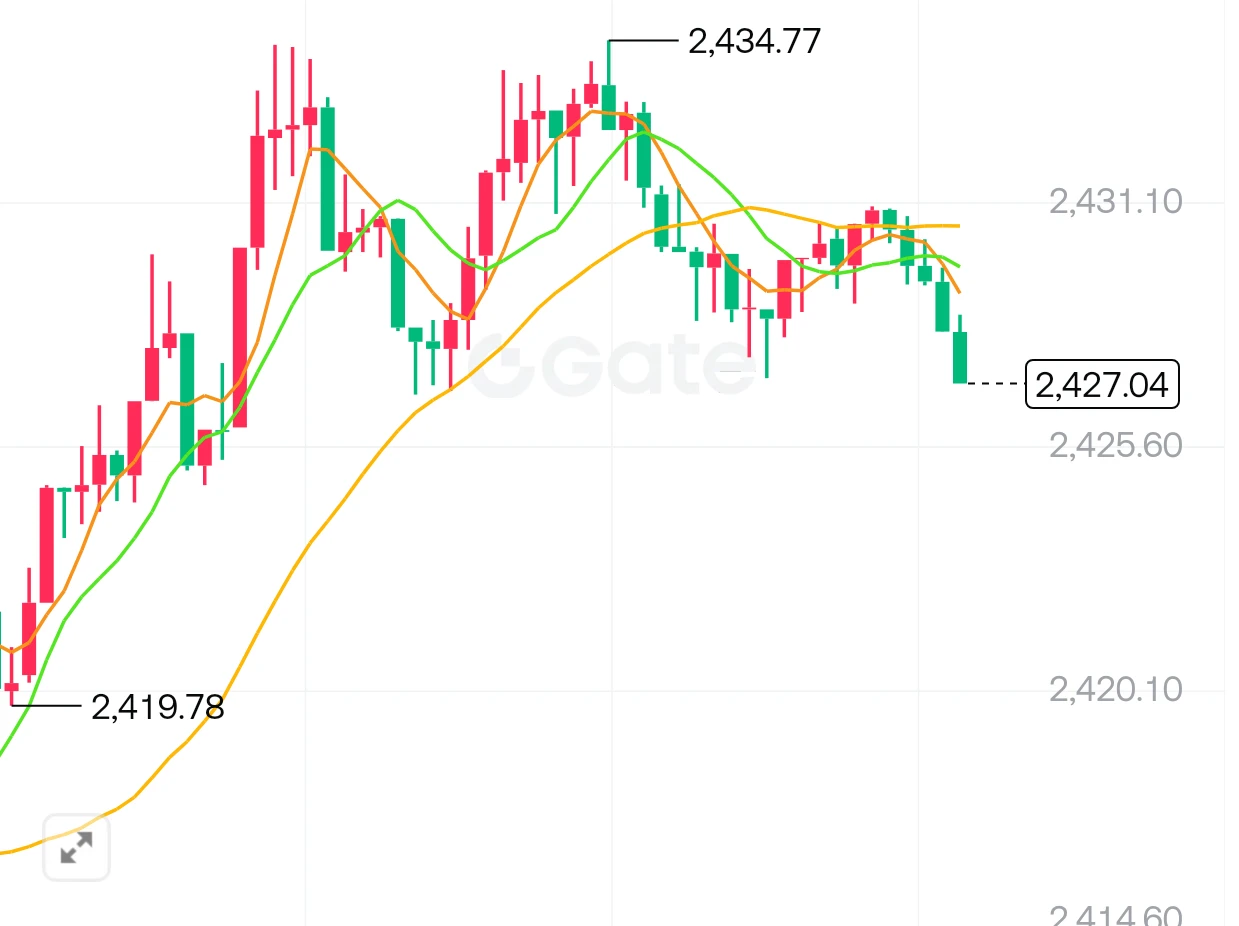
ETH Trading Strategy Reference Setup
Long entry zone: around 2400--2420
Stop loss: 2370
First target: 2450, second target: 2490
ETH has made a strong rally from 2172.85, with the candlesticks holding above the upper Bollinger Band and the MACD red bars continuing to expand, indicating a typical strong bullish trend. BTC has also rallied sharply in tandem, and bullish sentiment is strong. The current price is around 2432, in the pullback confirmation phase after the breakout. Positions can be opened if the pullback holds above the 2420 support; a slight pullback to around 2
post-image
BTC-0.65%
ETH-1.23%
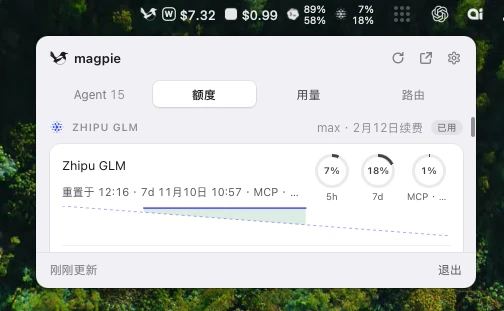
@yetone Today, megpie was updated to the latest version, 0.1.3005. The menu pop-up is shorter, often cutting off the area where I check my quota.
post-image
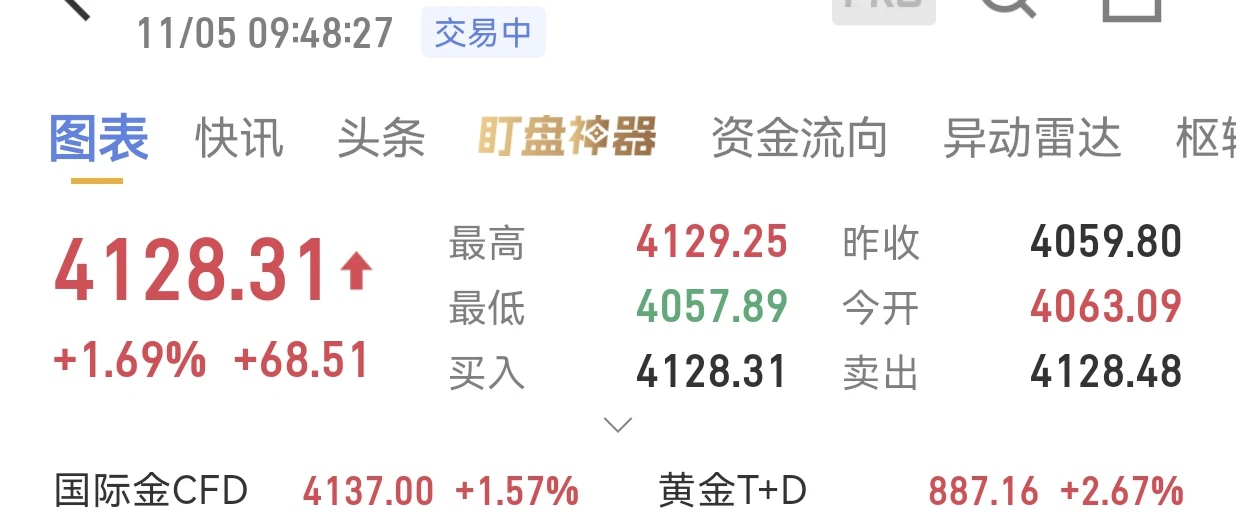
Go long at the current price of 4128, with a stop at 4120 and targets at 4135 and 4145$XAU #BTC重返8万 #黄金
post-image
XAU+0.38%
In crypto futures trading, many people have had this experience: shortly after opening a position, the price moves slightly against them and triggers their stop-loss. Frustratingly, after they close the position, the market starts moving in the direction they originally expected.
Why do stop-losses keep getting hit?
First, the stop-loss is set too close. BTC itself can experience significant short-term volatility. If you place your stop-loss very close to your entry price simply because you're afraid of losing money, normal price fluctuations can easily trigger it.
Second, key support and resi
post-image
BTC-0.65%
Load More

Join 40 M users in our growing community

⚡️ Join 40 M users in the crypto craze discussion

💬 Engage with your favorite top creators

👍 See what interests you

Trending Topics

BTCBackAbove80K

10.46k Views41.06k Discussing

After a sharp dip, Bitcoin climbed back above $80,000 on May 9 and is currently trading around $80,200. Over 50,000 traders were liquidated in the past 24 hours amid fierce long-short battles. The recurring Iran-U.S. tensions remain the primary short-term variable. Following U.S. airstrikes, Iran\'s Revolutionary Guard claimed to have breached the Strait of Hormuz defense line, leaving the ceasefire outlook uncertain. On the technical side, the daily SMA20 ,$77,970 serves as key support, with the RSI recovering from oversold levels to 43. The $80,000 level is both a psychological barrier and a bull-bear dividing line.Holding above it could lead to a challenge at $85,000, while a break may trigger a retest of the $77,000 area.

DemocratsWinBothChambers

15k Views403 Discussing

GateLaunchesTaiwanStockTrading

13.42k Views266 Discussing

View More