Square
Following
Hot
News
Profile
Share your thoughts
placeholder
Article
$ETH is currently at 2,396.89, down 1.15% over 24 hours, with volume at 0.12 times the average over the past 20 candles. Put these figures together, and the key point to explain is that $ETH’s price has already moved, but trading activity and volume have not followed.
One verifiable update: Gate’s official announcement reads, “Gate Research: Corporate Earnings Support U.S. Stocks, KR1 Launches Ethereum Validator Nodes…”. It may explain why people are paying attention, but it cannot answer which way the price will move.
You can tentatively trust the direction, but not assume the move will conti
post-image
ETH-0.93%
October 18 Strategy Plan Priority Ranking, For Followers Only
Current Best Assessment
At the current price of around 2396:
Do not chase longs
Do not chase shorts
Wait for the price to enter a key area
My priority ranking:
Short if rejected at 2403–2418
Go long if it holds near 2380
Go long after a breakout above 2405 and a confirmed retest
If it breaks below 2378 directly, wait for a failed rebound before considering a short
If it holds above 2428 convincingly, cancel the intraday bearish bias
$ETH
post-image
ETH-0.94%
Trenches
AGT
A
bade
b
AGT
0x5d...e274
Market Cap
$.
Change
.
24h Vol
$.
Holders
.
CNPY
C
bade
b
CNPY
0xc6...ddd2
Market Cap
$.
Change
.
24h Vol
$.
Holders
.
Q
Q
bade
b
Q
0xc0...0589
Market Cap
$.
Change
.
24h Vol
$
Holders
.
COVENANT
C
bade
b
COVENANT
0xcd...de79
Market Cap
$.
Change
.
24h Vol
$.
Holders
.
Gato
G
bade
b
Gato
55A3...pump
Market Cap
$.
Change
.
24h Vol
$.
Holders
.
#DOGE DOGE ETF switches from consecutive net inflows to redemptions! Can the $0.08 support hold?
Dogecoin fever cools! ETF funds flee, with $0.08 becoming a crucial line in the sand🐶
Once wildly popular Dogecoin (DOGE) is now facing a subdued market atmosphere. Dogecoin ETFs had previously seen three consecutive weeks of inflows, but the trend completely reversed in October as institutional funds began to pull out, putting considerable pressure on the price.
📉ETF funds see $540k in outflows over two days.
According to SoSoValue data, spot Dogecoin ETF flows were virtually flat from October 1
post-image
ThisIsTranslateContent:
#DOGE DOGE ETFs switch from consecutive net inflows to redemptions! Can the $0.08 support hold?
Dogecoin hype cools! ETF funds flee, with $0.08 becoming a make-or-break line🐶
Dogecoin DOGE, once hugely popular, is now facing a subdued market atmosphere. Dogecoin ETFs had previously seen three consecutive weeks of inflows, but the trend completely reversed in October as institutional funds began to pull out, putting significant pressure on the price.
📉ETF funds see $540,000 in outflows over two days.
According to SoSoValue data, from October 1 to 9, flows in and out of Dogecoin spot ETFs were virtually flat, with no funds entering or leaving. Instead of a turnaround, a wave of redemptions followed. Around $400,000 flowed out on October 12, followed by another $138,600 on the 13th, bringing total outflows to $540,000 in just two days.
Fund net assets also shrank from nearly $17 million at the start of the month to $14.44 million. The retreat of institutional funds is a major headwind DOGE must now face.
📊The price continues to weaken, with bearish technical indicators.
DOGE is down 14% overall this month. It was still holding at $0.095 at the start of the month, but slid steadily after October 7 and is now trading at around $0.0800.
Although it briefly rebounded to a high of $0.088 on the 12th, the recovery was short-lived, and the price quickly fell again, touching a low of $0.08. Technical indicators are also unpromising: the RSI has fallen below its signal line, while the CMF money flow indicator briefly dropped to near -0.90 and has now recovered to -0.30, indicating that the overall trend of capital outflows remains unchanged.
⚖️Futures market sees a tug-of-war between bulls and bears, with bullish positions weakening.
Signals from the derivatives market are mixed. DOGE open interest first surged to $652 million, then fell to $598 million before edging back up to $609 million. The funding rate remains positive at 0.0088%, indicating that the market still retains some long positions, with bulls continuing to pay fees to bears. However, the overall decline in open interest means bullish momentum in the futures market is weakening.
📌Market Summary and Key Points to Watch
$0.08 is a key short-term support level for DOGE. If it breaks decisively below this level, pressure on bulls will intensify sharply, and the price could fall further. The market is currently weak overall, and the rebound lacks strength, so it is unwise to blindly buy the dip. Watch closely to see whether the $0.08 support holds.#WCTCS9
repost-content-media
DOGE-1.99%
EtherFi's borrowing market is the largest app on Optimism, with $300.5M locked, nearly six times Aave V3's $50.35M on the network. Its loans are up 24.81% in the past 30 days to $41.55M.
@ether_fi
OP-6.85%
AAVE-2.26%
MARKET UPDATE
live-cover
LIVE50
$2 won’t make you rich. 72 good trades might.
Start with $2 USDT. Make 20% on a trade and reinvest it:
10 trades → $12
30 trades → $475
50 trades → $18,000
72 trades → $1,000,000+
At 30% per trade, you get there in 51.
Look at trade 30. That’s when $2 stops feeling like a joke and starts looking like a real account.
Nobody posts their $2 day. Everyone waits until the account looks impressive. I’d rather show the beginning.
Every big account was small once. Day 1 was never the problem. Quitting before Day 30 was.
So this is my challenge. $2. One setup. Every trade written down, wins and losses.
post-image
BTC falls 0.62% in 24 hours, with $31.89 million in sell volume in the final hour
Gate spot BTC/USDT is currently quoted at 81285.5 USDT, down 0.62% over 24 hours, with a high of 81818.4 and a low of 80817.0. That 0.62% is almost negligible on the daily chart, but the final hourly candle was different: it opened at 81647.1, plunged to a low of 80817.0, and closed at 81124.9, with 31.89 million USDT in hourly trading volume—more than three times the previous hour’s approximately 8.71 million.
What I’m more interested in is whether this drop was accompanied by volume. Looking at the latest 48 ho
BTC-0.25%
  • 3
$CT I took the full -12.73% hit on this move: entered at 0.385, cut at 0.34, down 11 points. The post-mortem is simple: greed. Before the Fed minutes, I clearly saw $CT 24h volume shrink to just over 20M and large on-chain transfers start flowing out, but I still fantasized that dovish minutes would spark a rally. Instead, the minutes were hawkish, and $CT plunged straight through 0.35, hitting a low of 0.3155. I set my stop at 0.34 and at least stuck to my discipline, but the entry thesis itself was wrong—loading up on a small-cap token ahead of a macro event; correlation is no excuse, I was
CT-14.82%
Online Lending Life with a market cap of 110k—are you sure you don't want to buy?
My friend shorted $AGT , $Q and $BTW today. All three. Same day.
His logic was solid: “It’s already up 65%. It can’t go higher.”
$AGT hit 0.1048 and kept going.
Then he said, “Okay, $Q is up 119%. That’s insane. Now THIS one has to dump.” It printed another green candle while he was typing the order.
By then he was angry, so he went for the third one: “$BTW is only up 34%, there’s still room for a clean short.” The chart made a new high and he made a new lesson.
The funny part is that Q’s funding was negative. Shorts were paying longs to stay in the trade. He literally paid a fee to be wrong
post-image
AGT+40.60%
Q+117.46%
BTW+26.01%
  • 1
#美股存储板块跌幅扩大 #ShareWeekly
U.S. Tech Selloff Deepens: Is the AI Boom Facing a Credit Reality Check?
The latest U.S. technology selloff is revealing a deeper problem than expensive stock valuations. Investors are increasingly questioning whether the enormous investment in artificial intelligence infrastructure can generate enough cash flow to justify its financing costs. This shift makes October’s correction fundamentally different from the July pullback.
1. July vs. October: Two Different Market Risks
In July, concerns centered on rising AI capital expenditure, crowded semiconductor positions,
QQQ-2.50%
SOXX-4.13%
SPX500-0.30%
US500-1.06%
CRWV-11.90%
Something doesn't look right. $AVA is currently at 0.3957, up 34.73% in 24 hours, but look at this candle—the low was 0.2810, the high was 0.4226, a 50% swing, with $72.9M in trading volume. This isn't normal turnover; someone's aggressively sweeping up.
Three possibilities: first, someone positioned early in the derivatives market, with spot buying helping push the price up; second, low-priced holders have finished rotating their positions, and the whales are testing the selling pressure above; third, it's a pure sentiment-driven short squeeze, with 24-hour volume piling above $70M as short-
AVA+30.52%
$GTC Strong rebound from the key FVG area on the 1-hour chart; expected to pull back to the major liquidity zone around $0.255 to $0.260.‼️
Long $GTC Entry: 0.235 - Current price Take profit: 0.257 Stop loss: 0.215 Trade here $GTC 👇
post-image
The Polish prime minister said outright that they’re preparing for war with Russia. Two years ago, that would’ve sounded alarmist. Now nobody’s laughing. As the U.S. shifts its focus, Europe will have to handle Ukraine on its own. If it can’t, Poland’s border will be the next line. The great powers step back, and the frontline countries pay the price. If you think I’m talking nonsense, take a screenshot and save it.
post-image
Good morning, $DOGE fam! 🤝🐕
Gm C X ☕️🌎
Happy weekend! ✌️🌦🍂
Dogecoin to the moon! 🚀🌑
post-image
DOGE-1.99%
AVAX keeps sliding, bears are in control, heading straight for 9.30! Short $AVA .
Entry: 9.727 - 9.776 Take profit: 9.277 - 8.897 Stop loss: 10.069 Note: If the 9.55 support level suddenly rebounds, it could trap people chasing shorts. Don't go all in, buddy. Position size should suit your own account. Watch the downtrend. 👇👇👇 Continue to follow $AV and $BTC .
post-image
BTC-0.25%
$DOGE Current price: 0.07909. The first resistance above is 0.0799, where the Bollinger midline and MA20 converge. Support is at the lower Bollinger Band at 0.0786; a break below opens up room to 0.0780. The chart is in a bearish alignment: MA5 at 0.07937 is below MA20 at 0.07989, the MACD histogram remains negative at -5.47e-05, and RSI at 41.3 is weak but not oversold. The 30-candle range is only 5.17%, indicating a low-volume drift down rather than panic selling.
The real point of contention is the funding rate: at -0.0009%, it is negative, with shorts continuously paying longs, indicating
post-image
ZEC-1.98%
Bitcoin Support and Resistance Levels
live-cover
LIVE128
10.18 Day Trading Strategy: Iran Opens Fire, Tensions Escalate, Institutions Exit, Grid Trading at High Levels
“The crypto fuel theory”: Most people are fuel. The market keeps cultivating your sense of direction, then gets you used to that direction, before one reverse wick ultimately burns through all your U.
The higher the win rate, the greater the losses; the more closely you watch the charts, the more liquidations you suffer. The market goes “against human nature.”
Surviving in crypto is not about watching charts or having a high win rate, but about your profit-to-loss ratio when closing p
ETH-0.94%
The morning sunlight shines on the flower’s center,
making it especially radiant.
May your mood bloom like a flower
🐷🐷🐷🐷
post-image
Load More

Join 40 M users in our growing community

⚡️ Join 40 M users in the crypto craze discussion

💬 Engage with your favorite top creators

👍 See what interests you

Trending Topics

USSeptemberPPIBeatsExpectations

91.35k Views1.93k Discussing

US September PPI came in at 6.3% YoY, well above the 5.3% market expectation, pointing to renewed producer-side inflation pressure. Weekly jobless claims were 199K, broadly in line with forecasts. Could hotter inflation further reduce room for rate cuts, and what does it mean for $BTC, US stocks, and gold?

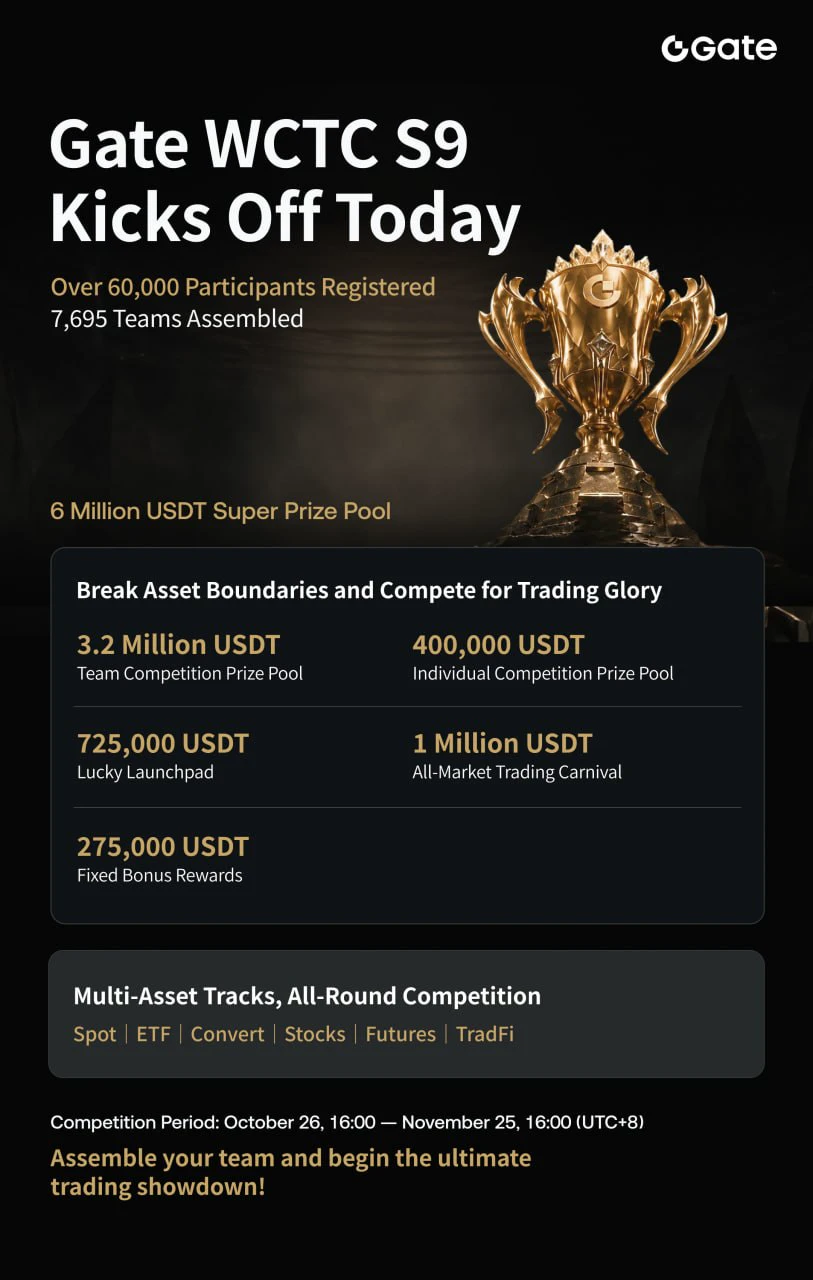
GateWCTCS9GlobalTradingCompetition

37.87k Views6.68k Discussing

GateBTCAndETHFuturesVolumeRanksTop3

53.8k Views1.81k Discussing

View More