Share your thoughts
placeholder
Article
#Gate事件合约晒单挑战 Continue betting that the Fed will not hike rates in September.
Logic and reasons

Current situation: After Warsh's hawkish Jackson Hole speech on August 28, the probability of a September rate hike briefly surged to 65-68%; after Waller publicly questioned the hawkish tone on September 4, it fell back to 50%; today, August nonfarm payrolls came in at 162k, well above expectations of 55k, and the probability of a rate hike rose again to around 57%. So "betting on no hike" is currently a bet against the market direction—the market has tilted slightly toward a hike, but is far fr
post-image
Politics
Fed Decision in September?
25 bps increase
51%1.96x
No change
49%2.04x
$9.61M 24H+3 more
From a “crypto trading tool” to a “global asset allocation platform”
When I registered with Gate last year, I thought it was just a “crypto trading tool.” Buy and sell, cash out if I made money, accept the loss if I didn’t.
But this year is completely different. Gate now supports more than 12,800 stocks and ETFs. I can allocate Bitcoin, U.S. stocks, Japanese stocks, and gold ETFs in one account, and even participate in Pre-IPO offerings. This is no longer just a trading tool—it’s a global asset allocation platform.
My approach has also changed each month: instead of thinking, “Which coin can d
NVDA+0.87%
This move is so obvious, I don’t even need to think—the account is dancing on its own.

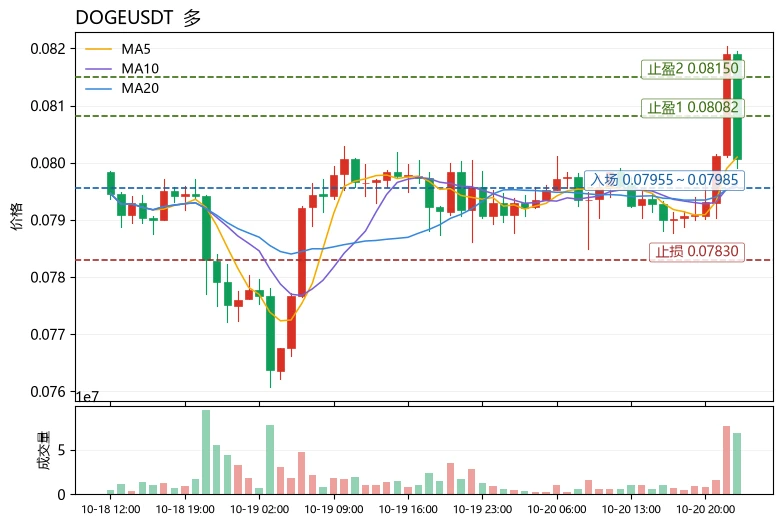
Right after lunch, when I checked the chart, it made another push upward, but the buying strength was clearly insufficient. The candlesticks looked like they were stepping on cotton, bouncing up and softening back down. A rebound without enough support can’t last long. I went short directly around 0.08695. The entry cost wasn’t high, and I had a stop-loss in place; the rest was left to time.

Now at 0.08222, +107.11%. This short-side move paid out cleanly and decisively—feels great.

Close 80% first and
post-image
SNDK+12.51%
BNB-0.35%
hot Topics
live-cover
LIVE621
Everyone’s staring at $MU /USDT’s 1010 level—but the 4h chart just whispered a secret nobody’s decoding yet.

$MU /USDT - SHORT

Trade Plan:
Entry: 1008.85 – 1012.91
SL: 1036.23
TP1: 991.87
TP2: 979.19
TP3: 960.18

Why this setup?
Why now? The 1D trend is *range*, but the 4h bias is SHORT at 77% confidence—that’s institutional patience, not panic.
- RSI 15m at 50.18 = zero momentum cover; price is stalling, not reversing.
- ATR 1h at 8.12 means the current 1010.88 zone is a tight coil—break below 1008.85 triggers a fast slide toward TP1 (991.87) and TP2 (979.19).
- Stop at 1036.23 is
MU+5.27%
$NVDA Nvidia May Reclaim the “Iron Throne”
Share prices of U.S. tech giants are once again nearing record highs—and this time, Nvidia is clearly the player leading the bull-market charge.
After falling behind other surging semiconductor stocks earlier in 2026, Nvidia has recently been reestablishing its position as the “king of the AI trade.”
On Thursday, the first and largest U.S. ETF tracking the “Magnificent Seven”—the Roundhill Magnificent Seven ETF—surged nearly 2.5% to close at $70.43, just below its record closing high of $70.94 set in May this year. The ETF holds equal positions in the
post-image
ThisIsTranslateContent:
$NVDA Nvidia May Reclaim the “Throne”
US tech giants’ stock prices are once again approaching record highs—and this time, Nvidia is clearly the player leading the bull market charge.
After falling conspicuously behind other surging semiconductor stocks earlier in 2026, Nvidia has recently begun reasserting its position as the “king of the AI trade.”
On Thursday, the first and largest US-listed ETF tracking the “Magnificent Seven”—the Roundhill Magnificent Seven ETF—surged nearly 2.5% to close at $70.43, approaching its record closing high of $70.94 set in May this year. The ETF holds equal-weight positions in the seven tech giants—Microsoft, Apple, Nvidia, Alphabet, Amazon, Meta, and Tesla—and rebalances quarterly.
In recent months, the “Magnificent Seven” stocks have shown clear divergence. Of the seven constituents, Nvidia and Apple are closest to their record highs, with both less than 3% below their all-time highs. Meanwhile, Alphabet, Meta, and Tesla have fallen by double digits from their record highs.
Nvidia’s stock has recently gained strong momentum, boosted by its robust earnings report last week. In its latest earnings report, the company said it expected revenue for the fiscal year ending January 2028 to grow by more than 70%.
Joe Tigay, portfolio manager at Equity Armor Investments, wrote in a report last week that the earnings results showed “the buildout of AI infrastructure remains endless.”
Overnight, Nvidia received its latest piece of good news with the announcement that it would acquire Hugging Face, a popular open-source AI developer platform. In a report on Thursday, Forrester Vice President and Principal Analyst Jeff Pollard said the deal would help the chip giant gain greater control and visibility over the open-source software layer, thereby deepening Nvidia’s AI ecosystem.
Nvidia returns to the spotlight Nvidia’s market leadership once again marks a reversal in the industry landscape from earlier this year. At that time, as semiconductor stocks such as Micron Technology and Advanced Micro Devices (AMD) drove the iShares Semiconductor ETF to a record high, Nvidia was left far behind. Some analysts speculated that Nvidia had become too large, and investors were seeking differentiated semiconductor plays.
Data shows that although the iShares PHLX Semiconductor ETF (SOXX) has risen 67% year to date, the semiconductor sector as a whole has recently significantly underperformed Nvidia as investors recalibrated their expectations for some fast-growing chip stocks. Over the past three months, Nvidia’s stock has risen 7%, while SOXX has fallen 18%.
Despite shifts in market sentiment and competition from rivals, Nvidia has once again demonstrated its irreplaceability in the AI wave through strong earnings expectations and strategic reinforcement of the open-source ecosystem. As hardware infrastructure buildout continues and the software ecosystem matures, whether Nvidia can lead the “Magnificent Seven” to new highs will become a key indicator of the direction of US tech stocks. $NVDA
repost-content-media
NVDA+0.87%
MSFT-2.03%
AAPL-2.51%
AMZN-0.15%
META+0.99%
  • 1
I originally wanted to cut my losses and sacrifice them to the heavens, but the ceremony never happened—the meat roasted itself. 🔥 While everyone else was running, I took one more look at the order book.
At the time, the screen was full of panic, but the bottom held steady, funds were quietly entering, and the volume-price action wasn’t bad. I judged it to be a fake breakdown, so I opened a long position around 225.0 without hesitating for too long. The market has now reached 227.5, with a +49.26% return—nailed it.
The early phase was genuinely sluggish, but the breakout feels great. When you
post-image
SNDK+12.51%
XRP-3.32%
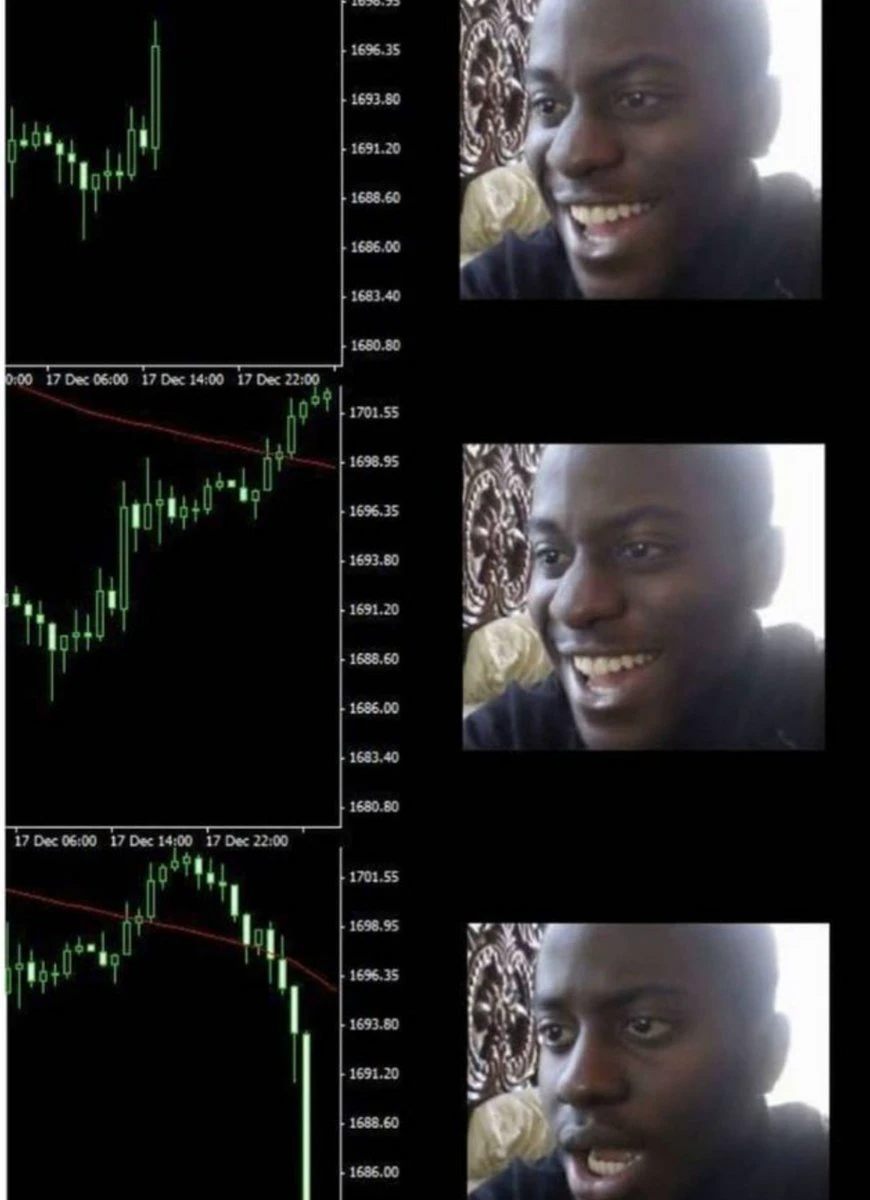
Reminder your financial advisor is less qualified to give you investment advice than a chimpanzee
post-image
#Gate60MillionUsers
My first Gate trade still makes me laugh 😂
I remember staring at the chart like I had everything figured out. I saw a move, got excited, and entered without giving much thought to risk.
For a few minutes, everything looked perfect.
Then the market moved against me.
I kept staring at the screen thinking, “It’ll come back.”
Spoiler: it didn’t. 😂
That tiny trade taught me something I still remember today: the market doesn’t care how confident you feel.
Looking back, losing that trade wasn’t the worst part. The funny part was how seriously I thought I knew what I was doing.
$SNDK 24-hour trading volume reached $30.38 million, yet the price rose only 11.48%. How many times have you seen this volume-price divergence? I’ve been watching the market for ten years, and the last time these figures appeared was on the eve of SOL’s launch.
Current market sentiment indicators: the Fear and Greed Index is 72 (greed zone), and the funding rate is 0.05%, bullish but not overheated. Historical comparison: SNDK inevitably retraced when the funding rate broke above 0.08%; there is still room before the current warning line.
Note: 1745 is major resistance from the previous high;
SNDK+12.51%
SOL-1.66%
ORDI-3.35%
GRASS token on Robinhood Chain spiked to a new all-time cap before pulling back, reports show a 111% 24h surge with $8.7m in volume. This meme-stock play highlights crowd-driven liquidity shifts and potential short-term momentum for niche meta-coins. $GRASS
post-image
GRASS-1.50%
If I were a fish, I would be enamored with the ocean; if I were a bird, I would be enamored with the sky. But I am a person in this mortal world, and I am enamored only with you!
BREAKING: Uniswap V4 just posted its biggest fee day ever.
$12.3M in fees in the last 24 hours. 30-day fees $87.3M, up 147.6% on the prior month.
@Uniswap
UNI-2.55%
#美国8月非农超预期 Nonfarm Payrolls “blowout” triggers a sell-off! Bitcoin’s $79500 life-or-death battle: a bottom-fishing opportunity or a continuation of the decline?
I. Last Night’s Review: The Bloodbath Triggered by “Better-Than-Expected” Nonfarm Payrolls
First, we need to understand why the market fell last night.
Previously, the market generally expected the US to add only around 50,000-60,000 jobs in August. Everyone thought the US economy was weakening and that the Federal Reserve would definitely need to cut rates sharply in September to rescue the market. But what happened? The data released
BTC-1.43%
  • 3
$XAUT Monday Shi Pan Summary
10 trades were placed intraday, with 7 wins and 3 losses, yielding 54 points of room

The market fluctuates constantly, but not every move needs to be traded.
Learning to filter opportunities, knowing when to make trade-offs, and maintaining discipline are the keys to standing firm in the market for the long term! ​​​
post-image
XAUT-0.93%
$ETH — Buyers Are Back 👀🔥
ETH is holding the $2.45K area and this is the level I’m watching right now.
I don’t want to chase the move. If ETH gives a small pullback and buyers defend support, I like the long setup.
🟢 Entry: $2,470 – $2,500
🛑 SL: $2,440
🎯 TP1: $2,525
🎯 TP2: $2,560
🎯 TP3: $2,600
The first target is close because I want to see how price reacts around $2,525.
If ETH breaks $2,525 with volume, the next move toward $2,560–$2,600 could come quickly.
But if $2,440 breaks, I’m out. No forcing the trade.
$2.45K hold = buyers still have the advantage.
$2.56K breakout = momentum g
post-image
ETH-2.06%
  • 4
#BTCReclaims80K 🚀 BTC Reclaims $80K — Is Bitcoin Ready for Its Next Big Move?
Bitcoin has once again reclaimed the important $80,000 level, bringing fresh optimism back to the crypto market. After recent volatility and selling pressure, BTC’s recovery above this psychological level suggests that buyers are stepping back into the market.
📈Why is $80K important?
The $80K level is more than just a round number. It represents an important psychological and technical zone for Bitcoin. If BTC can hold above $80K and turn this level into strong support, bullish momentum could continue to build.
Wh
BTC-1.43%
$DASH Signal】1H breaks above the upper Bollinger Band, bullish momentum continues
$DASH RSI 1H 81.36, with the price at 64.26 breaking above the upper Bollinger Band at 62.88. MACD momentum is expanding across both timeframes, with the 4H histogram at 1.84. Bid depth dominates the order book, with a Bid/Ask ratio of 1.73, and the funding rate at 0.01% shows no signs of overheating. OI is stable, with no signs of short-side resistance.
🎯Direction: Long
⚡Entry/limit order: 64.0672 - 64.2600
🛑Stop-loss: 63.6174
🚀Target 1: 65.2239
🚀Target 2: 65.7059
🛡️Trade management:
- Execution strategy:
post-image
DASH+38.14%
Load More

Join 40 M users in our growing community

⚡️ Join 40 M users in the crypto craze discussion

💬 Engage with your favorite top creators

👍 See what interests you

View More