Share your thoughts
placeholder
Article
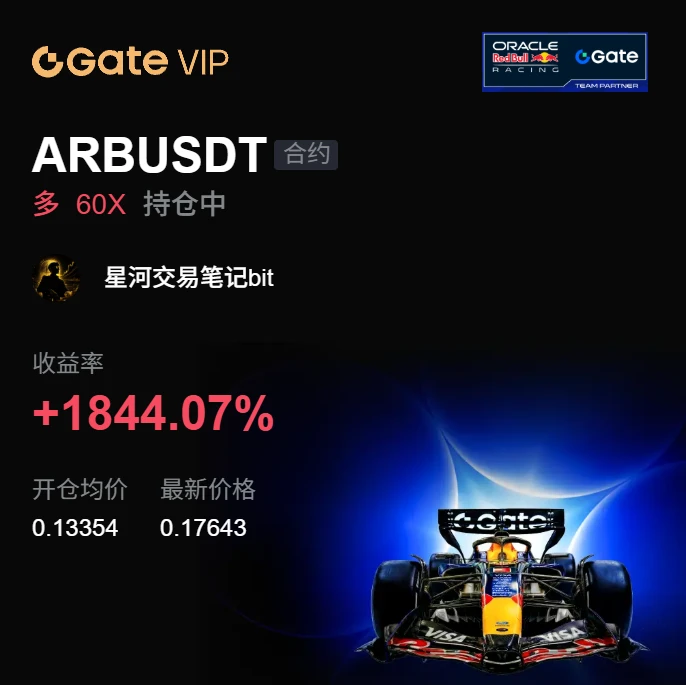
After $ARB surged to 0.17653, I instead took 70% off the table first. It’s not that I’m bearish, but this level is right at the key prior-high resistance, making it less cost-effective to keep chasing. The move up from 0.13354 formed a breakout-pullback-breakout structure, with each pullback holding at a higher key level and volume expanding on the breakouts.

The key levels are clear now: the prior high is the first key level. After the breakout, only a low-volume pullback that holds the upper boundary would establish a new entry setup; if it merely pushes above and then falls back, it could
post-image
ARB+5.51%
DOGE+0.97%
ETH+0.89%
Layout for Bitcoin, Ethereum, and Dogecoin
live-cover
LIVE1,622
Watching the market nonstop got annoying, but once I turned it off, I could see things more clearly. With my eyes no longer glued to it, I stopped feeling anxious.

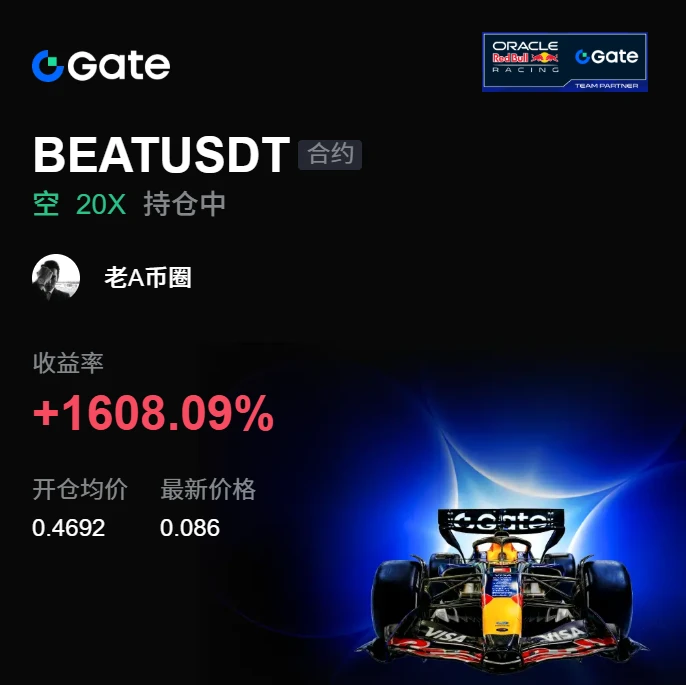
While the market was bottoming out, $BEAT ’s rebound remained weak, and volume failed to follow. Nobody was taking it higher, so I flagged a BEAT short setup around 0.4692. I didn’t call it too aggressively—those who understood would naturally get it.

It weakened directly afterward, and 0.0858, +1608.09% was secured. That was a satisfying bite of profit; the wait beforehand was worth it.

Take 80% off first, and protect the rem
post-image
BEAT+5.40%
XRP-0.40%
LAB+1.90%
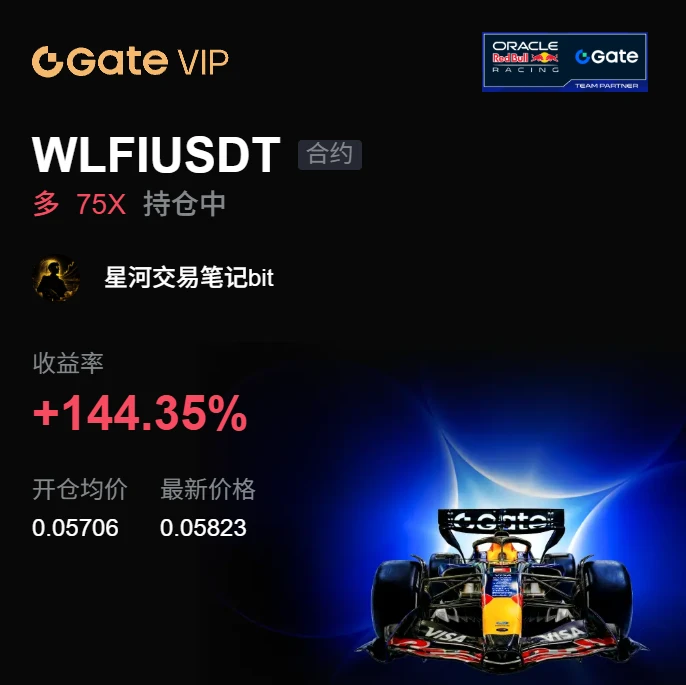
After $WLFI surged to 0.05824, I instead took 70% off first. It’s not that I’m bearish, but this level is right around the key prior high, so chasing further offers worse risk-reward. The move up from 0.05706 formed a breakout-pullback-breakout structure, with each pullback holding at a higher key level and volume expanding on the breakouts.
The key levels are clear now: the prior high is the first key level. After the breakout, a low-volume pullback that holds the upper boundary would provide a new entry setup; if price merely pushes above it and then falls back, it could be a false breakout.
post-image
WLFI-0.15%
ZEC+8.95%
SNDK+4.88%
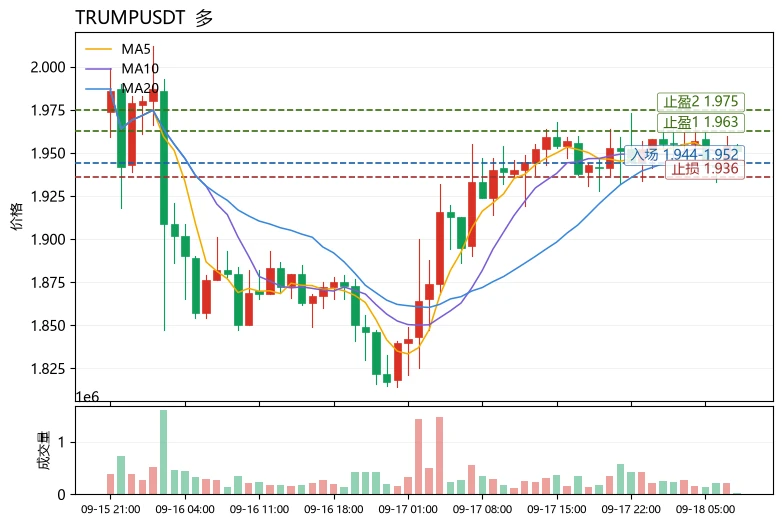
Many people automatically assume that tangled moving averages mean “no opportunities in a sideways market,” so they take a heavy directional position prematurely, only to repeatedly get stopped out by the upper and lower Bollinger Bands. The real signal lies not in the moving averages themselves, but in the first expansion after their compression.
$TRUM The current price is 1.951, with MA5=1.9494 slightly below MA20=1.95075. The moving averages are nearly converged, indicating a typical eve of a directional choice. The MACD histogram is -0.002362; bearish momentum has not yet reached zero, bu
post-image
ZEC+9.06%
In the latter half of the night, the market continued to edge lower amid choppy trading. Yesterday’s updates repeatedly warned that the market lacked a trend and would remain range-bound. Subscription short positions are currently profitable! #Gate股票永续合约覆盖数量行业第一
post-image
  • 3
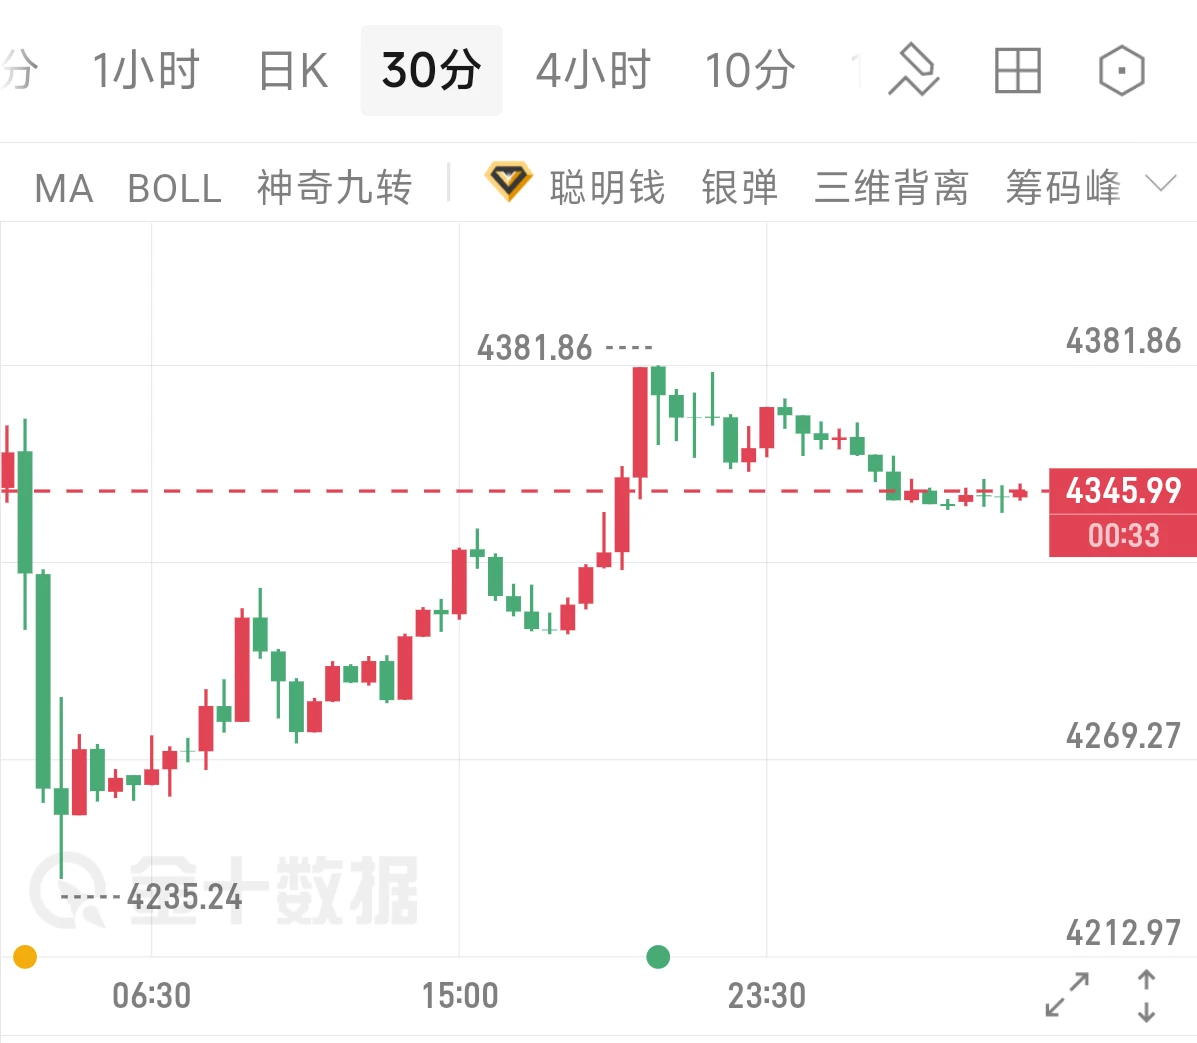
9.18 Gold Morning Analysis: Gold Surges Over 140 Points Before Consolidating at Highs! Rejected at 4380 and Retreats—Is the Bullish Trend Over?

On the 30-minute chart, spot gold dipped to the intraday low of 4235 during the morning session before launching a strong rebound. The bulls continued to push prices higher in a one-way rally, with the evening high reaching 4381, after which gold was rejected and retreated into high-level sideways consolidation. It is currently quoted at 4345, fluctuating narrowly between 4340 and 4350 in the short term, as bulls and bears engage in a tug-of-war at e
post-image
XAUT+1.56%
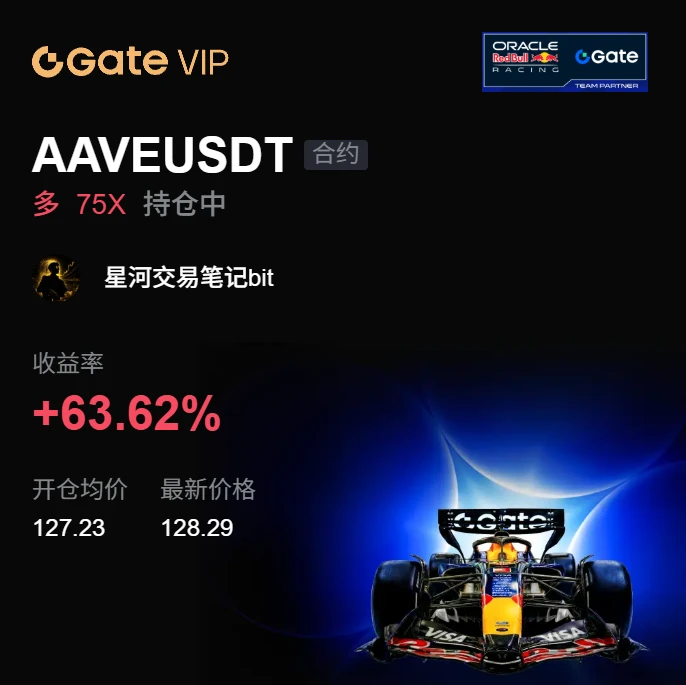
After $AAVE surged to 128.33, I instead took 70% profit off the table first. It’s not that I’m bearish, but this level is right at the key prior high, making it less cost-effective to keep chasing. The move up from 127.23 formed a breakout-pullback-breakout structure, with each pullback holding at a higher key level and volume expanding on the breakouts.

The key levels are clear now: the prior high is the first key level. After the breakout, only a low-volume pullback that holds the upper boundary would create a new entry setup; if it merely pushes up and then falls back, it could be a false
post-image
AAVE+6.95%
ETH+0.89%
LAB+1.90%
$FB Looks like it will definitely drop to 0.3 today
post-image
FB-4.02%
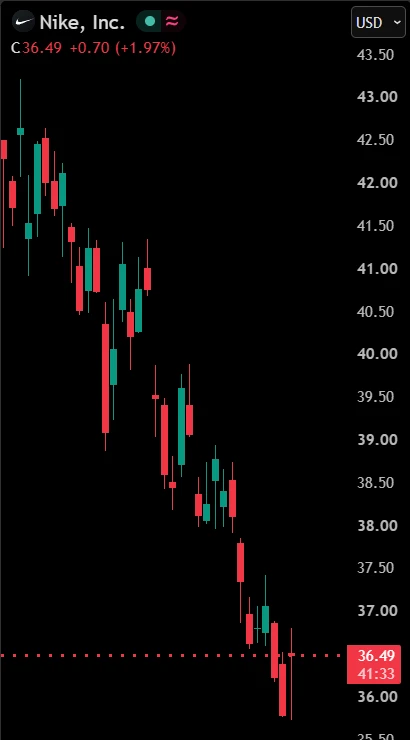
🩸 Nike’s turnaround story is facing another serious test.
$NKE recently traded near $36, around its 52-week low and roughly 12-year lows.
Then came another warning from Wall Street:
Robert W. Baird downgraded Nike from Outperform to Neutral and cut its price target from $70 to $44.
Nike is also set to leave the S&P 100 on September 21, ending an almost 18-year run in the index.
But there’s an important distinction:
Nike is leaving the S&P 100 — not the S&P 500.
The stock will remain in the broader S&P 500.
The bigger issue is what happens next.
Nike’s market value has fallen sharply over the
post-image
NKE+0.91%
  • 1
📈 Bitcoin Road to $90,000 May Include One More Major Higher Low
Bitcoin’s Current Range Mirrors a Key 2023 Structure as $70K–$90K Levels Come Into Focus.
Bitcoin’s long-term chart shows a recurring sequence of rally, consolidation, downside liquidity sweep, and renewed expansion. The current structure is developing between roughly $60,000 and $84,000, following the decline from the chart’s major high near $124,000–$126,000.
The chart also highlights a 2023 structure as a historical comparison. The price levels and sequence are similar in form, although the present structure is occurring at su
post-image
BTC+0.10%
This round only keeps 4 strong signals: NEAR, COTI, and PONS, 3 longs and 1 short. First watch volume and structure move. Last round: 4 wins and 1 loss, +25.7%; NATGAS, DASH, and GENIUS are all in the red. The 14 current positions are averaging +1.8%; wait for confirmation.
Last round’s returns: NATGAS entry $3.0480 → exit $3.0250, 5.0x for +3.8%; DASH entry $5.8000 → exit $60.7200, 5.0x for +10.2%; GENIUS entry 0.3561 → exit 0.3845, 5.0x for +25.6%
━━━ Market View ━━━BTC 76,371 +0.2%, with bullish signals slightly prevailing; negative funding rate data is temporarily unavailable, and capital
post-image
COTI+48.57%
PONS+19.09%
DASH+7.56%
GENIUS+17.23%
BTC+0.10%
The market doesn’t explain itself; it just moves. Your job is simply not to make reckless moves.
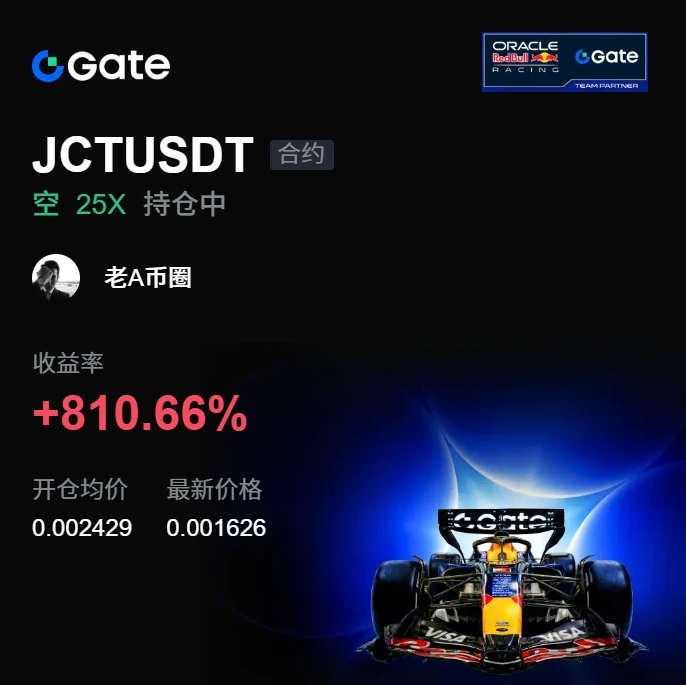
When I checked the market right after lunch, $JCT faced strong selling pressure and low trading volume, so any rebound was an opportunity to short. I flagged a JCT short around 0.002429, then went back to work.
Now at 0.001621, +810.66% has been realized directly. Feels great, brothers—we didn’t endure this wave for nothing.
Close 80% first, and protect the remaining 20% at the entry price. Don’t get greedy for the last bit; if the sell-off continues, let the profits run, and don’t give them back
post-image
JCT+6.54%
SOL+2.52%
DOGE+0.97%
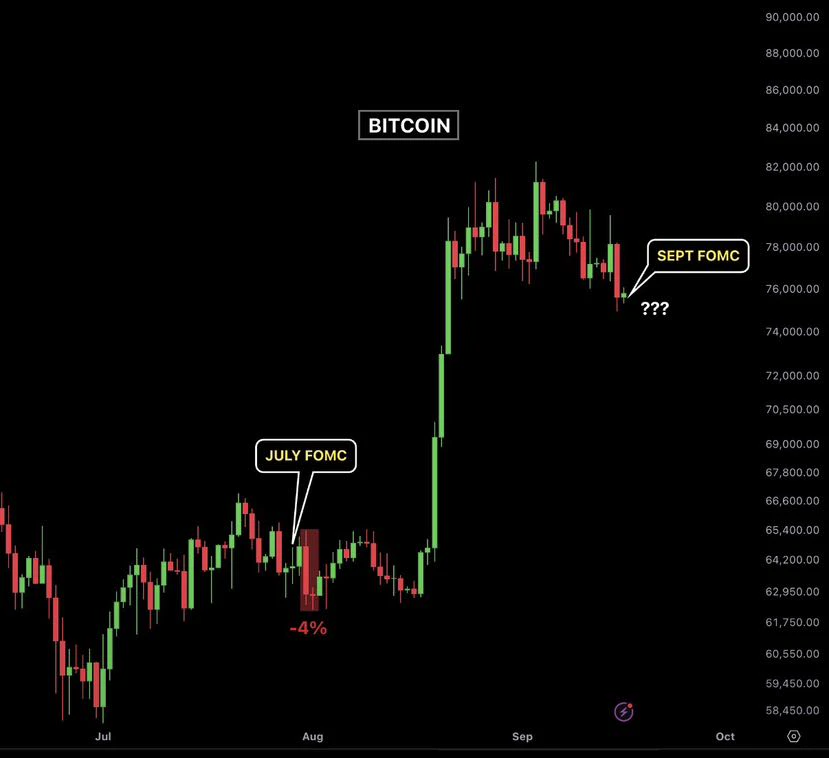
Last time the Fed held rates, BTC still dumped 4%.
Today, The market is preparing for a 25 bps hike
And somehow BTC is still fighting around $75K after yesterday’s CLARITY shock
This is either insane strength
or the calm before the FOMC volatility
post-image
BTC+0.10%
  • 2
🚨 DOES LEOPOLD KNOW SOMETHING WE DON’T?
Leopold Aschenbrenner reportedly added to his $CRWV position last quarter, reaching 7.48M shares worth ~$744.5M at filing — and reports say he later bought CALL OPTIONS on CoreWeave too.
Meanwhile, $CRWV is now 47% below its 52-week high.
Yet he keeps increasing his exposure.
Does he know something? 👀
CRWV-4.17%
$3,700 Rolled Into $1.1 Million: He Wasn’t Reading Switches, but a Continuous Probability Field
Over the same period, SPY roughly doubled.
Where did the gap come from? Not from some “on/off” signal, but from reading the market as a continuous probability field.
Most quantitative strategies compress market conditions into a binary choice: momentum or mean reversion.
But once you ask “which one is it now,” the answer has already been forced into a bucket. The problem often lies in the measurement itself.
Markets do not switch like toggles.
They are more like superimposed layers: some trend, some
(New streamer) Market prediction
live-cover
LIVE303
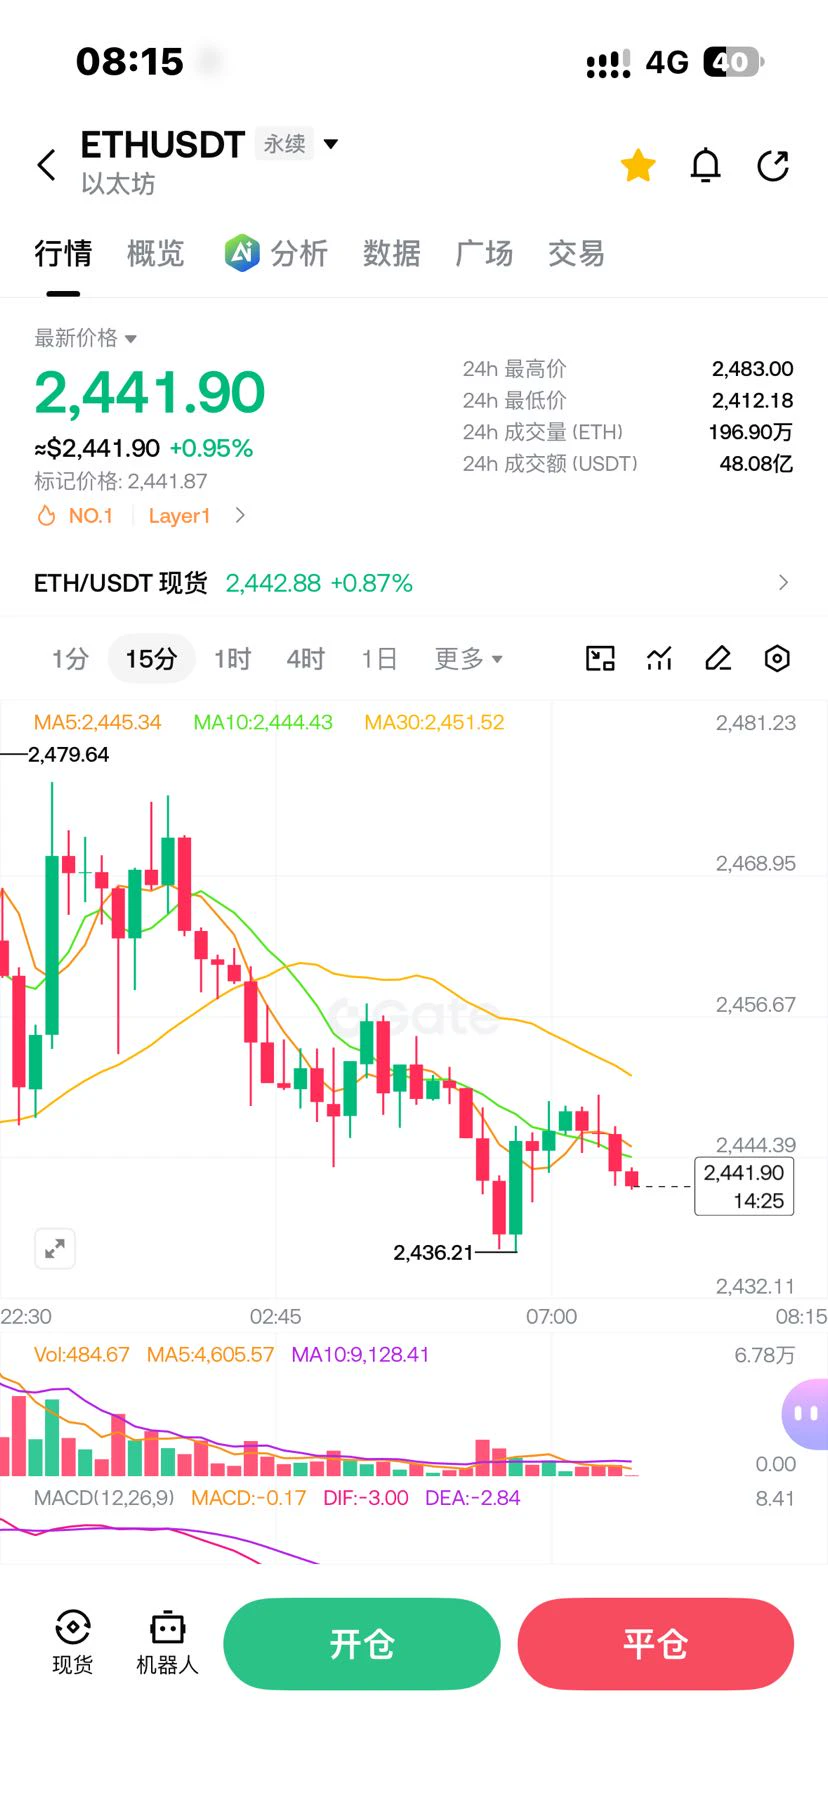
$ETH
2448Sharpening the knife😏, 2427 is a trap planted by the market makers—stepping on it means blood-soaked chips! The grass on the shorts’ graves at 2484 is already three meters high, as the whales shake out the market until your hands tremble. Break through 2484 and roll straight over it; only enter the ICU if 2427 cannot hold. Don’t wait for the explosive pump to chase—the meat will have been snatched up long ago🚀
post-image
ETH+0.88%
Load More

Join 40 M users in our growing community

⚡️ Join 40 M users in the crypto craze discussion

💬 Engage with your favorite top creators

👍 See what interests you

Trending Topics

GateTopsStockPerpetualCoverage

36.31k Views1.89k Discussing

According to the latest DefiLlama report, Gate has listed 385 stock-related perpetual contracts, ranking first in coverage; average daily volume is about $1.15B and average open interest about $738M, both ranking third in the industry; liquidity depth for its five highest-volume contracts — SNDK, SKHYNIX, SPCX, SOXL, and MU — ranks first across the board. How do you view Gate leading in both coverage breadth and liquidity depth? [👉 Full Report](ttps://defillama.com/research/spotlight/deep-enough-trade-gate-case-tokens-stocks)

GateTrenchesExclusive0GasTrading

46.32k Views875 Discussing

FedHikes25bpsForFirstTimeIn3Years

32.64k Views8.55k Discussing

View More